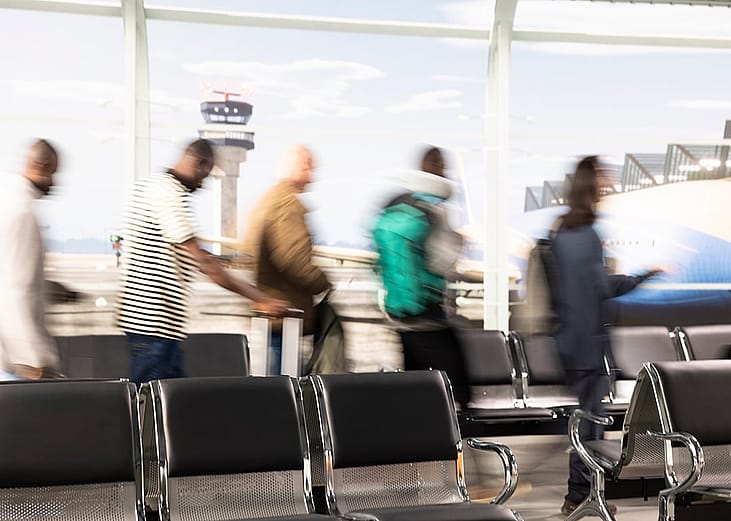
About 1 in 5 passengers who flew in the U.S. in 2023 had to deal with the misfortune of their flight leaving late. Even though airlines publish their schedules, they don't guarantee them.
These days, flight delays are trending higher and higher, according to statistics from the Department of Transportation. In 2018 and 2019, before the COVID-19 pandemic, the average share of departure delays for flights in the U.S. was 19% and 19.5%, respectively. In 2022 and 2023 (as of August), departure delays were up to 21.5% and 22%, the highest average in nearly a decade.
Unlike the more generous regulations in the European Union, U.S. carriers are not obligated to compensate passengers for flight delays. However, each company has its own policy, so travelers may be able to get something in exchange for the headache of a delay. It's always advisable to check with the airline to see if they will make accommodations, such as rebooking on a different flight or providing meal vouchers.
Since the federal government doesn't require airlines to provide passengers with delay protections, it's up to the flying public to ensure a delayed flight doesn't ruin plans. When traveling for an immovable event like a wedding or cruise, for example, consider leaving a day in advance to add a buffer for any potential delays. Some travel insurance policies also compensate for long delays and could provide reimbursements for food, hotels, and more.
It's wise to be particularly cautious when flying from certain U.S. airports that report more flight delays across all U.S. airlines than others. TravelPerk explored 25 of the biggest airports in the country and ranked them according to the share of departure flights that experience delays, using data from the Department of Transportation from September 2022 to August 2023.
Continue reading to find out if your nearest airport is prone to pushing back flight times.
Jacob Boomsma // Shutterstock
1 / 25#25. Minneapolis-St Paul International
- City: Minneapolis, Minnesota
- Total flights from September 2022 to August 2023: 120,552
- Percent of flights delayed at least 15 minutes: 16.7%
- Median minutes delayed: 16
- Most common destinations: DEN, ORD, ATL
ZikG // Shutterstock
2 / 25#24. Salt Lake City International
- City: Salt Lake City, Utah
- Total flights from September 2022 to August 2023: 108,272
- Percent of flights delayed at least 15 minutes: 17.6%
- Median minutes delayed: 14
- Most common destinations: DEN, PHX, LAX
EQRoy // Shutterstock
3 / 25#23. Detroit Metro Wayne County
- City: Detroit, Michigan
- Total flights from September 2022 to August 2023: 124,715
- Percent of flights delayed at least 15 minutes: 17.8%
- Median minutes delayed: 18
- Most common destinations: ATL, ORD, LGA
Douglas Litchfield // Shutterstock
4 / 25#22. Ronald Reagan Washington National
- City: Washington, D.C.
- Total flights from September 2022 to August 2023: 143,183
- Percent of flights delayed at least 15 minutes: 18.1%
- Median minutes delayed: 19
- Most common destinations: BOS, ATL, LGA
EQRoy // Shutterstock
5 / 25#21. Seattle/Tacoma International
- City: Seattle, Washington
- Total flights from September 2022 to August 2023: 175,949
- Percent of flights delayed at least 15 minutes: 18.2%
- Median minutes delayed: 13
- Most common destinations: PDX, ANC, LAX
EQRoy // Shutterstock
6 / 25#20. Philadelphia International
- City: Philadelphia, Pennsylvania
- Total flights from September 2022 to August 2023: 98,234
- Percent of flights delayed at least 15 minutes: 18.4%
- Median minutes delayed: 20
- Most common destinations: MCO, ATL, BOS
Michael Rosebrock // Shutterstock
7 / 25#19. Los Angeles International
- City: Los Angeles, California
- Total flights from September 2022 to August 2023: 192,726
- Percent of flights delayed at least 15 minutes: 19.7%
- Median minutes delayed: 16
- Most common destinations: SFO, LAS, JFK
JHVEPhoto // Shutterstock
8 / 25#18. San Francisco International
- City: San Francisco, California
- Total flights from September 2022 to August 2023: 134,948
- Percent of flights delayed at least 15 minutes: 20.4%
- Median minutes delayed: 15
- Most common destinations: LAX, JFK, SEA
Scott Heaney // Shutterstock
9 / 25#17. LaGuardia
- City: New York, New York
- Total flights from September 2022 to August 2023: 168,772
- Percent of flights delayed at least 15 minutes: 20.5%
- Median minutes delayed: 23
- Most common destinations: ORD, BOS, ATL
Coffee Mate // Shutterstock
10 / 25#16. Chicago O'Hare International
- City: Chicago, Illinois
- Total flights from September 2022 to August 2023: 277,274
- Percent of flights delayed at least 15 minutes: 20.7%
- Median minutes delayed: 18
- Most common destinations: LGA, LAX, DCA
LisaCarter // Shutterstock
11 / 25#15. Charlotte Douglas International
- City: Charlotte, North Carolina
- Total flights from September 2022 to August 2023: 206,146
- Percent of flights delayed at least 15 minutes: 20.9%
- Median minutes delayed: 19
- Most common destinations: MCO, LGA, ATL
Scott Heaney // Shutterstock
12 / 25#14. Nashville International
- City: Nashville, Tennessee
- Total flights from September 2022 to August 2023: 94,327
- Percent of flights delayed at least 15 minutes: 21.6%
- Median minutes delayed: 15
- Most common destinations: LGA, ORD, CLT
Austin Deppe // Shutterstock
13 / 25#13. Hartsfield-Jackson Atlanta International
- City: Atlanta, Georgia
- Total flights from September 2022 to August 2023: 330,268
- Percent of flights delayed at least 15 minutes: 22.0%
- Median minutes delayed: 17
- Most common destinations: MCO, LGA, FLL
Kate Scott // Shutterstock
14 / 25#12. Phoenix Sky Harbor International
- City: Phoenix, Arizona
- Total flights from September 2022 to August 2023: 171,771
- Percent of flights delayed at least 15 minutes: 22.4%
- Median minutes delayed: 15
- Most common destinations: DEN, LAS, SEA
Leena Robinson // Shutterstock
15 / 25#11. Logan International
- City: Boston, Massachusetts
- Total flights from September 2022 to August 2023: 141,691
- Percent of flights delayed at least 15 minutes: 22.5%
- Median minutes delayed: 21
- Most common destinations: DCA, LGA, JFK
stock_photo_world // Shutterstock
16 / 25#10. Austin - Bergstrom International
- City: Austin, Texas
- Total flights from September 2022 to August 2023: 91,862
- Percent of flights delayed at least 15 minutes: 22.6%
- Median minutes delayed: 17
- Most common destinations: DFW, DEN, LAX
JW_PNW // Shutterstock
17 / 25#9. George Bush Intercontinental/Houston
- City: Houston, Texas
- Total flights from September 2022 to August 2023: 139,511
- Percent of flights delayed at least 15 minutes: 23.7%
- Median minutes delayed: 18
- Most common destinations: DFW, LAX, DEN
Kate Scott // Shutterstock
18 / 25#8. John F. Kennedy International
- City: New York, New York
- Total flights from September 2022 to August 2023: 136,057
- Percent of flights delayed at least 15 minutes: 24.3%
- Median minutes delayed: 23
- Most common destinations: LAX, SFO, BOS
JW_PNW // Shutterstock
19 / 25#7. Dallas/Fort Worth International
- City: Dallas/Fort Worth, Texas
- Total flights from September 2022 to August 2023: 279,358
- Percent of flights delayed at least 15 minutes: 25.1%
- Median minutes delayed: 23
- Most common destinations: LAX, ATL, LGA
EQRoy // Shutterstock
20 / 25#6. Newark Liberty International
- City: Newark, New Jersey
- Total flights from September 2022 to August 2023: 144,038
- Percent of flights delayed at least 15 minutes: 25.9%
- Median minutes delayed: 20
- Most common destinations: MCO, ATL, LAX
EQRoy // Shutterstock
21 / 25#5. Miami International
- City: Miami, Florida
- Total flights from September 2022 to August 2023: 100,401
- Percent of flights delayed at least 15 minutes: 26.6%
- Median minutes delayed: 21
- Most common destinations: ATL, JFK, LGA
Kit Leong // Shutterstock
22 / 25#4. Harry Reid International
- City: Las Vegas, Nevada
- Total flights from September 2022 to August 2023: 187,617
- Percent of flights delayed at least 15 minutes: 29.1%
- Median minutes delayed: 18
- Most common destinations: LAX, DEN, SEA
Framalicious // Shutterstock
23 / 25#3. Denver International
- City: Denver, Colorado
- Total flights from September 2022 to August 2023: 288,782
- Percent of flights delayed at least 15 minutes: 29.3%
- Median minutes delayed: 16
- Most common destinations: LAS, PHX, SLC
Adam McCullough // Shutterstock
24 / 25#2. Orlando International
- City: Orlando, Florida
- Total flights from September 2022 to August 2023: 158,419
- Percent of flights delayed at least 15 minutes: 30.3%
- Median minutes delayed: 22
- Most common destinations: ATL, EWR, SJU
Kate Scott // Shutterstock
25 / 25#1. Baltimore/Washington International Thurgood Marshall
- City: Baltimore, Maryland
- Total flights from September 2022 to August 2023: 92,636
- Percent of flights delayed at least 15 minutes: 31.2%
- Median minutes delayed: 16
- Most common destinations: ATL, MCO, BOS
Story editing by Jaimie Etkin. Copy editing by Kristen Wegrzyn. Photo selection by Clarese Moller.