Stacker
1 / 50#50. Rochester
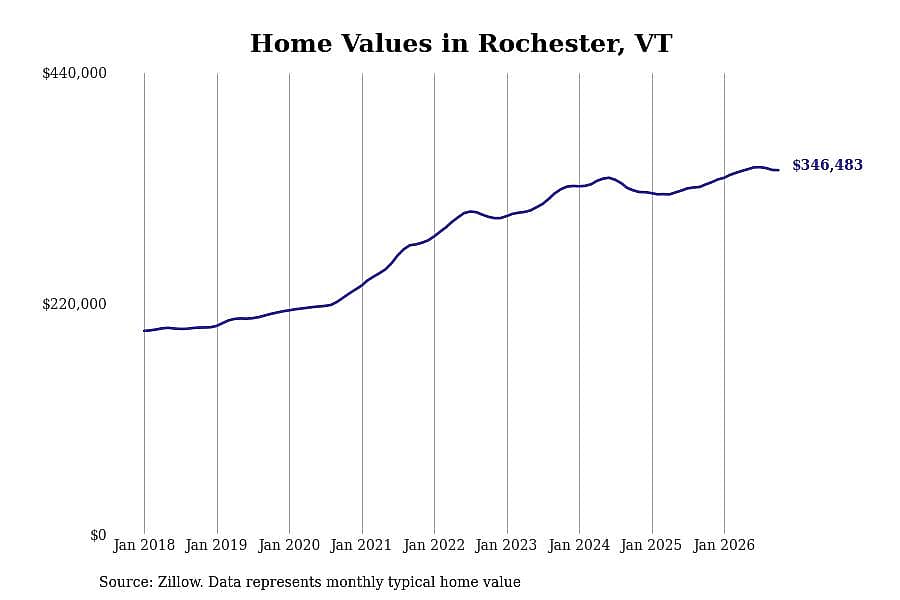
- Typical home value: $346,483
- 1-year price change: +$13,525 (+4.1%)
- 5-year price change: +$70,644 (+25.6%)
- Metro area: Lebanon, NH-VT

The real estate frenzy spurred by the coronavirus pandemic continues, though at a slower pace. Buyers are still competing for a limited supply of housing, driving up prices for affordable properties.
The typical home value in the United States was $364,812 in October, 0.7% higher than the year before.
Increasing mortgage rates have slowed growth, with prices even declining in some places. But some areas are still seeing price jumps compared to the year before.
Stacker compiled a list of cities with the fastest-growing home prices in Vermont using data from Zillow. Cities are ranked by the dollar change in the Zillow Home Values Index for all homes from the 12 months ending October 2026. The charts in this story were created automatically using Matplotlib. Data was available for 50 cities and towns in Vermont.
You may also like: Best colleges in Vermont
Stacker
1 / 50- Typical home value: $346,483
- 1-year price change: +$13,525 (+4.1%)
- 5-year price change: +$70,644 (+25.6%)
- Metro area: Lebanon, NH-VT
Stacker
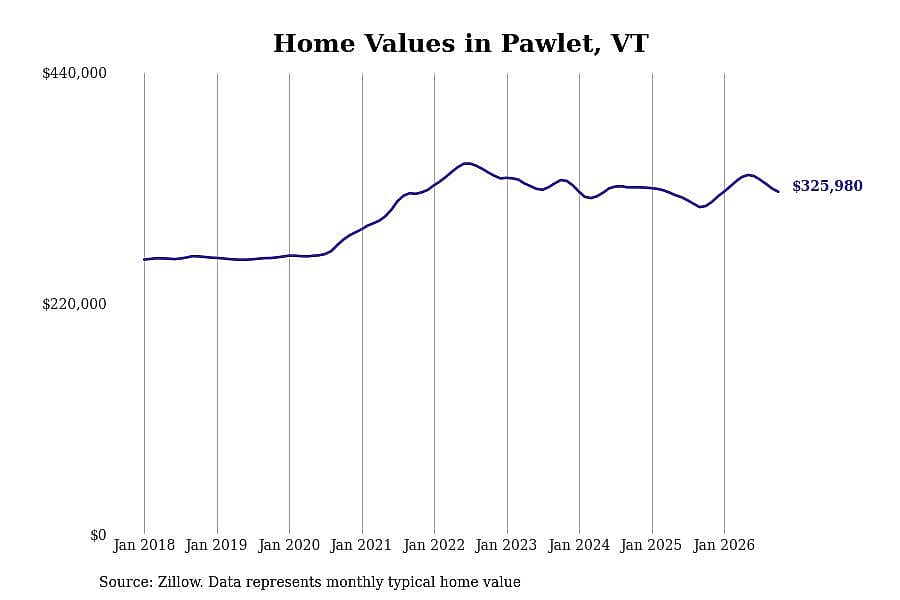
2 / 50- Typical home value: $325,980
- 1-year price change: +$13,587 (+4.3%)
- 5-year price change: +$2,005 (+0.6%)
- Metro area: Rutland, VT
Stacker
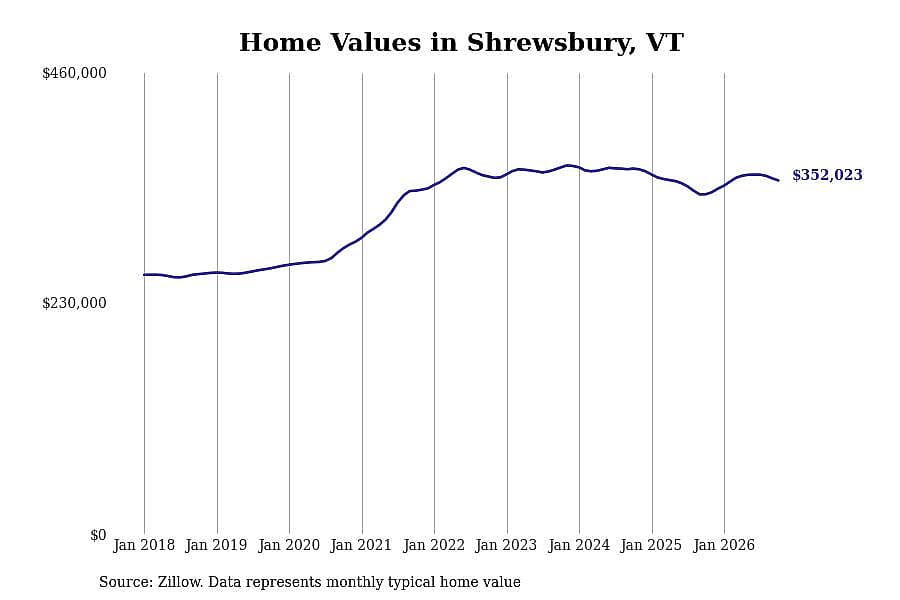
3 / 50- Typical home value: $352,023
- 1-year price change: +$13,777 (+4.1%)
- 5-year price change: +$10,185 (+3.0%)
- Metro area: Rutland, VT
Stacker
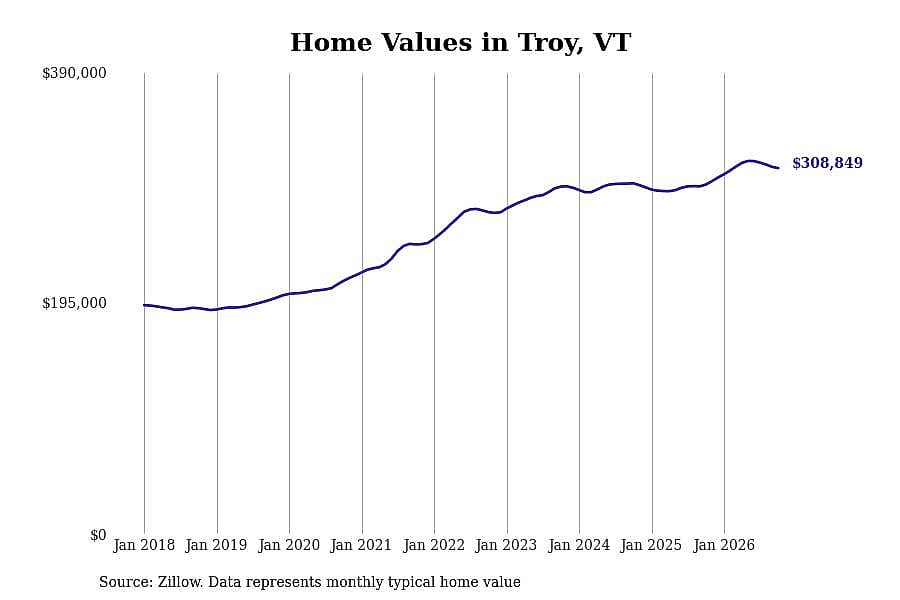
4 / 50- Typical home value: $308,849
- 1-year price change: +$13,885 (+4.7%)
- 5-year price change: +$64,392 (+26.3%)
- Metro area: not in a metro area
Stacker
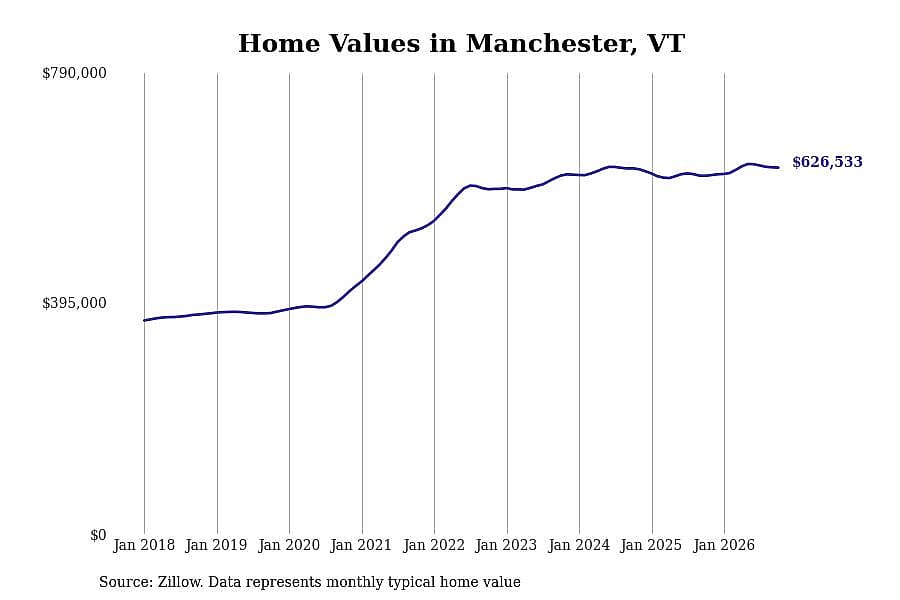
5 / 50- Typical home value: $626,533
- 1-year price change: +$13,962 (+2.3%)
- 5-year price change: +$107,313 (+20.7%)
- Metro area: Bennington, VT
You may also like: Hottest Januarys in Vermont since 1895
Stacker
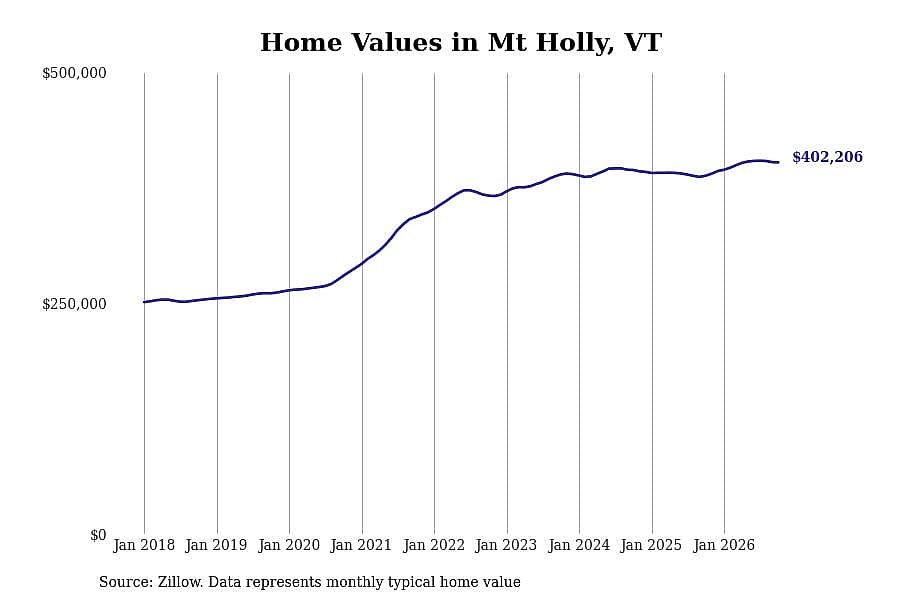
6 / 50- Typical home value: $402,206
- 1-year price change: +$14,391 (+3.7%)
- 5-year price change: +$59,003 (+17.2%)
- Metro area: Rutland, VT
Stacker
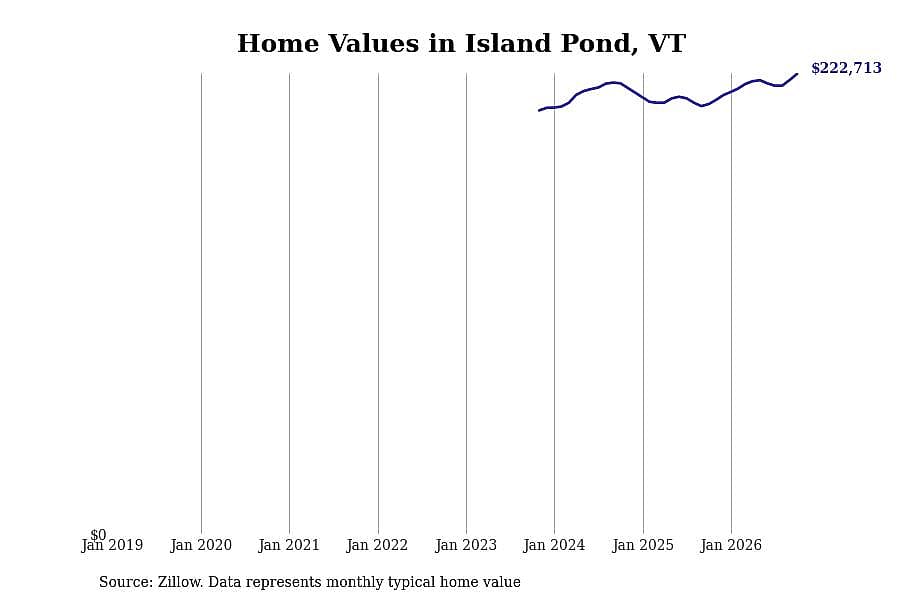
7 / 50- Typical home value: $222,713
- 1-year price change: +$14,622 (+7.0%)
- 5-year price change: data not available
- Metro area: not in a metro area
Stacker
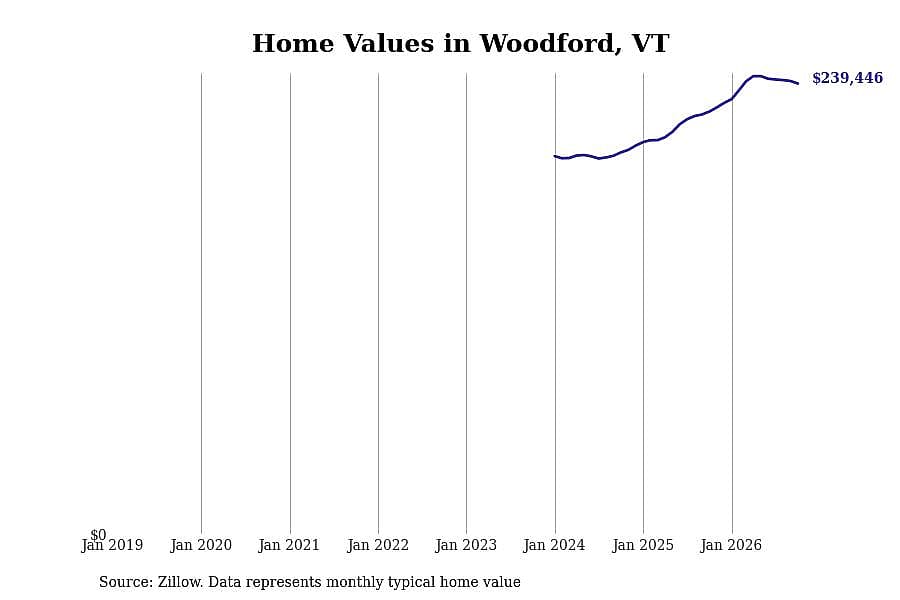
8 / 50- Typical home value: $239,446
- 1-year price change: +$14,892 (+6.6%)
- 5-year price change: data not available
- Metro area: Bennington, VT
Stacker
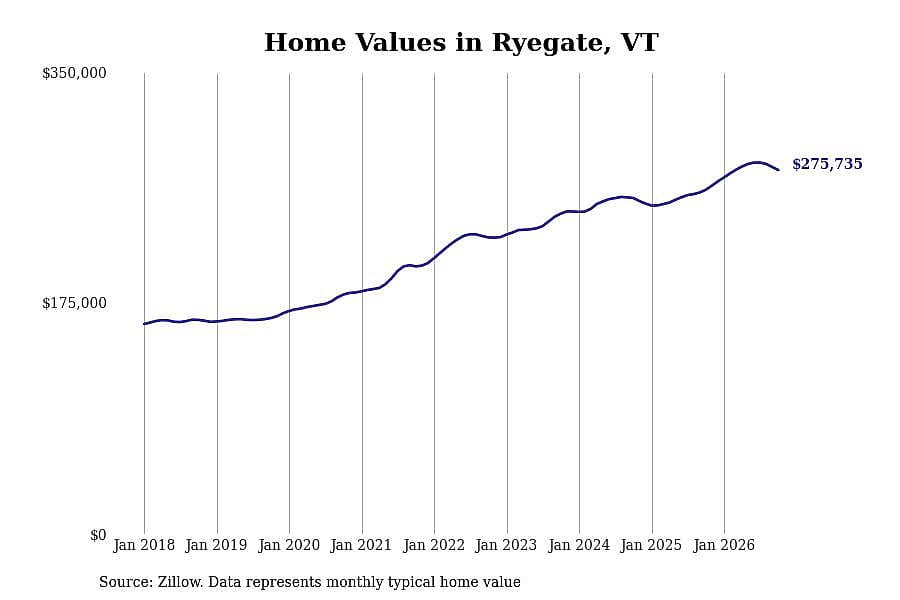
9 / 50- Typical home value: $275,735
- 1-year price change: +$14,908 (+5.7%)
- 5-year price change: +$73,002 (+36.0%)
- Metro area: not in a metro area
Stacker
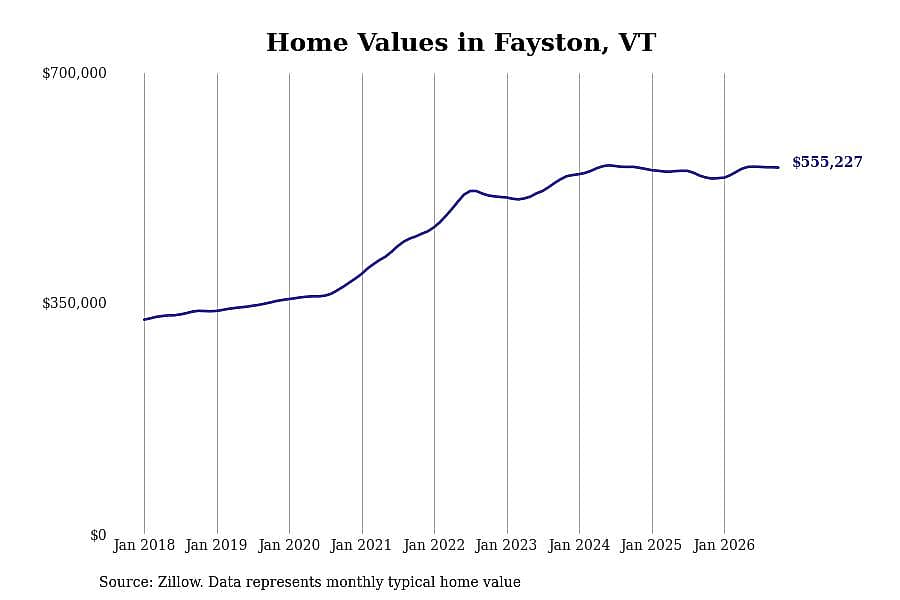
10 / 50- Typical home value: $555,227
- 1-year price change: +$15,108 (+2.8%)
- 5-year price change: +$104,264 (+23.1%)
- Metro area: Barre, VT
You may also like: Coldest Februarys in Vermont since 1895
Stacker
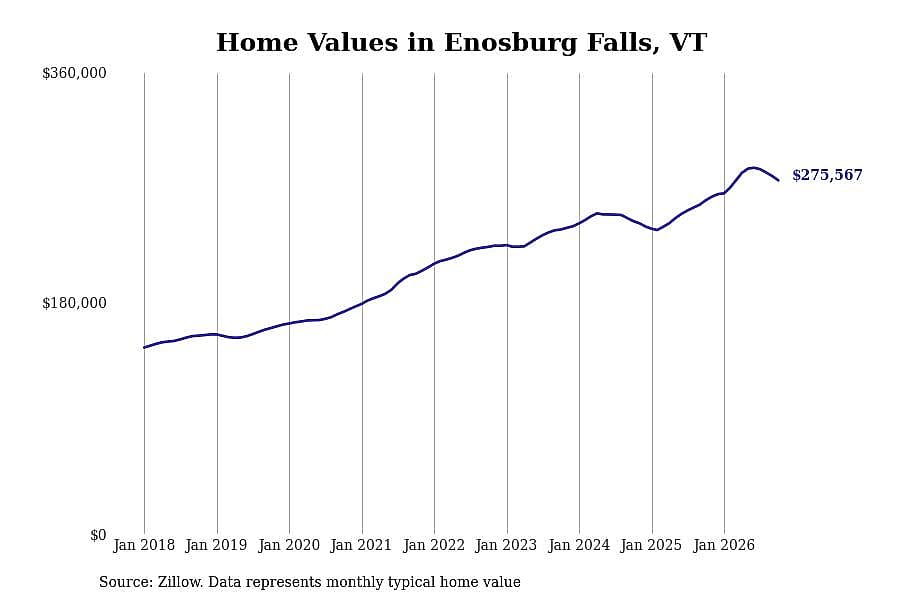
11 / 50- Typical home value: $275,567
- 1-year price change: +$15,497 (+6.0%)
- 5-year price change: +$72,777 (+35.9%)
- Metro area: Burlington-South Burlington, VT
Stacker
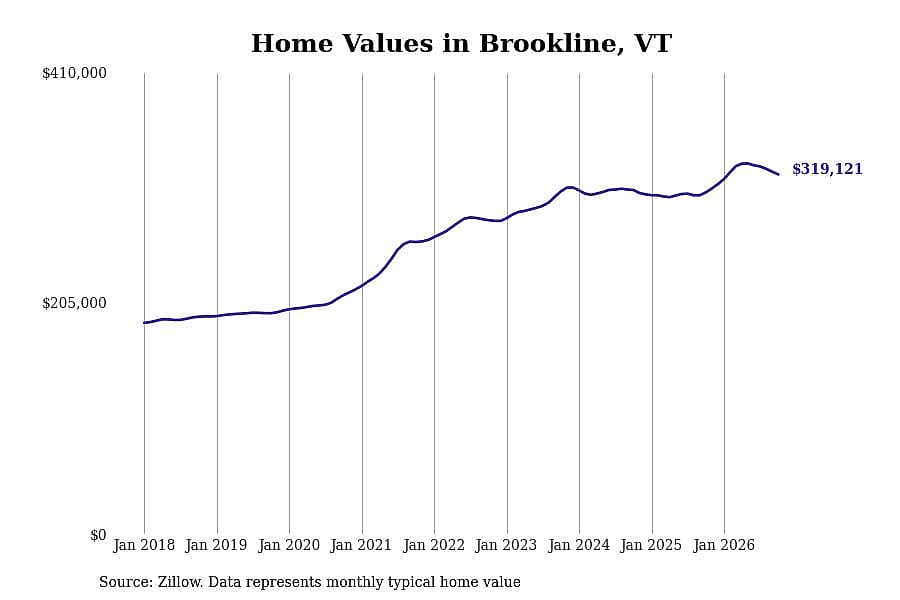
12 / 50- Typical home value: $319,121
- 1-year price change: +$15,956 (+5.3%)
- 5-year price change: +$59,998 (+23.2%)
- Metro area: not in a metro area
Stacker
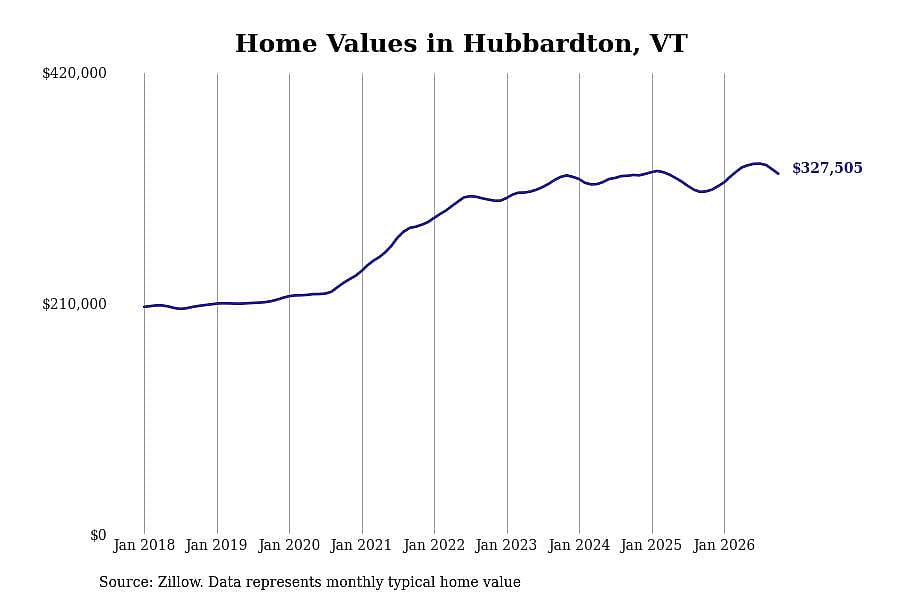
13 / 50- Typical home value: $327,505
- 1-year price change: +$16,070 (+5.2%)
- 5-year price change: +$48,136 (+17.2%)
- Metro area: Rutland, VT
Stacker
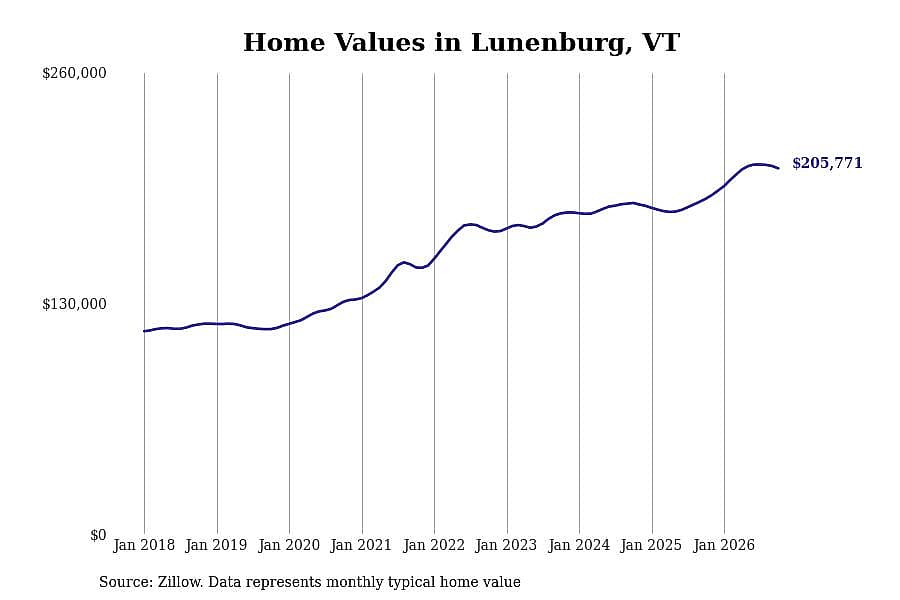
14 / 50- Typical home value: $205,771
- 1-year price change: +$17,054 (+9.0%)
- 5-year price change: +$55,734 (+37.1%)
- Metro area: not in a metro area
Stacker
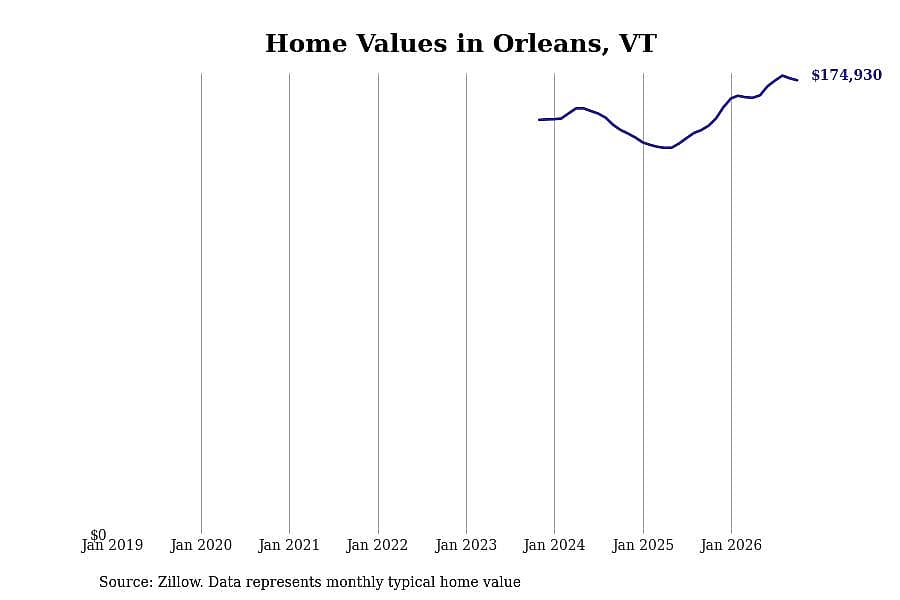
15 / 50- Typical home value: $174,930
- 1-year price change: +$17,436 (+11.1%)
- 5-year price change: data not available
- Metro area: not in a metro area
You may also like: How manufactured housing prices have changed in Vermont
Stacker
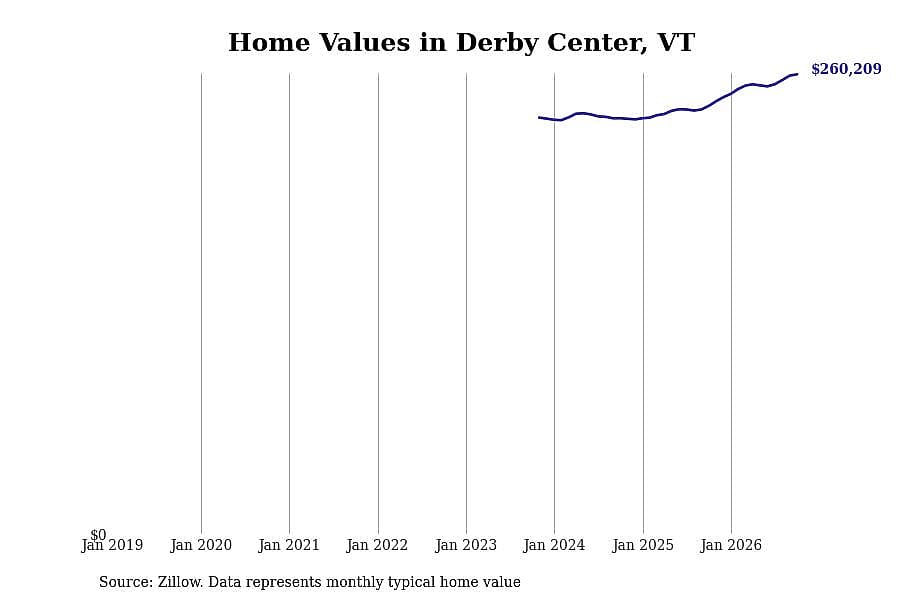
16 / 50- Typical home value: $260,209
- 1-year price change: +$17,855 (+7.4%)
- 5-year price change: data not available
- Metro area: not in a metro area
Stacker
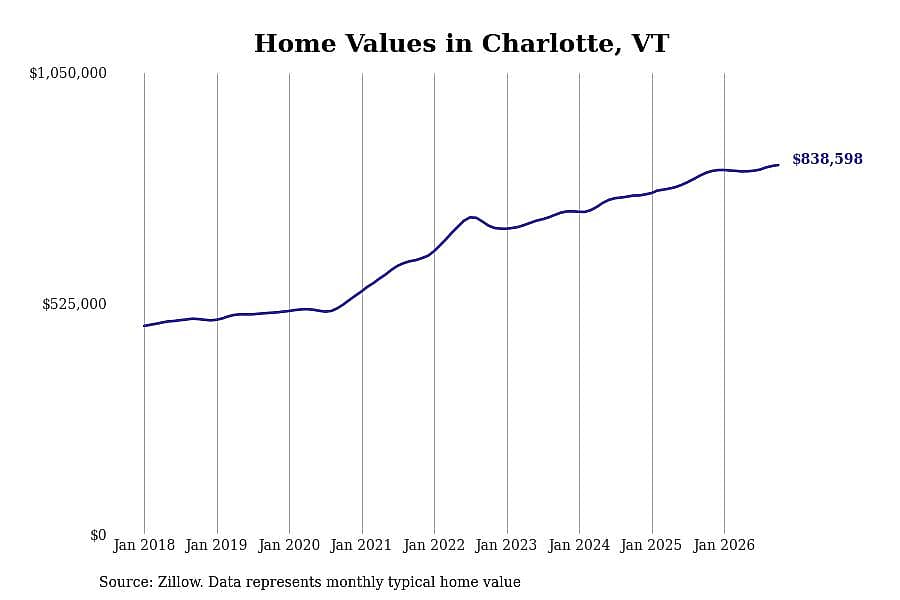
17 / 50- Typical home value: $838,598
- 1-year price change: +$17,897 (+2.2%)
- 5-year price change: +$216,080 (+34.7%)
- Metro area: Burlington-South Burlington, VT
Stacker
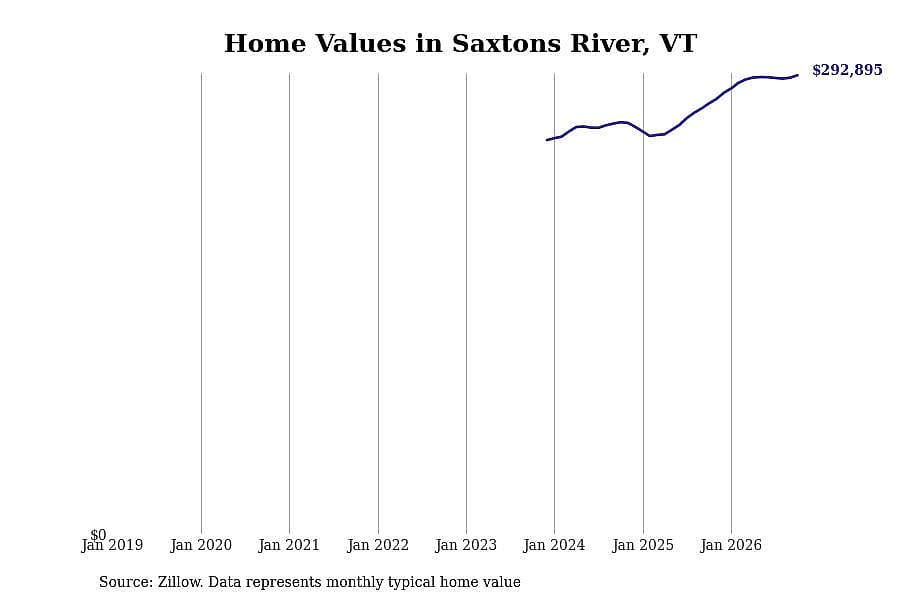
18 / 50- Typical home value: $292,895
- 1-year price change: +$17,902 (+6.5%)
- 5-year price change: data not available
- Metro area: not in a metro area
Stacker
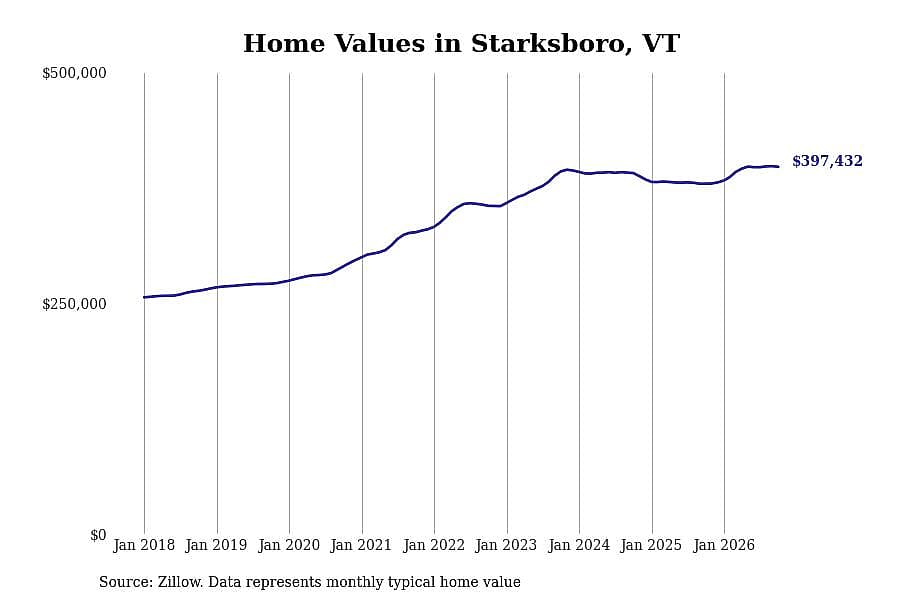
19 / 50- Typical home value: $397,432
- 1-year price change: +$18,233 (+4.8%)
- 5-year price change: +$70,806 (+21.7%)
- Metro area: not in a metro area
Stacker
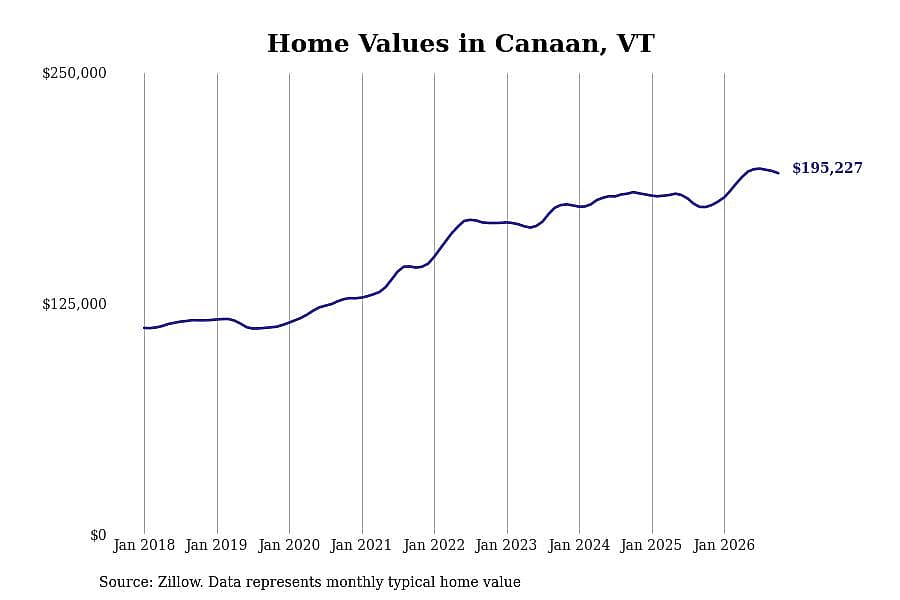
20 / 50- Typical home value: $195,227
- 1-year price change: +$18,274 (+10.3%)
- 5-year price change: +$51,064 (+35.4%)
- Metro area: not in a metro area
You may also like: Easy as pie: See the most uniquely popular pie in Vermont
Stacker
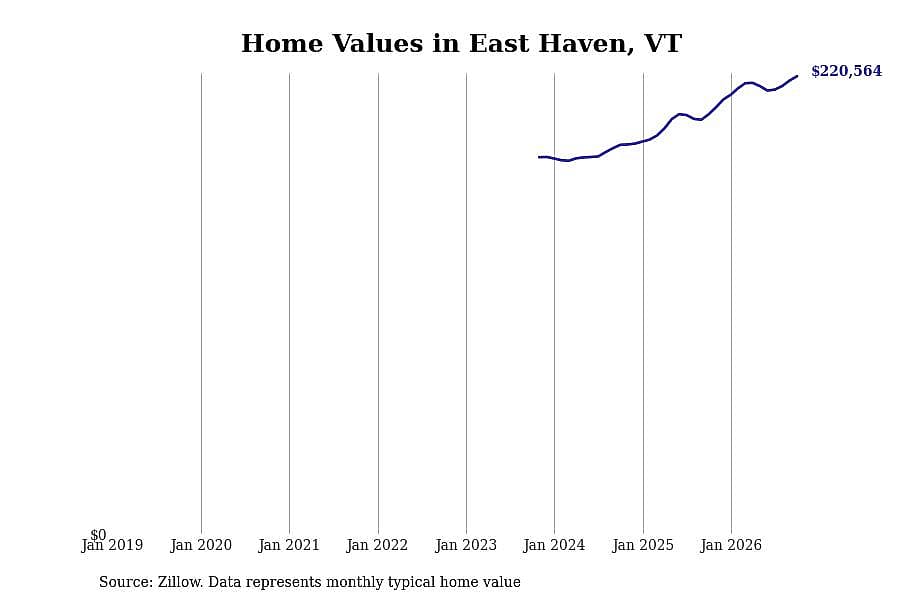
21 / 50- Typical home value: $220,564
- 1-year price change: +$18,293 (+9.0%)
- 5-year price change: data not available
- Metro area: not in a metro area
Stacker
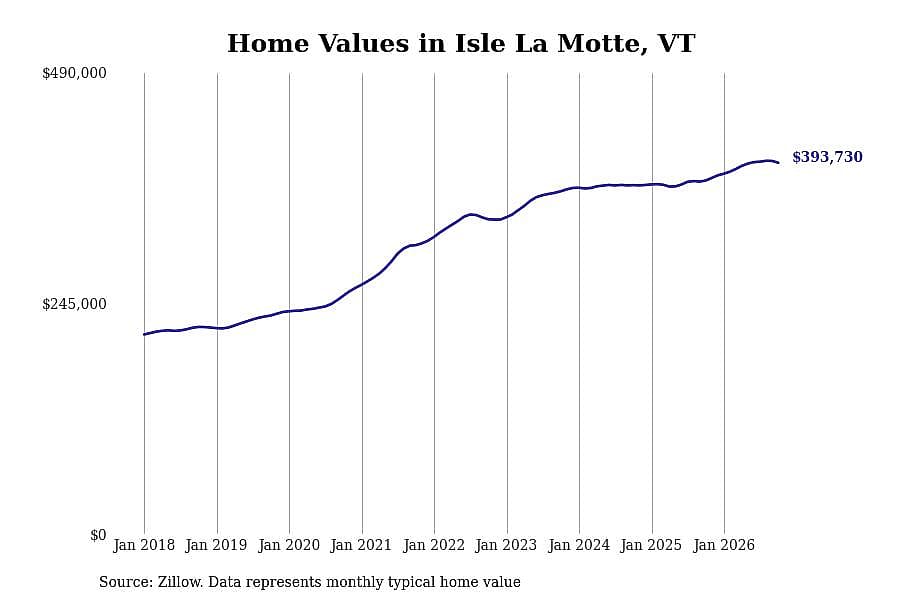
22 / 50- Typical home value: $393,730
- 1-year price change: +$18,736 (+5.0%)
- 5-year price change: +$87,321 (+28.5%)
- Metro area: Burlington-South Burlington, VT
Stacker
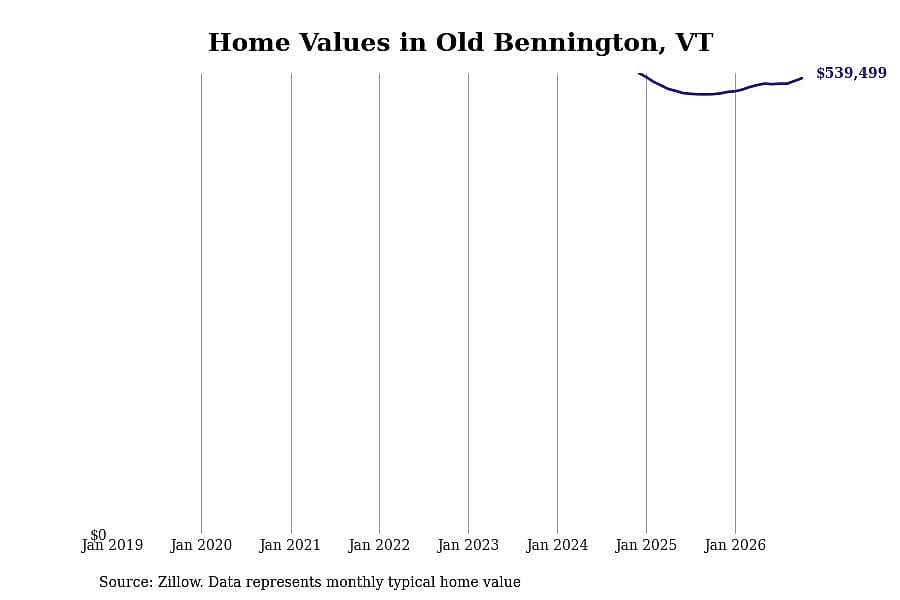
23 / 50- Typical home value: $539,499
- 1-year price change: +$18,935 (+3.6%)
- 5-year price change: data not available
- Metro area: Bennington, VT
Stacker
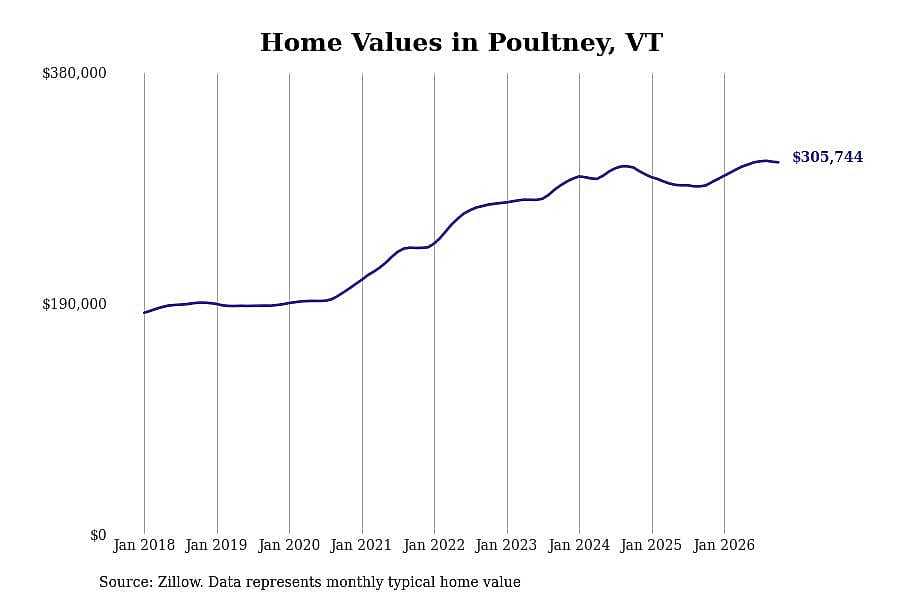
24 / 50- Typical home value: $305,744
- 1-year price change: +$18,996 (+6.6%)
- 5-year price change: +$70,485 (+30.0%)
- Metro area: Rutland, VT
Stacker
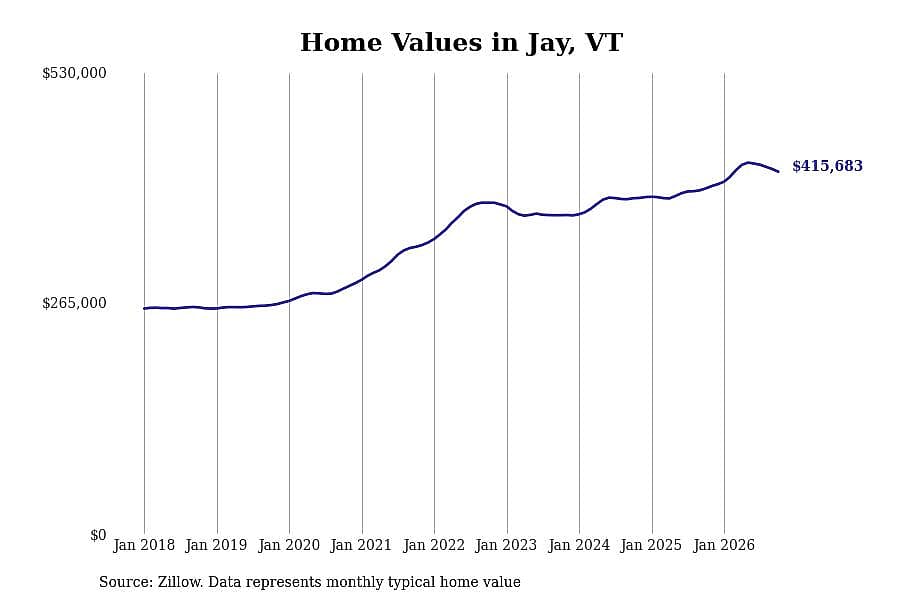
25 / 50- Typical home value: $415,683
- 1-year price change: +$19,220 (+4.8%)
- 5-year price change: +$86,183 (+26.2%)
- Metro area: not in a metro area
You may also like: Best public high schools in Vermont
Stacker
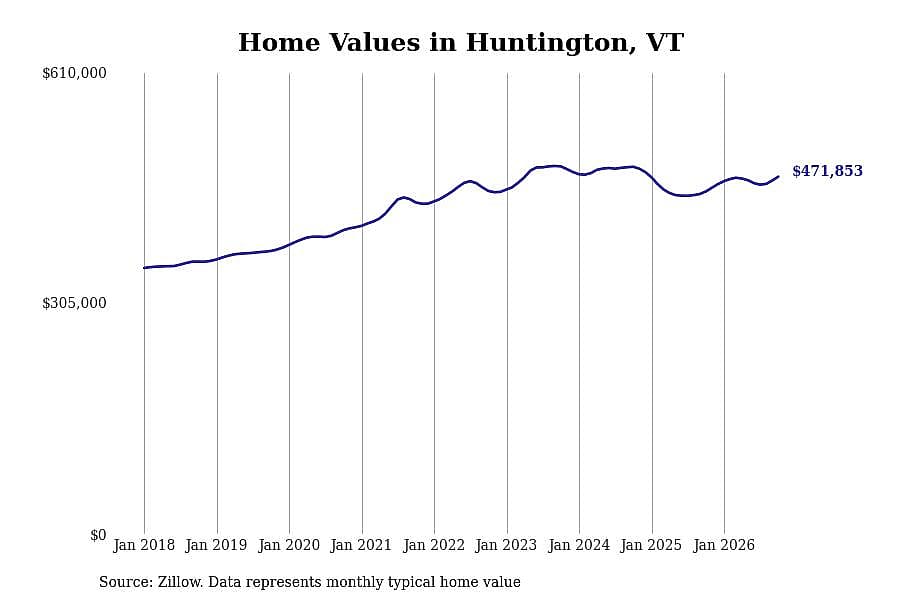
26 / 50- Typical home value: $471,853
- 1-year price change: +$19,589 (+4.3%)
- 5-year price change: +$34,178 (+7.8%)
- Metro area: Burlington-South Burlington, VT
Stacker
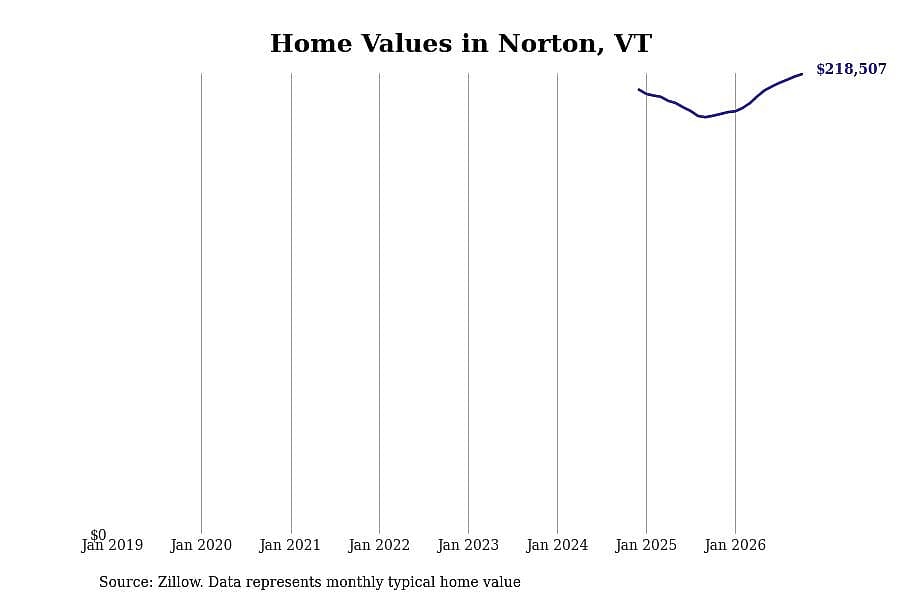
27 / 50- Typical home value: $218,507
- 1-year price change: +$19,766 (+9.9%)
- 5-year price change: data not available
- Metro area: not in a metro area
Stacker
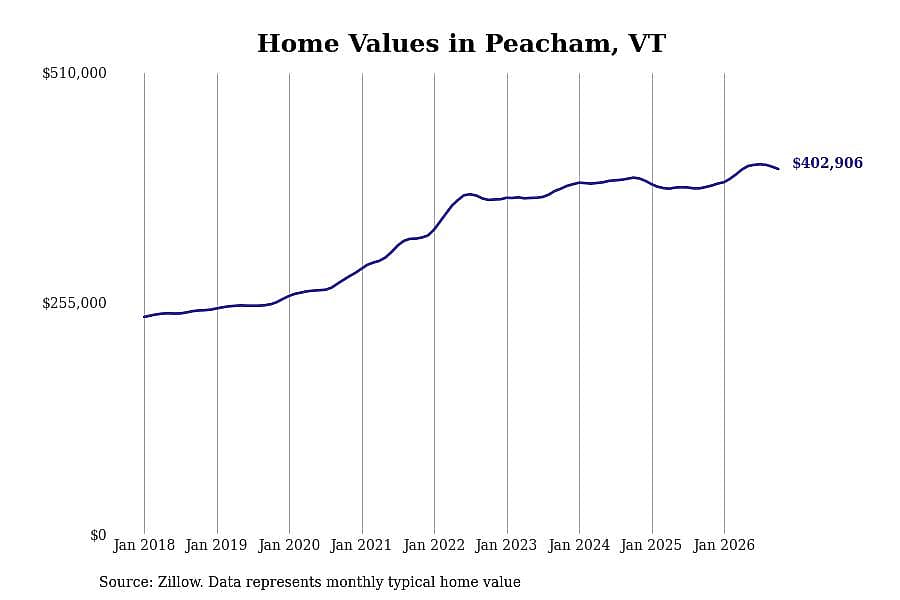
28 / 50- Typical home value: $402,906
- 1-year price change: +$19,854 (+5.2%)
- 5-year price change: +$76,791 (+23.5%)
- Metro area: not in a metro area
Stacker
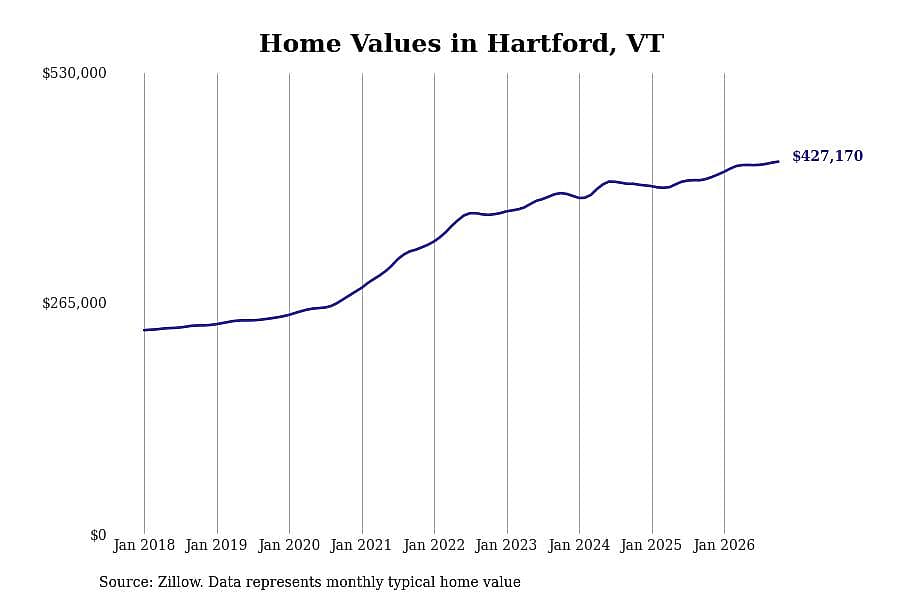
29 / 50- Typical home value: $427,170
- 1-year price change: +$19,994 (+4.9%)
- 5-year price change: +$100,980 (+31.0%)
- Metro area: Lebanon, NH-VT
Stacker
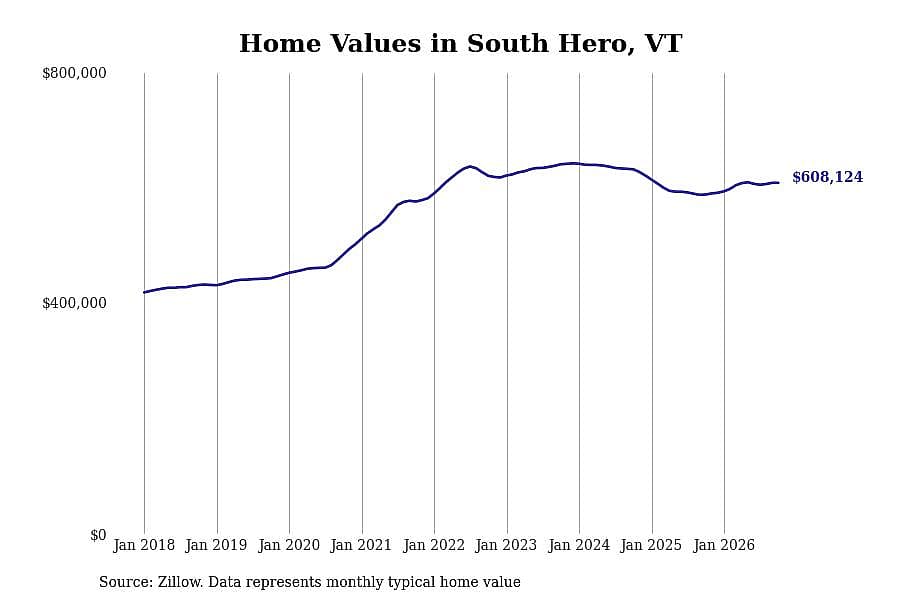
30 / 50- Typical home value: $608,124
- 1-year price change: +$20,204 (+3.4%)
- 5-year price change: +$32,428 (+5.6%)
- Metro area: Burlington-South Burlington, VT
You may also like: How much does assisted living cost in Vermont?
Stacker
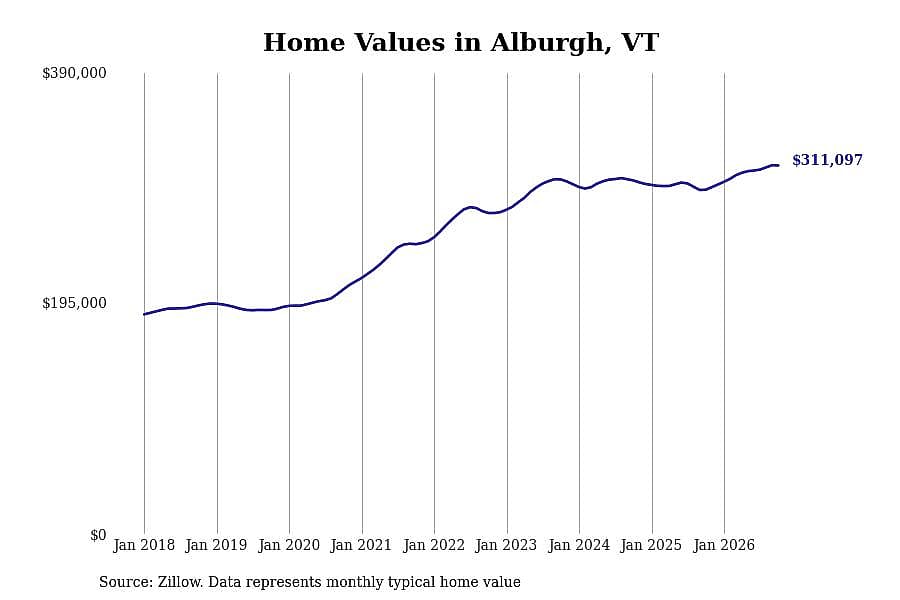
31 / 50- Typical home value: $311,097
- 1-year price change: +$20,442 (+7.0%)
- 5-year price change: +$66,472 (+27.2%)
- Metro area: Burlington-South Burlington, VT
Stacker
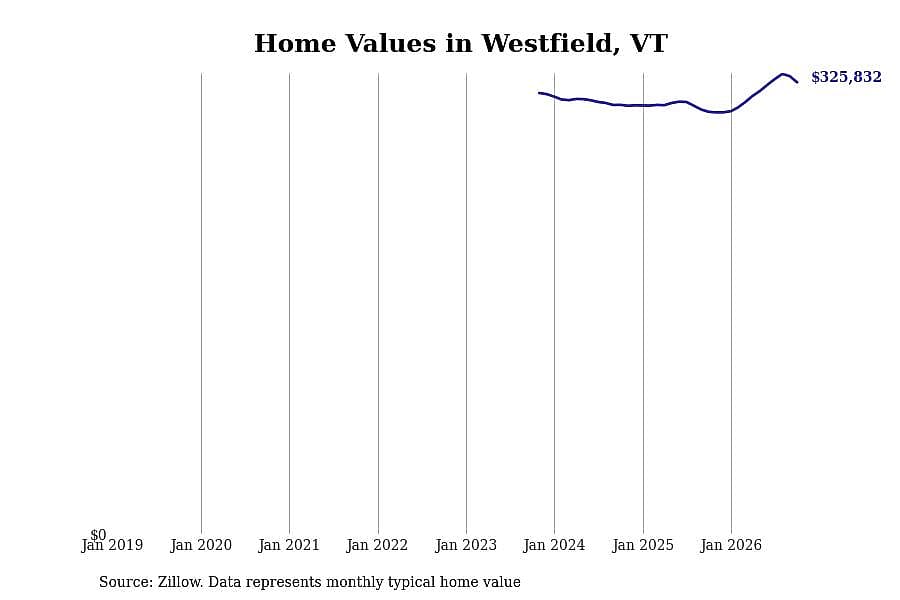
32 / 50- Typical home value: $325,832
- 1-year price change: +$21,340 (+7.0%)
- 5-year price change: data not available
- Metro area: not in a metro area
Stacker
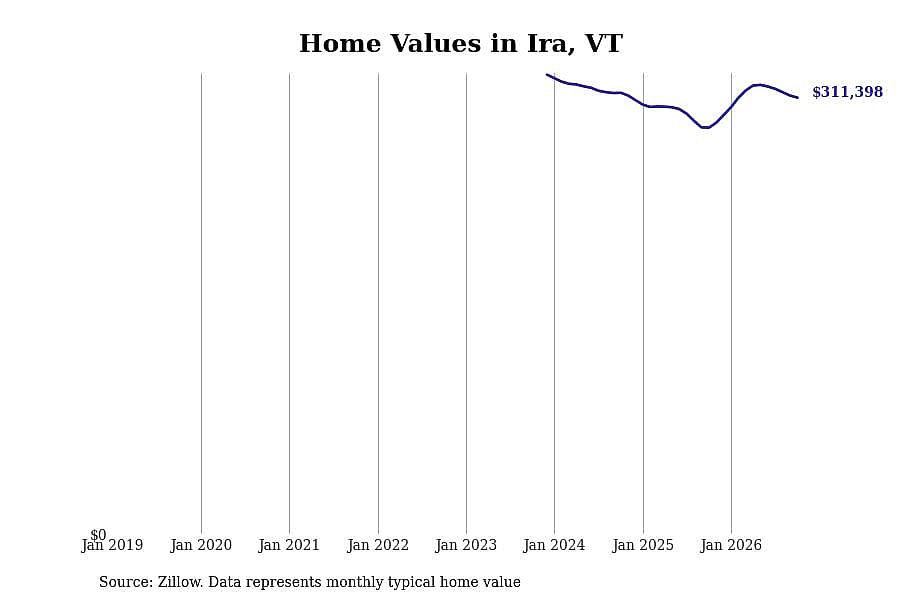
33 / 50- Typical home value: $311,398
- 1-year price change: +$21,348 (+7.4%)
- 5-year price change: data not available
- Metro area: Rutland, VT
Stacker
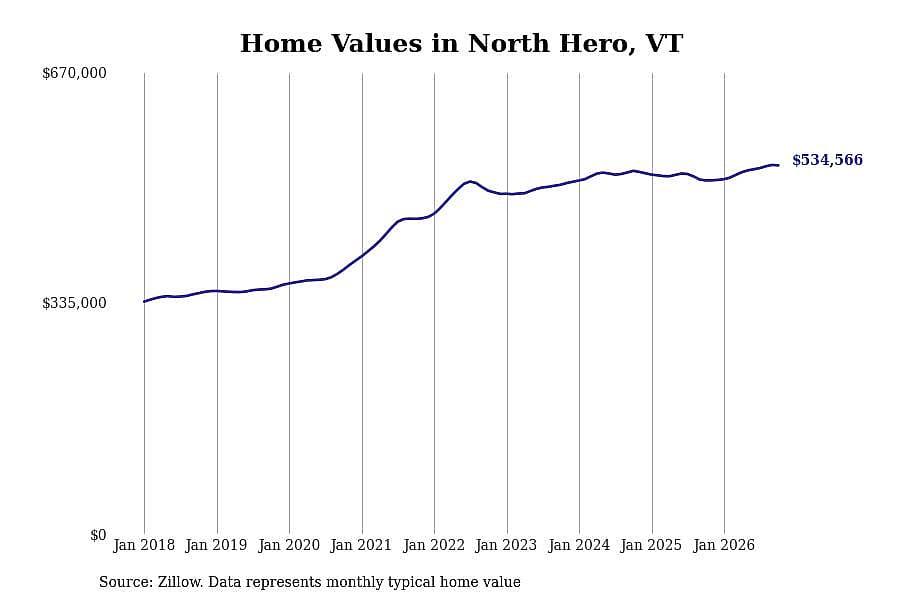
34 / 50- Typical home value: $534,566
- 1-year price change: +$21,839 (+4.3%)
- 5-year price change: +$77,547 (+17.0%)
- Metro area: Burlington-South Burlington, VT
Stacker
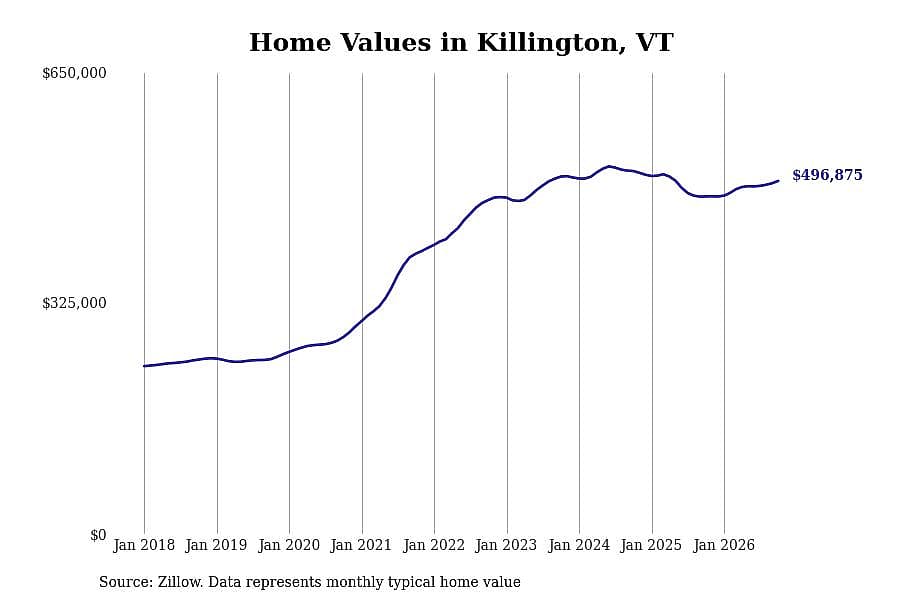
35 / 50- Typical home value: $496,875
- 1-year price change: +$22,009 (+4.6%)
- 5-year price change: +$102,339 (+25.9%)
- Metro area: Rutland, VT
You may also like: Counties with the most born-and-bred residents in Vermont
Stacker
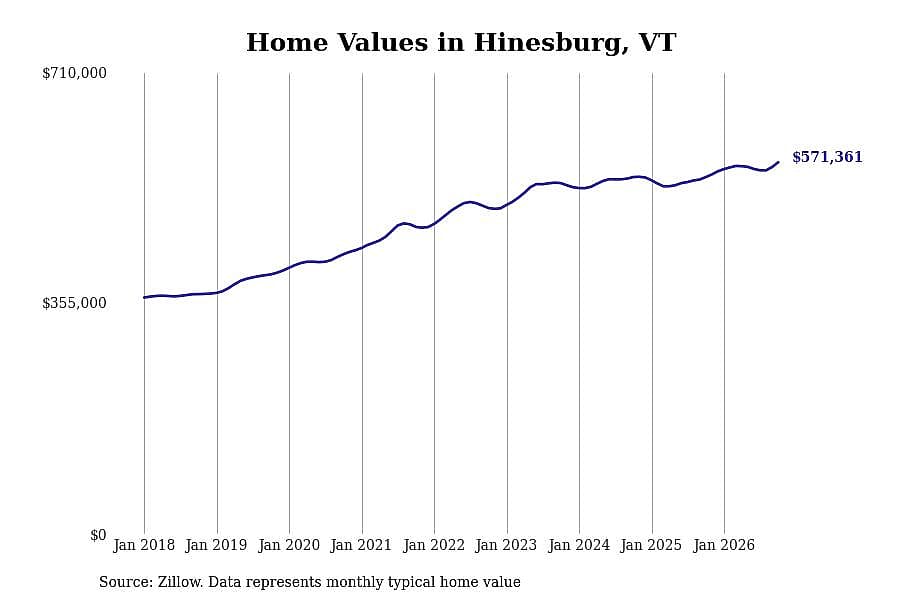
36 / 50- Typical home value: $571,361
- 1-year price change: +$22,872 (+4.2%)
- 5-year price change: +$99,453 (+21.1%)
- Metro area: Burlington-South Burlington, VT
Stacker
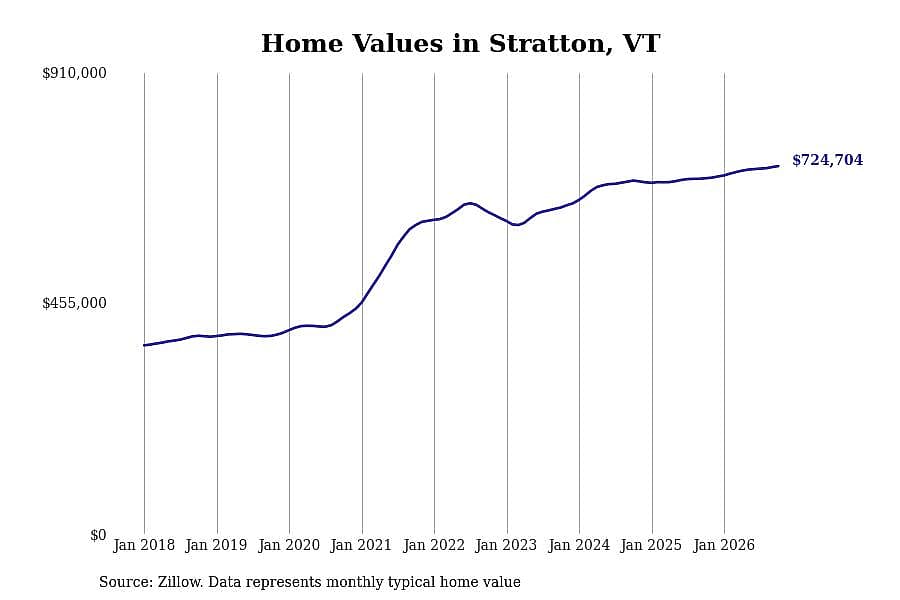
37 / 50- Typical home value: $724,704
- 1-year price change: +$23,885 (+3.4%)
- 5-year price change: +$115,908 (+19.0%)
- Metro area: not in a metro area
Stacker
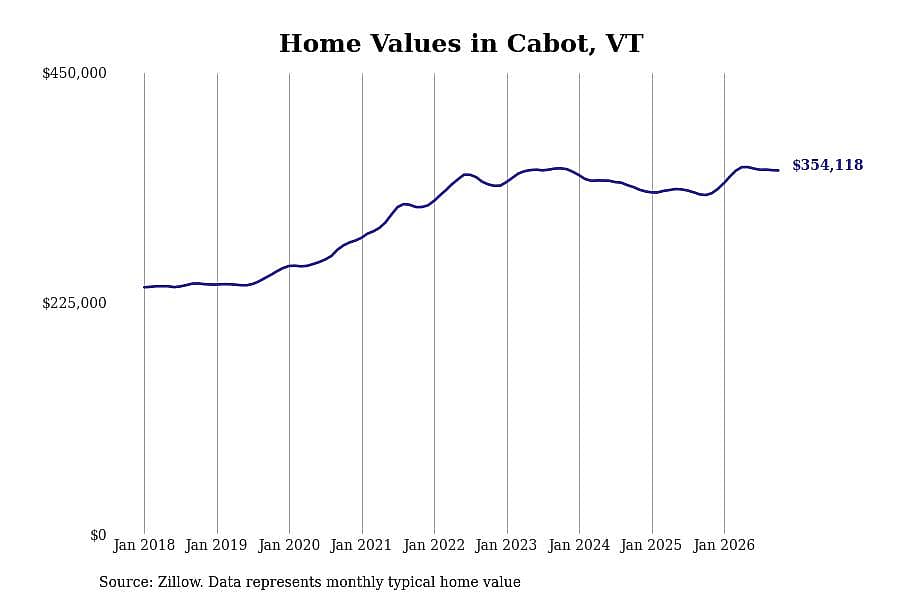
38 / 50- Typical home value: $354,118
- 1-year price change: +$23,938 (+7.2%)
- 5-year price change: +$35,659 (+11.2%)
- Metro area: Barre, VT
Stacker
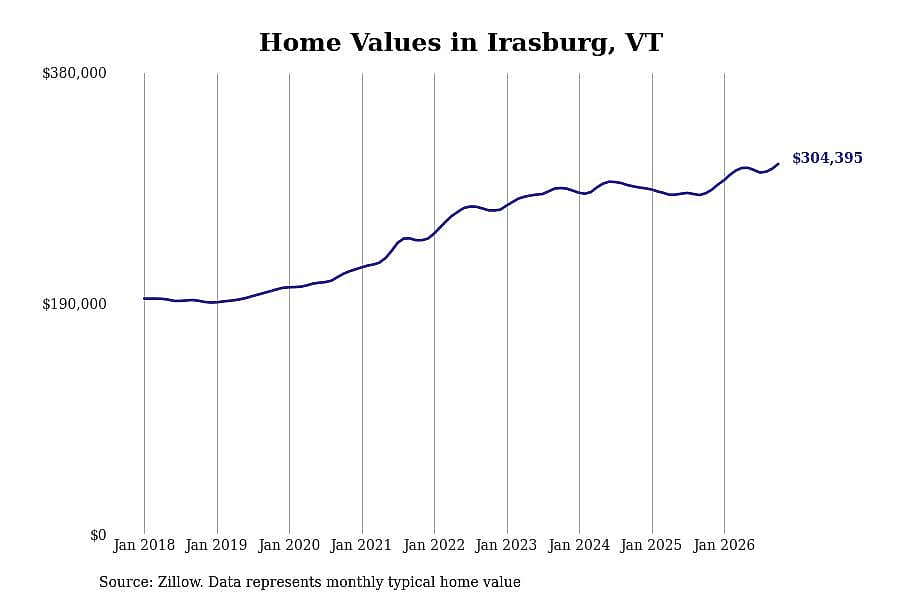
39 / 50- Typical home value: $304,395
- 1-year price change: +$24,085 (+8.6%)
- 5-year price change: +$62,713 (+25.9%)
- Metro area: not in a metro area
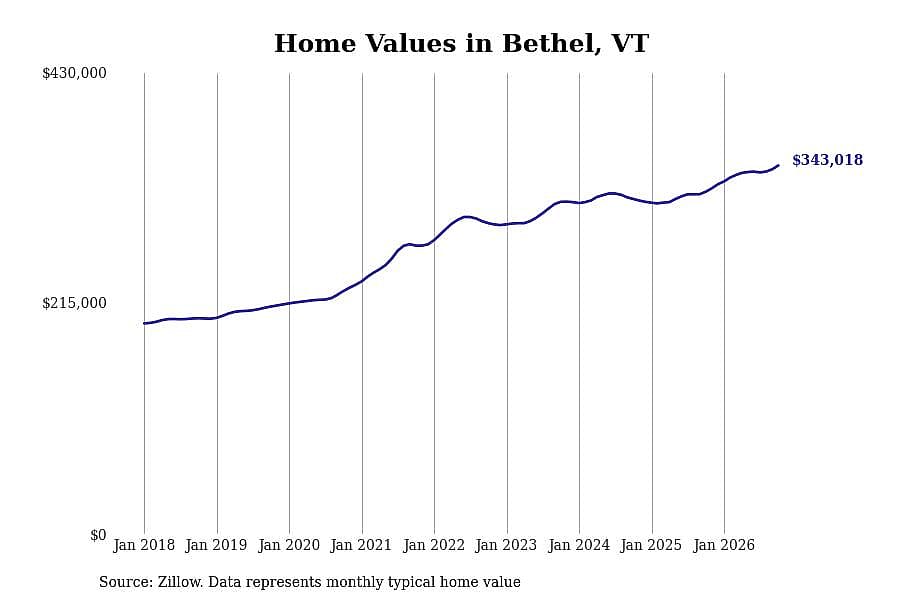
Stacker
40 / 50- Typical home value: $343,018
- 1-year price change: +$24,373 (+7.6%)
- 5-year price change: +$74,604 (+27.8%)
- Metro area: Lebanon, NH-VT
You may also like: Vermont frozen pizza trends, according to Instacart data
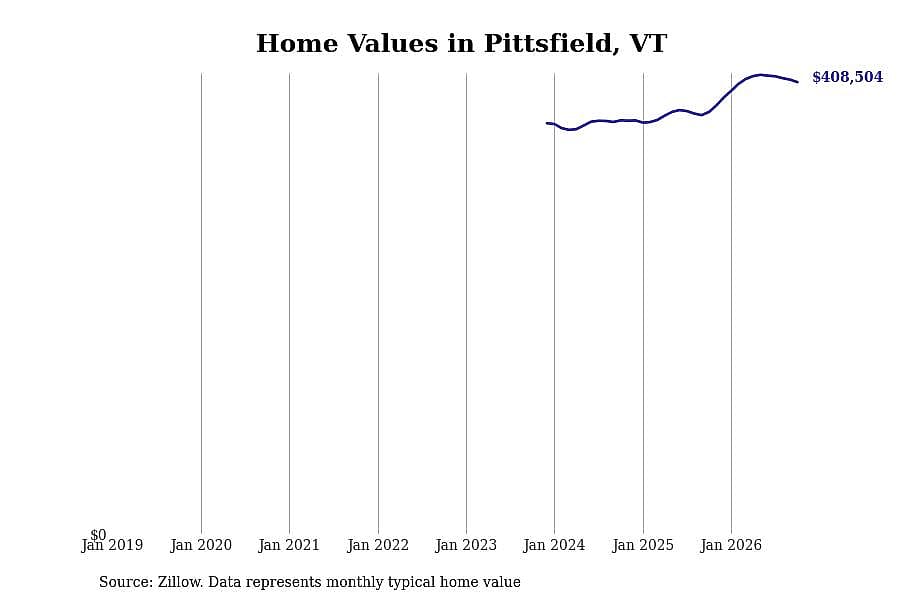
Stacker
41 / 50- Typical home value: $408,504
- 1-year price change: +$26,880 (+7.0%)
- 5-year price change: data not available
- Metro area: Rutland, VT
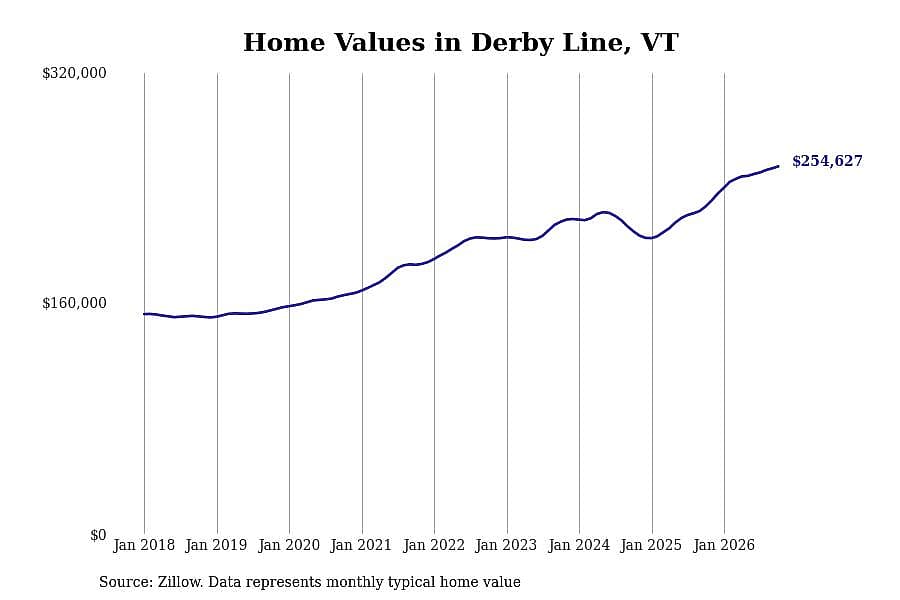
Stacker
42 / 50- Typical home value: $254,627
- 1-year price change: +$27,596 (+12.2%)
- 5-year price change: +$68,187 (+36.6%)
- Metro area: not in a metro area
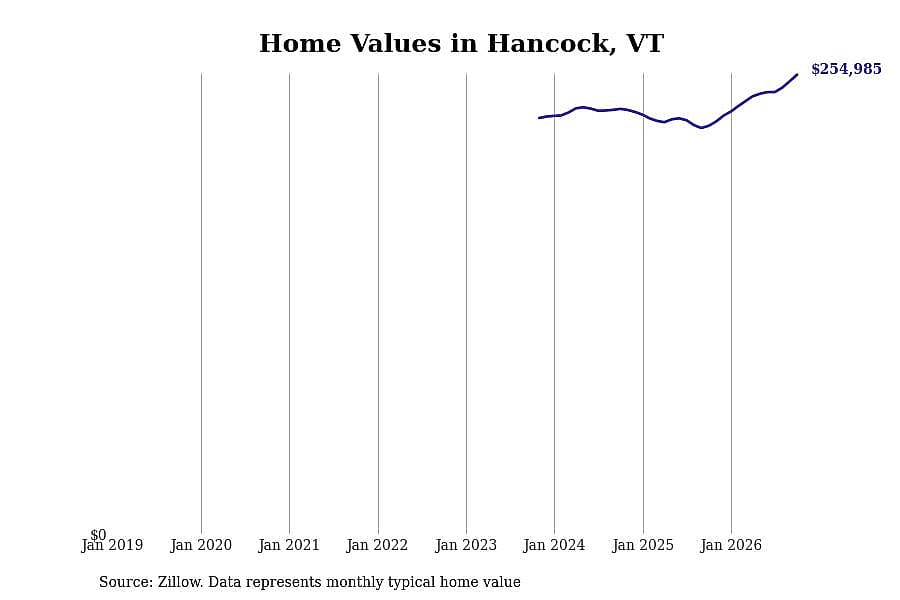
Stacker
43 / 50- Typical home value: $254,985
- 1-year price change: +$28,364 (+12.5%)
- 5-year price change: data not available
- Metro area: not in a metro area
Stacker
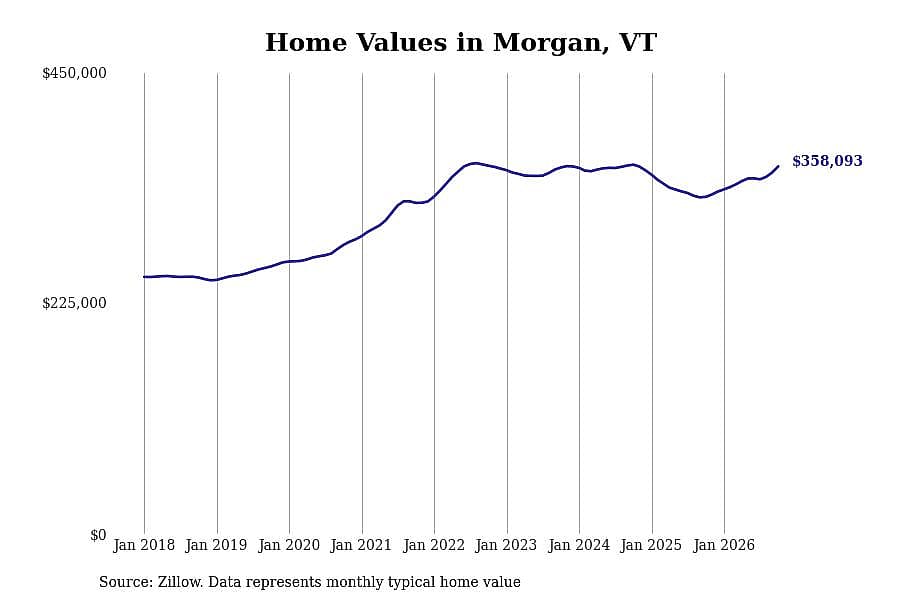
44 / 50- Typical home value: $358,093
- 1-year price change: +$29,726 (+9.1%)
- 5-year price change: +$35,559 (+11.0%)
- Metro area: not in a metro area
Stacker
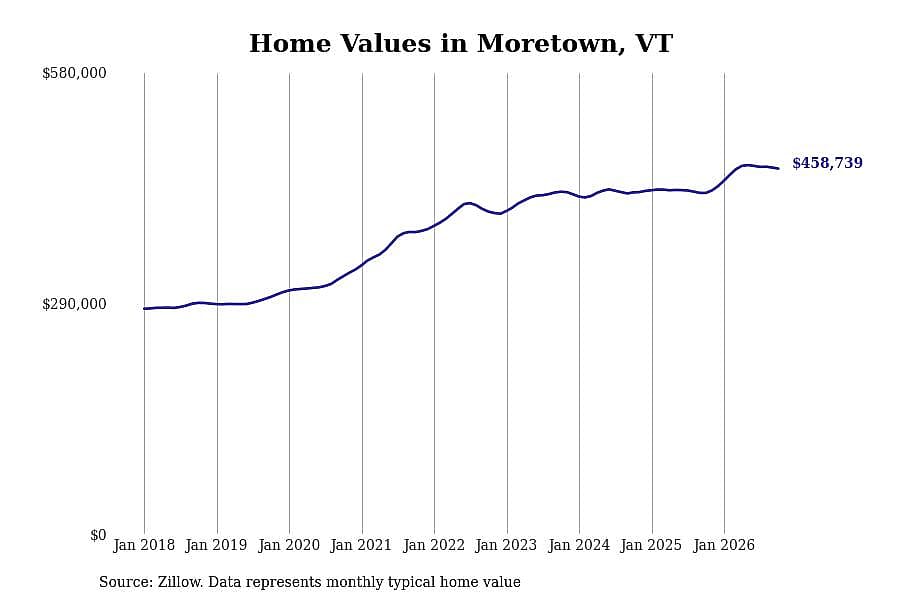
45 / 50- Typical home value: $458,739
- 1-year price change: +$30,560 (+7.1%)
- 5-year price change: +$79,727 (+21.0%)
- Metro area: Barre, VT
You may also like: The 10 most competitive housing markets in Vermont
Stacker
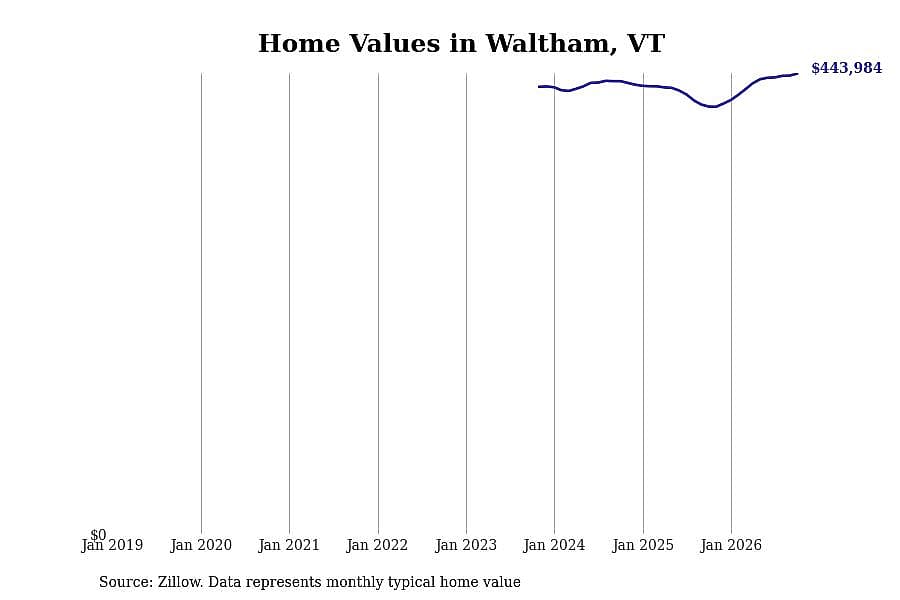
46 / 50- Typical home value: $443,984
- 1-year price change: +$31,762 (+7.7%)
- 5-year price change: data not available
- Metro area: not in a metro area
Stacker
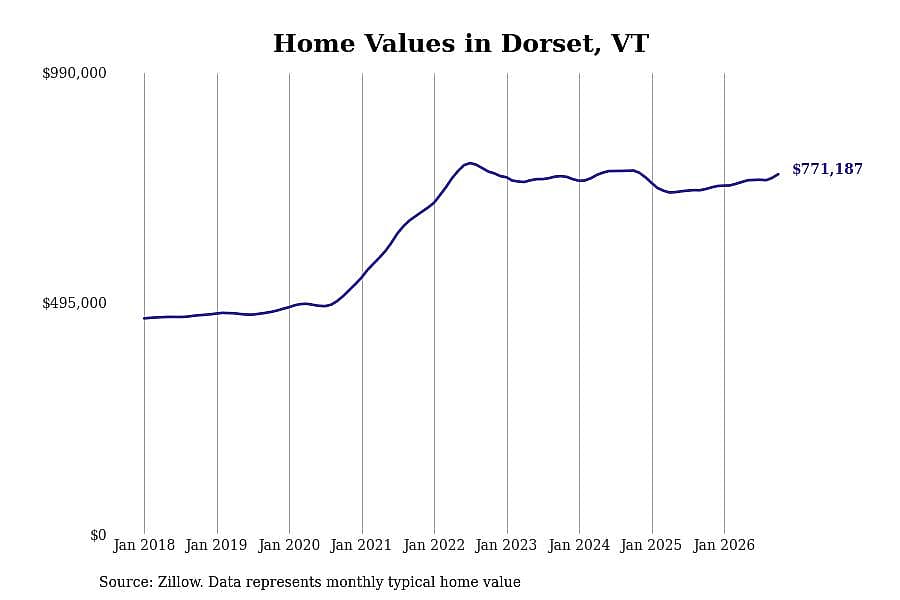
47 / 50- Typical home value: $771,187
- 1-year price change: +$31,935 (+4.3%)
- 5-year price change: +$89,644 (+13.2%)
- Metro area: Bennington, VT
Stacker
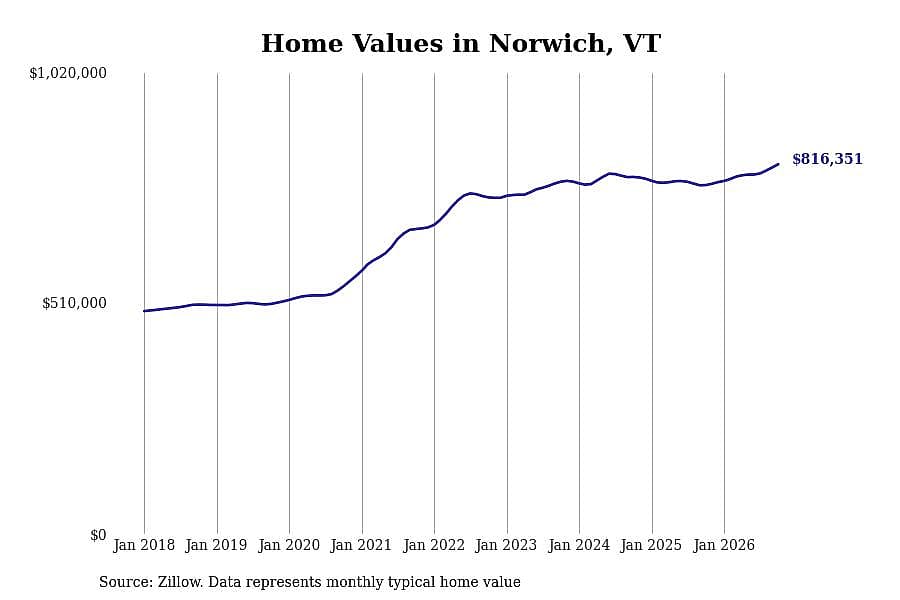
48 / 50- Typical home value: $816,351
- 1-year price change: +$45,998 (+6.0%)
- 5-year price change: +$143,071 (+21.2%)
- Metro area: Lebanon, NH-VT
Stacker
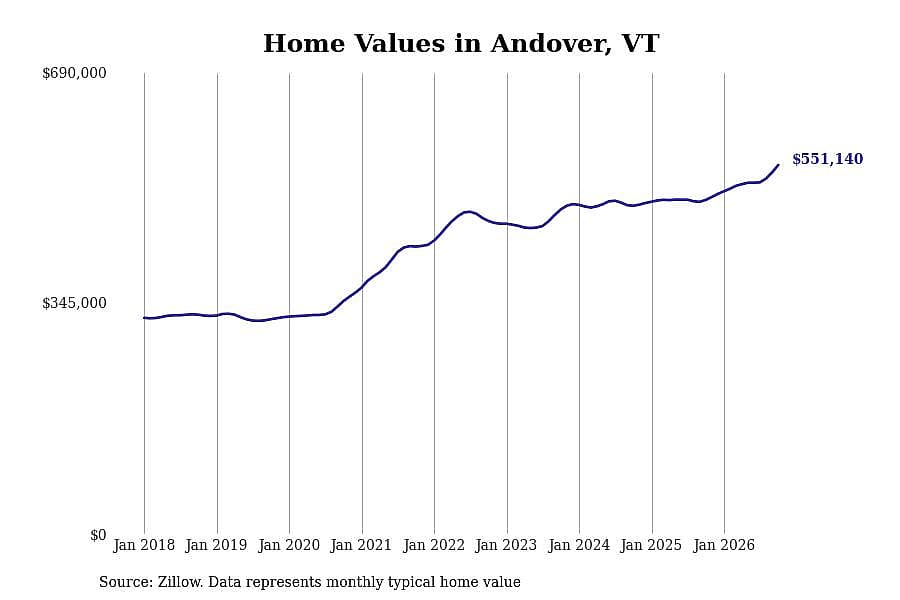
49 / 50- Typical home value: $551,140
- 1-year price change: +$52,122 (+10.4%)
- 5-year price change: +$121,834 (+28.4%)
- Metro area: Lebanon, NH-VT
Stacker
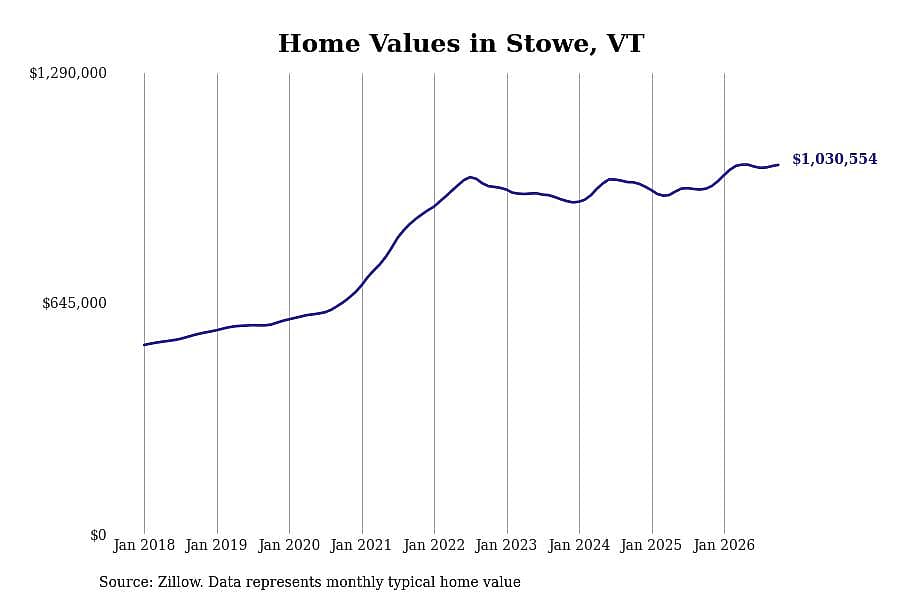
50 / 50- Typical home value: $1,030,554
- 1-year price change: +$66,323 (+6.9%)
- 5-year price change: +$150,364 (+17.1%)
- Metro area: not in a metro area
You may also like: The most popular grocery items for Christmas in Vermont, according to Instacart