Counties with the highest cancer rates in Vermont

·Stacker

Canva
Canva

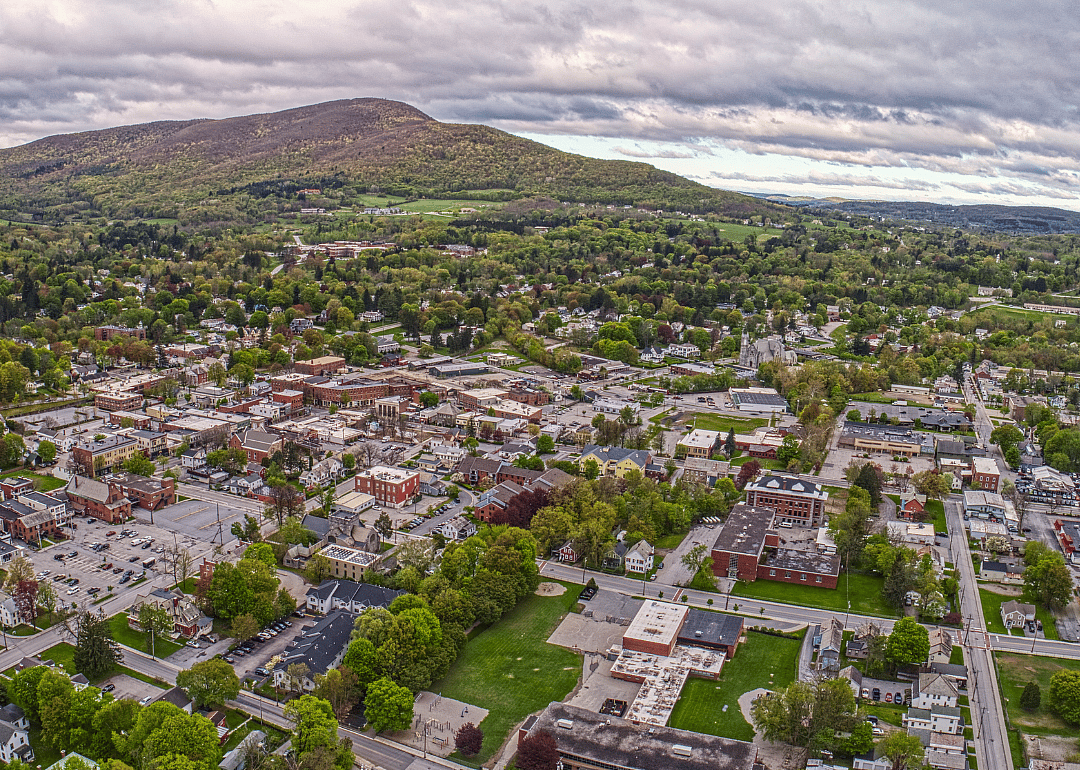
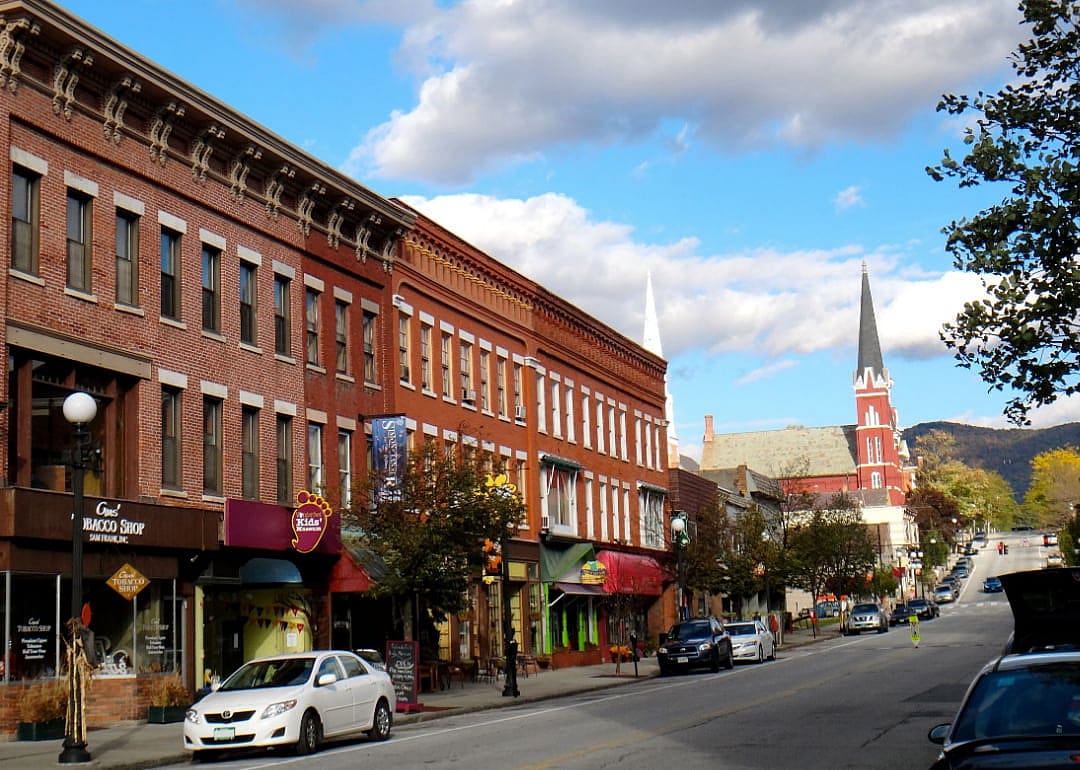
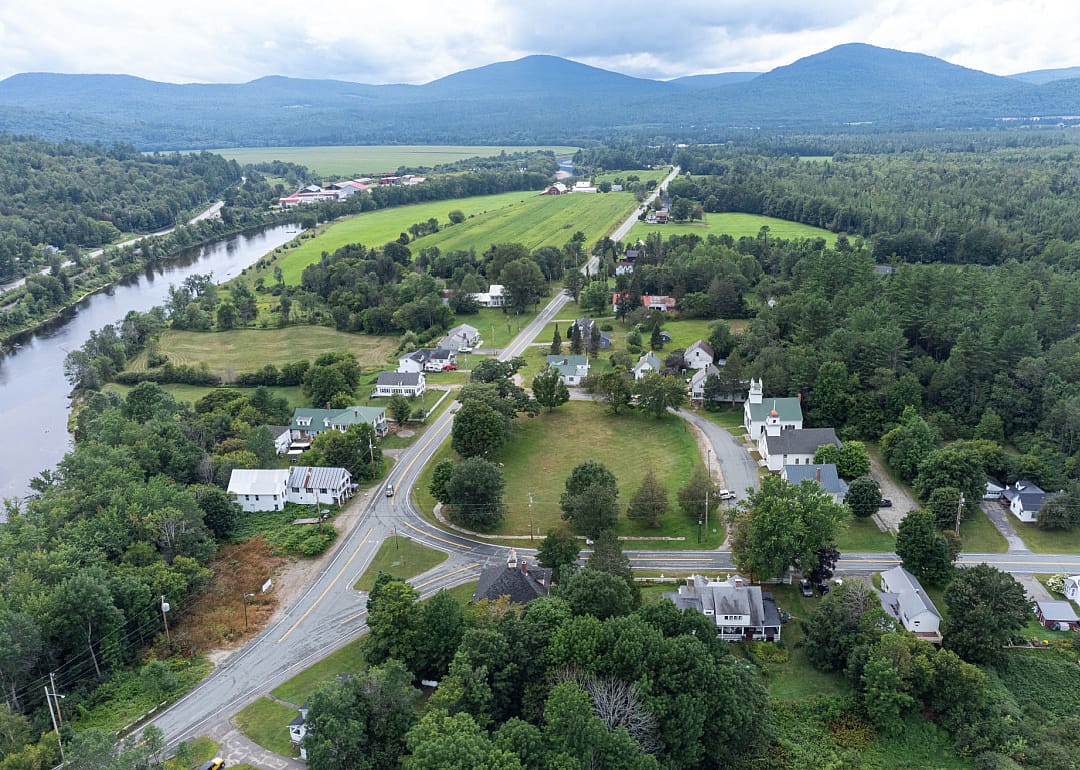
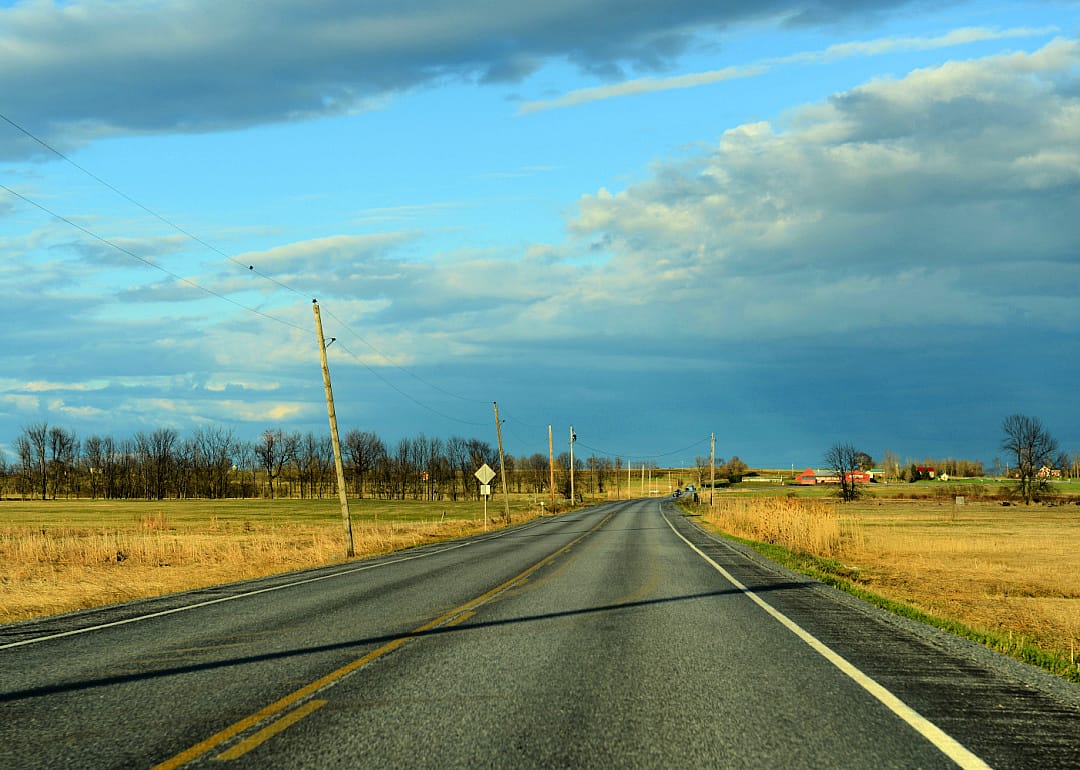
Several factors contribute to cancer rates, from personal habits and genetics to air pollution or groundwater quality in a given area. People experiencing social, economic, or environmental disadvantages are disproportionately affected by high cancer rates in certain regions—including access or barriers to early screening and care.

Cancer rates also fluctuate by jobs: Higher rates of cancer can be found among meat industry and rubber manufacturing workers, and farmers.

Stacker compiled the counties with the highest cancer rates in Vermont using data from the CDC. Keep reading to see where in your state cancer cases are the most common.

You may also like: See the most extreme temperatures in Vermont history

#14. Chittenden County

Erika J Mitchell // Shutterstock

1 / 14

#14. Chittenden County

- Cancer rate per 100,000, 2016-2020: 509.7
- Age-adjusted rate per 100,000, 2016-2020: 439.9
#13. Lamoille County

Joseph Sohm // Shutterstock

2 / 14

#13. Lamoille County

- Cancer rate per 100,000, 2016-2020: 576.1
- Age-adjusted rate per 100,000, 2016-2020: 440.5
#12. Franklin County

Hank Shiffman // Shutterstock

3 / 14

#12. Franklin County

- Cancer rate per 100,000, 2016-2020: 577.6
- Age-adjusted rate per 100,000, 2016-2020: 460.5
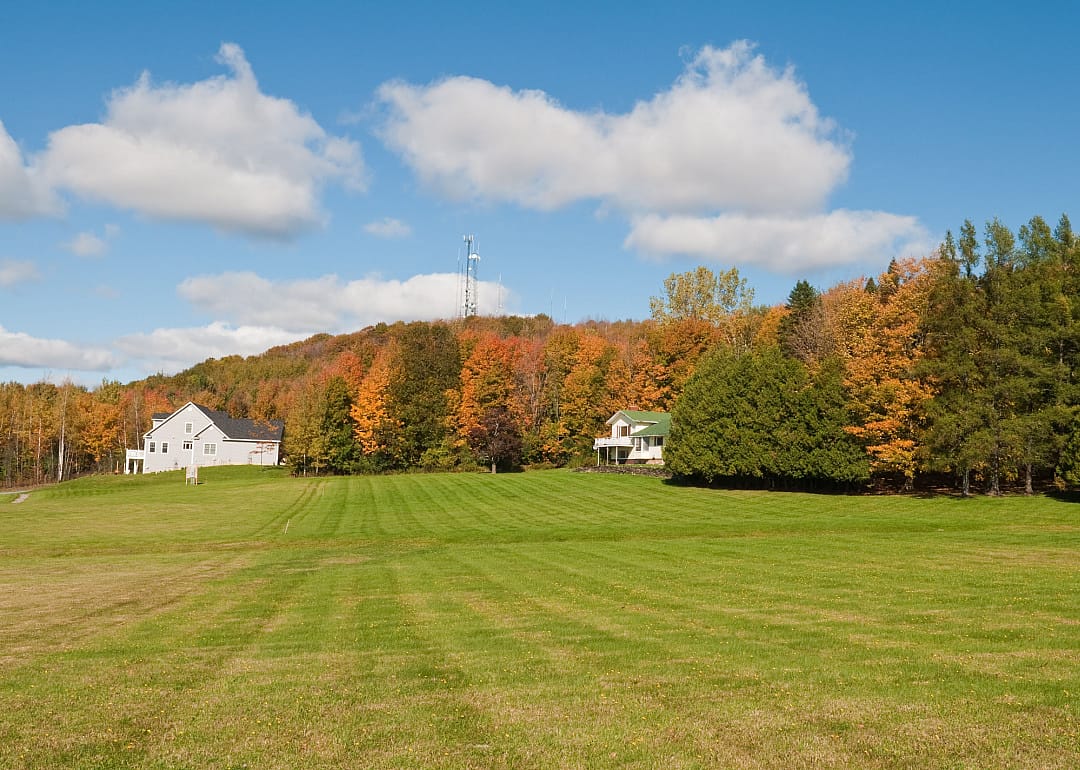
#11. Addison County

Canva

4 / 14

#11. Addison County

- Cancer rate per 100,000, 2016-2020: 603.0
- Age-adjusted rate per 100,000, 2016-2020: 427.8
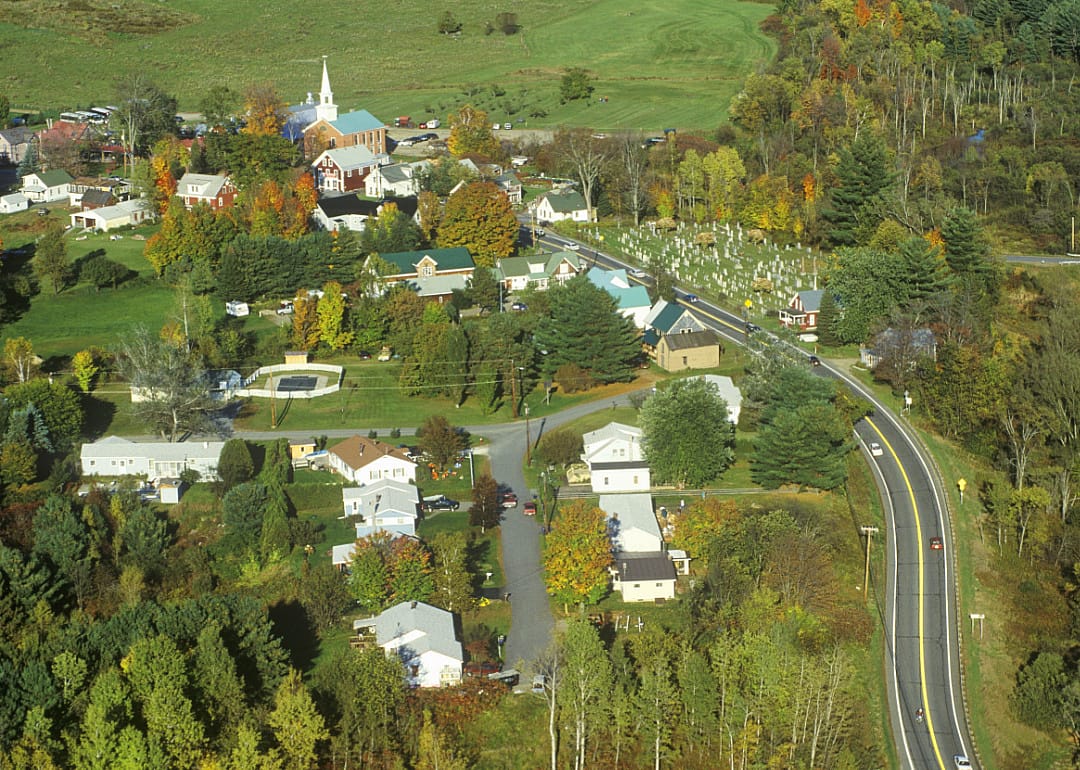
#9. Caledonia County

Canva

6 / 14

#9. Caledonia County

- Cancer rate per 100,000, 2016-2020: 654.1
- Age-adjusted rate per 100,000, 2016-2020: 451.3
#8. Orange County

Mike Hardiman // Shutterstock

7 / 14

#8. Orange County

- Cancer rate per 100,000, 2016-2020: 683.7
- Age-adjusted rate per 100,000, 2016-2020: 453.5
#7. Orleans County

NEKVT // Shutterstock

8 / 14

#7. Orleans County

- Cancer rate per 100,000, 2016-2020: 690.6
- Age-adjusted rate per 100,000, 2016-2020: 455.1
#6. Windham County

Mike Hardiman // Shutterstock

9 / 14

#6. Windham County

- Cancer rate per 100,000, 2016-2020: 708.5
- Age-adjusted rate per 100,000, 2016-2020: 465.3
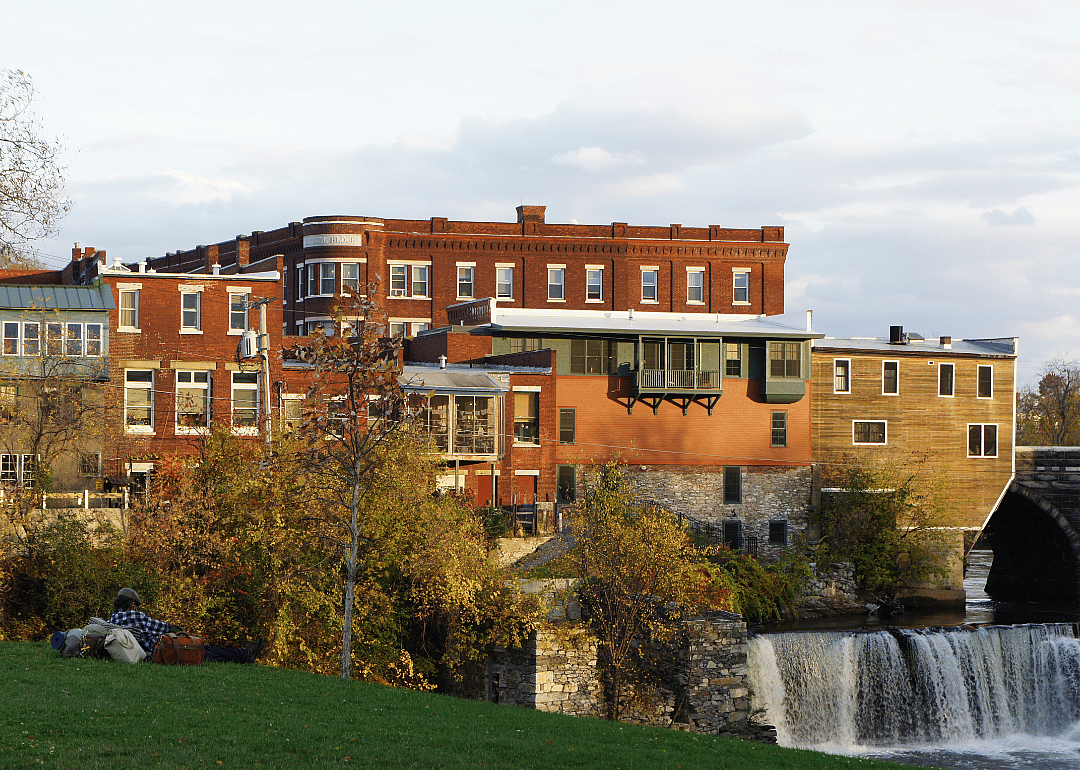
#5. Bennington County

Canva

10 / 14

#5. Bennington County

- Cancer rate per 100,000, 2016-2020: 720.4
- Age-adjusted rate per 100,000, 2016-2020: 461.0

You may also like: Highest-rated IPAs in Vermont
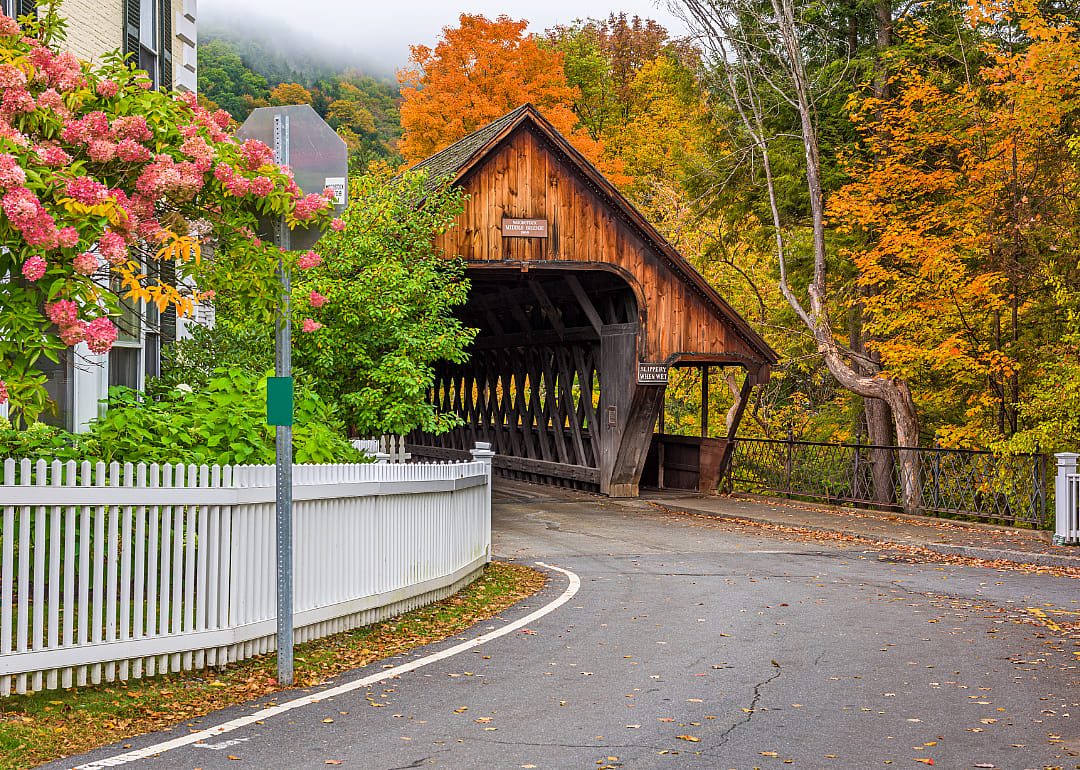
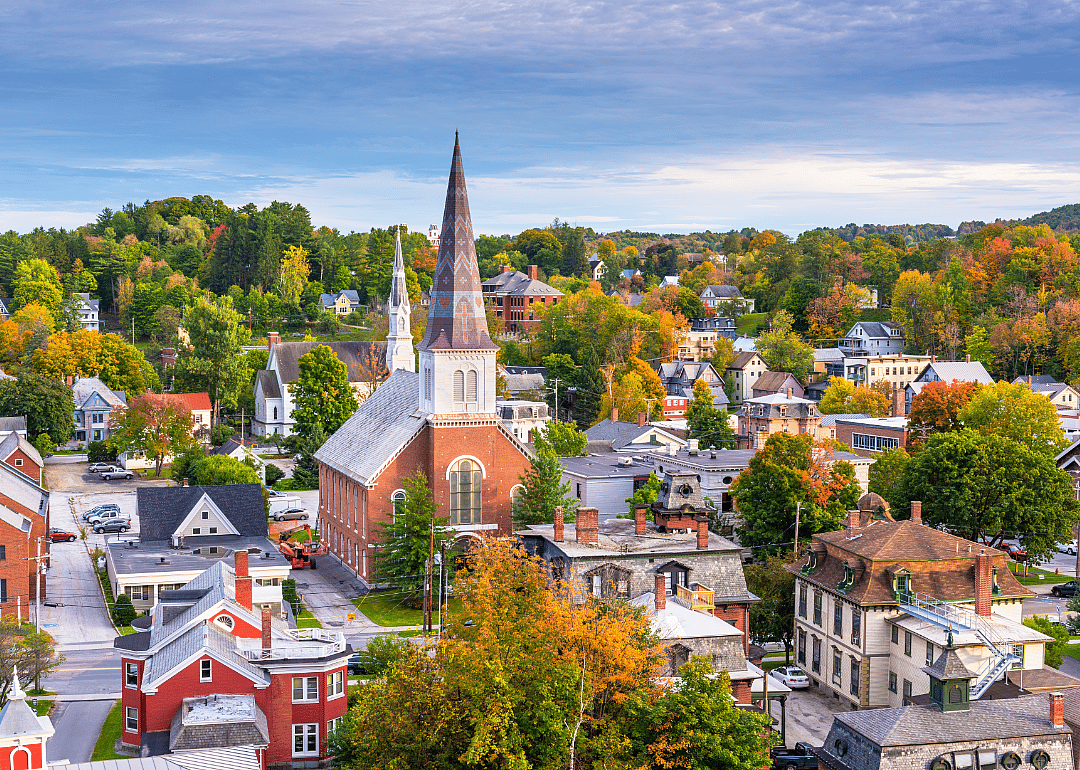
#4. Windsor County

Canva

11 / 14

#4. Windsor County

- Cancer rate per 100,000, 2016-2020: 733.4
- Age-adjusted rate per 100,000, 2016-2020: 470.0
#3. Rutland County

quiggyt4 // Shutterstock

12 / 14

#3. Rutland County

- Cancer rate per 100,000, 2016-2020: 747.7
- Age-adjusted rate per 100,000, 2016-2020: 482.2
#2. Essex County

Canva

13 / 14

#2. Essex County

- Cancer rate per 100,000, 2016-2020: 777.1
- Age-adjusted rate per 100,000, 2016-2020: 442.4
#1. Grand Isle County

Wangkun Jia // Shutterstock

14 / 14

#1. Grand Isle County

- Cancer rate per 100,000, 2016-2020: 788.7
- Age-adjusted rate per 100,000, 2016-2020: 532.1