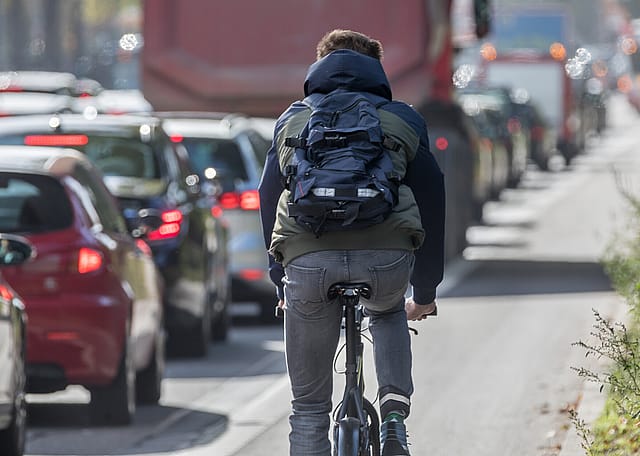
Stacker compiled a list of the counties with the best commutes in Virginia using data from the U.S. Census Bureau. Counties are ranked by the shortest average travel time to work, with ties broken by lowest percent of residents that commute over 60 minutes, and any further ties broken by lowest percent of residents that work outside the county of residence.
You may also like: Countries to which Virginia exports the most goods
Idawriter // Wikimedia Commons
1 / 50#50. Pittsylvania County
- Mean travel time to work: 25.2
- Workers with 60+ minute commute: 6.1%
- Worked outside of county of residence: 54.2%
Brian Stansberry // Wikimedia Commons
2 / 50#49. Tazewell County
- Mean travel time to work: 25.1
- Workers with 60+ minute commute: 9.4%
- Worked outside of county of residence: 14.9%
Famartin // Wikimedia Commons
3 / 50#48. Augusta County
- Mean travel time to work: 25.0
- Workers with 60+ minute commute: 4.4%
- Worked outside of county of residence: 49.4%
Cnjnva // Wikimedia Commons
4 / 50#47. Mecklenburg County
- Mean travel time to work: 24.9
- Workers with 60+ minute commute: 8.6%
- Worked outside of county of residence: 16.3%
Rutke421 // Wikimedia Commons
5 / 50Skye Marthaler // Wikimedia Commons
6 / 50#45. Pulaski County
- Mean travel time to work: 24.7
- Workers with 60+ minute commute: 7.9%
- Worked outside of county of residence: 41.6%
vastateparksstaff // Wikimedia Commons
7 / 50#44. Halifax County
- Mean travel time to work: 24.6
- Workers with 60+ minute commute: 8.0%
- Worked outside of county of residence: 18.3%
Nyttend // Wikimedia Commons
8 / 50#43. Henry County
- Mean travel time to work: 24.6
- Workers with 60+ minute commute: 6.6%
- Worked outside of county of residence: 33.0%
Alexiskferia // Wikimedia Commons
9 / 50#42. Northampton County
- Mean travel time to work: 24.3
- Workers with 60+ minute commute: 7.5%
- Worked outside of county of residence: 22.3%
Nyttend // Wikimedia Commons
10 / 50Jarek Tuszyński // Wikimedia Commons
11 / 50#40. Alleghany County
- Mean travel time to work: 24.1
- Workers with 60+ minute commute: 9.0%
- Worked outside of county of residence: 43.0%
Skye Marthaler // Wikimedia Commons
12 / 50#39. Wythe County
- Mean travel time to work: 24.0
- Workers with 60+ minute commute: 6.2%
- Worked outside of county of residence: 28.3%
Mojo Hand // Wikimedia Commons
13 / 50#38. York County
- Mean travel time to work: 24.0
- Workers with 60+ minute commute: 4.7%
- Worked outside of county of residence: 68.3%
jpmueller99 // Wikimedia Commons
14 / 50#37. Campbell County
- Mean travel time to work: 24.0
- Workers with 60+ minute commute: 4.2%
- Worked outside of county of residence: 58.6%
Petra holden // Wikimedia Commons
15 / 50gargola87 // Wikimedia Commons
16 / 50#35. Virginia Beach city
- Mean travel time to work: 23.5
- Workers with 60+ minute commute: 3.8%
- Worked outside of county of residence: 32.7%
Nyttend // Wikimedia Commons
17 / 50#34. Bath County
- Mean travel time to work: 23.3
- Workers with 60+ minute commute: 10.6%
- Worked outside of county of residence: 18.6%
Taber Andrew Bain // Wikimedia Commons
18 / 50#33. Greensville County
- Mean travel time to work: 23.1
- Workers with 60+ minute commute: 5.9%
- Worked outside of county of residence: 48.1%
APK // Wikimedia Commons
19 / 50#32. Winchester city
- Mean travel time to work: 23.0
- Workers with 60+ minute commute: 11.7%
- Worked outside of county of residence: 43.4%
U.S. Navy photo // Wikimedia Commons
20 / 50Jerrye & Roy Klotz, MD // Wikimedia Commons
21 / 50#30. Roanoke County
- Mean travel time to work: 22.8
- Workers with 60+ minute commute: 3.6%
- Worked outside of county of residence: 61.5%
Cyoung9 // Wikimedia Commons
22 / 50#29. Galax city
- Mean travel time to work: 22.5
- Workers with 60+ minute commute: 10.0%
- Worked outside of county of residence: 29.2%
Rifleman 82 // Wikimedia Commons
23 / 50#28. Henrico County
- Mean travel time to work: 22.5
- Workers with 60+ minute commute: 3.9%
- Worked outside of county of residence: 40.2%
Lvklock // Wikimedia Commons
24 / 50#27. Waynesboro city
- Mean travel time to work: 22.5
- Workers with 60+ minute commute: 2.8%
- Worked outside of county of residence: 61.2%
JERRYE & ROY KLOTZ MD // Wikimedia Commons
25 / 50#26. Smyth County
- Mean travel time to work: 22.4
- Workers with 60+ minute commute: 5.9%
- Worked outside of county of residence: 27.8%
You may also like: Best colleges in Virginia
JERRYE & ROY KLOTZ MD // Wikimedia Commons
26 / 50#25. Hampton city
- Mean travel time to work: 22.3
- Workers with 60+ minute commute: 4.8%
- Worked outside of county of residence: 50.7%
Skye Marthaler // Wikimedia Commons
27 / 50#24. Wise County
- Mean travel time to work: 22.2
- Workers with 60+ minute commute: 7.2%
- Worked outside of county of residence: 19.4%
Nyttend // Wikimedia Commons
28 / 50#23. Staunton city
- Mean travel time to work: 22.2
- Workers with 60+ minute commute: 4.4%
- Worked outside of county of residence: 52.6%
Acroterion // Wikimedia Commons
29 / 50#22. Accomack County
- Mean travel time to work: 22.1
- Workers with 60+ minute commute: 4.2%
- Worked outside of county of residence: 9.2%
Famartin // Wikimedia Commons
30 / 50Mark Lagola and Ben Lunsford // Wikimedia Commons
31 / 50#20. Albemarle County
- Mean travel time to work: 21.9
- Workers with 60+ minute commute: 3.7%
- Worked outside of county of residence: 39.6%
Puritan Nerd // Wikimedia Commons
32 / 50#19. Prince Edward County
- Mean travel time to work: 21.8
- Workers with 60+ minute commute: 8.0%
- Worked outside of county of residence: 35.2%
Ewelch1 // Wikimedia Commons
33 / 50#18. Norfolk city
- Mean travel time to work: 21.8
- Workers with 60+ minute commute: 4.2%
- Worked outside of county of residence: 31.9%
Will Weaver // Wikicommons
34 / 50#17. Richmond city
- Mean travel time to work: 21.7
- Workers with 60+ minute commute: 4.3%
- Worked outside of county of residence: 40.7%
Nolanwebb // Wikimedia Commons
35 / 50#16. Roanoke city
- Mean travel time to work: 21.3
- Workers with 60+ minute commute: 3.5%
- Worked outside of county of residence: 38.9%
You may also like: Best private colleges in Virginia
Sleddog116 // Wikimedia Commons
36 / 50#15. Martinsville city
- Mean travel time to work: 20.1
- Workers with 60+ minute commute: 5.6%
- Worked outside of county of residence: 49.2%
Mojo Hand // Wikimedia Commons
37 / 50#14. Salem city
- Mean travel time to work: 19.4
- Workers with 60+ minute commute: 2.8%
- Worked outside of county of residence: 48.2%
Acroterion // Wikimedia Commons
38 / 50#13. Danville city
- Mean travel time to work: 19.0
- Workers with 60+ minute commute: 5.6%
- Worked outside of county of residence: 18.8%
SKM2000 // Wikimedia Commons
39 / 50#12. Williamsburg city
- Mean travel time to work: 18.7
- Workers with 60+ minute commute: 5.5%
- Worked outside of county of residence: 45.0%
Carol M. Highsmith // Wikimedia Commons
40 / 50Skye Marthaler // Wikimedia Commons
41 / 50#10. Radford city
- Mean travel time to work: 18.2
- Workers with 60+ minute commute: 1.6%
- Worked outside of county of residence: 54.6%
Skye Marthaler // Wikimedia Commons
42 / 50#9. Montgomery County
- Mean travel time to work: 18.1
- Workers with 60+ minute commute: 2.9%
- Worked outside of county of residence: 18.7%
Aplomado~commonswiki // Wikimedia Commons
43 / 50#8. Bristol city
- Mean travel time to work: 18.1
- Workers with 60+ minute commute: 2.5%
- Worked outside of county of residence: 22.6%
DanTD // Wikimedia Commons
44 / 50#7. Emporia city
- Mean travel time to work: 17.8
- Workers with 60+ minute commute: 3.3%
- Worked outside of county of residence: 45.9%
Moofpocket // Wikimedia Commons
45 / 50Acroterion // Wikimedia Commons
46 / 50#5. Lynchburg city
- Mean travel time to work: 17.0
- Workers with 60+ minute commute: 4.6%
- Worked outside of county of residence: 21.9%
Betcantrell // Wikimedia Commons
47 / 50#4. Norton city
- Mean travel time to work: 16.5
- Workers with 60+ minute commute: 6.4%
- Worked outside of county of residence: 58.5%
Alma mater // Wikimedia Commons
48 / 50#3. Harrisonburg city
- Mean travel time to work: 16.5
- Workers with 60+ minute commute: 3.6%
- Worked outside of county of residence: 34.4%
Smash the Iron Cage // Wikimedia Commons
49 / 50#2. Covington city
- Mean travel time to work: 16.0
- Workers with 60+ minute commute: 2.8%
- Worked outside of county of residence: 57.7%
Zeete // Wikimedia Commons
50 / 50