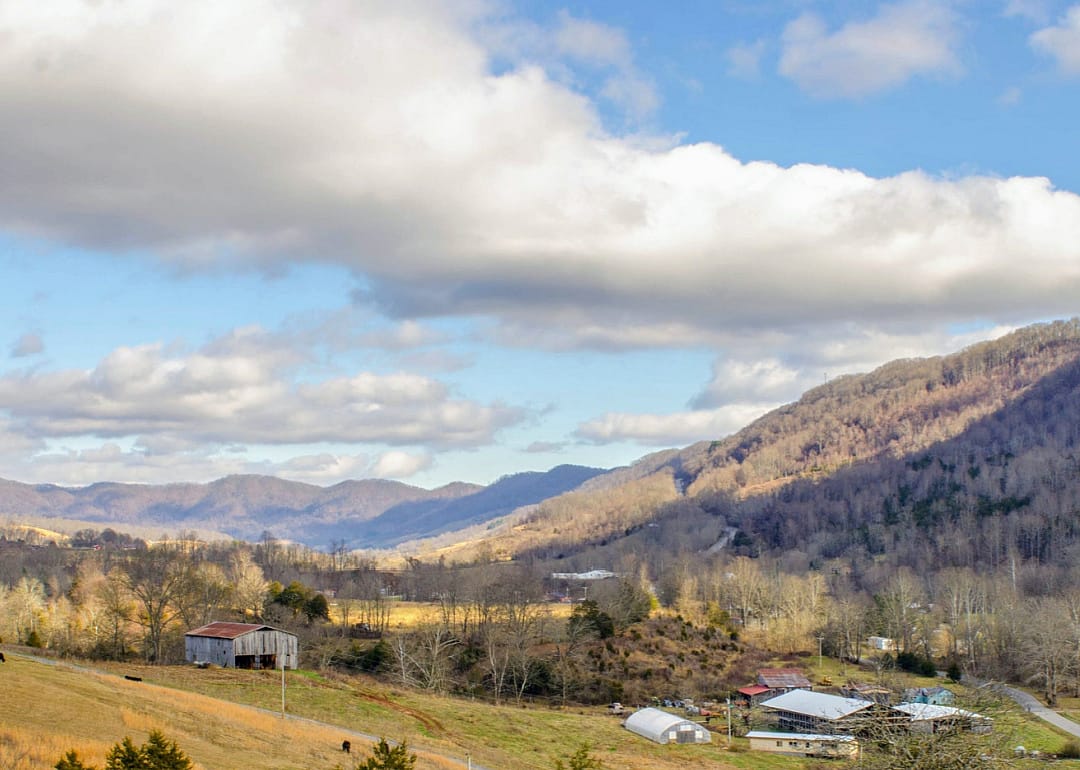
Jeffery L Willis // Shutterstock
1 / 20#20. Lee County
- Bridges in poor condition: 8.4% (13 of 154 bridges)
- Square meters of bridges in poor condition: 4.2% (2,170 of 51,110 square meters of bridges)

One in three U.S. bridges is in need of repair or replacement, according to data from the American Road & Transportation Builders Association, including 29% of interstate bridges. The cost to make these repairs is estimated to be in excess of $54 billion.
Stacker investigated which counties in Virginia have the most bridges in dire need of repair using data from the Federal Highway Administration. The data is accurate as of June 15, 2022. Counties are ranked by percent of bridges in "poor" condition and ties are broken by percent square meters of bridges in poor condition. Counties that have no bridges or have no bridges in poor condition are excluded from the list.
You may also like: Best NFL players born in Virginia
Jeffery L Willis // Shutterstock
1 / 20- Bridges in poor condition: 8.4% (13 of 154 bridges)
- Square meters of bridges in poor condition: 4.2% (2,170 of 51,110 square meters of bridges)
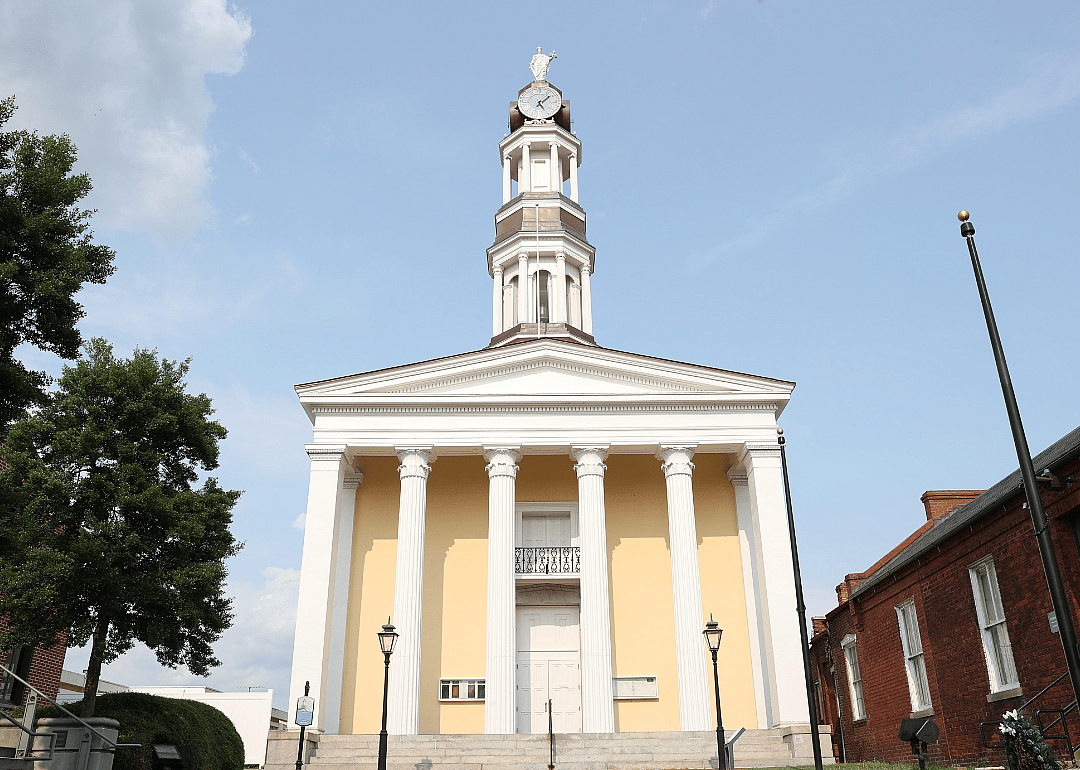
OJUP // Shutterstock
2 / 20- Bridges in poor condition: 8.5% (6 of 71 bridges)
- Square meters of bridges in poor condition: 3.1% (1,969 of 63,370 square meters of bridges)
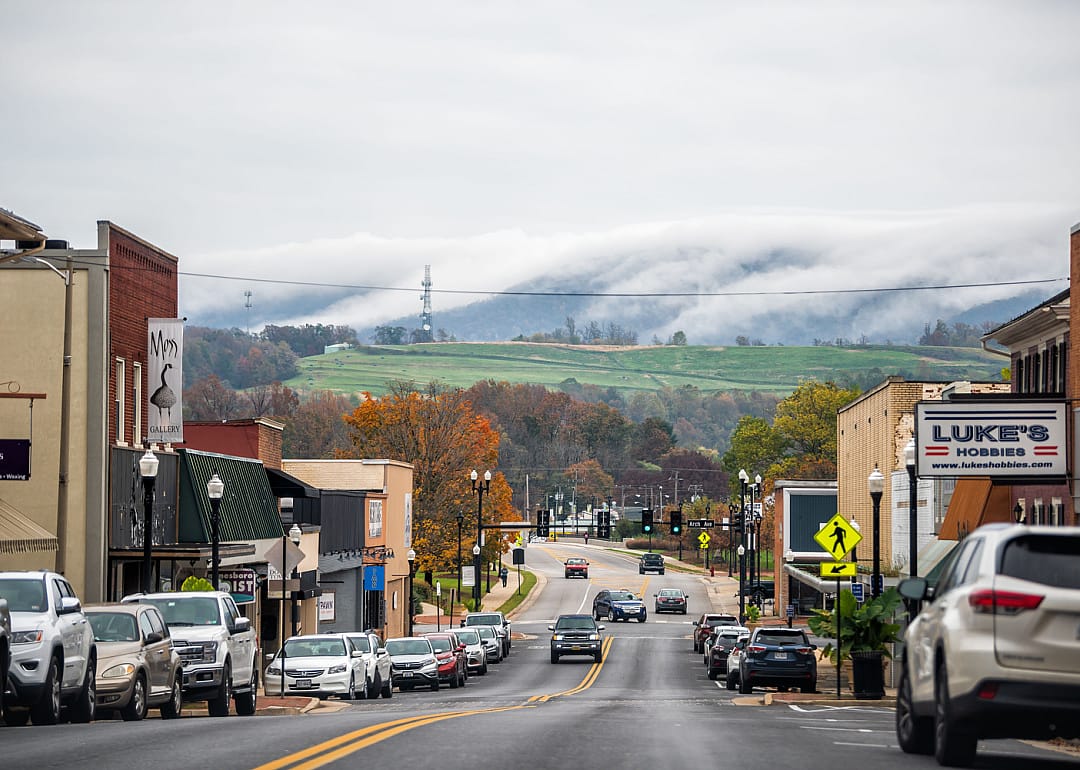
Kristi Blokhin // Shutterstock
3 / 20- Bridges in poor condition: 8.7% (2 of 23 bridges)
- Square meters of bridges in poor condition: 4.2% (705 of 16,911 square meters of bridges)

Canva
4 / 20- Bridges in poor condition: 9.0% (11 of 122 bridges)
- Square meters of bridges in poor condition: 4.6% (1,818 of 39,832 square meters of bridges)
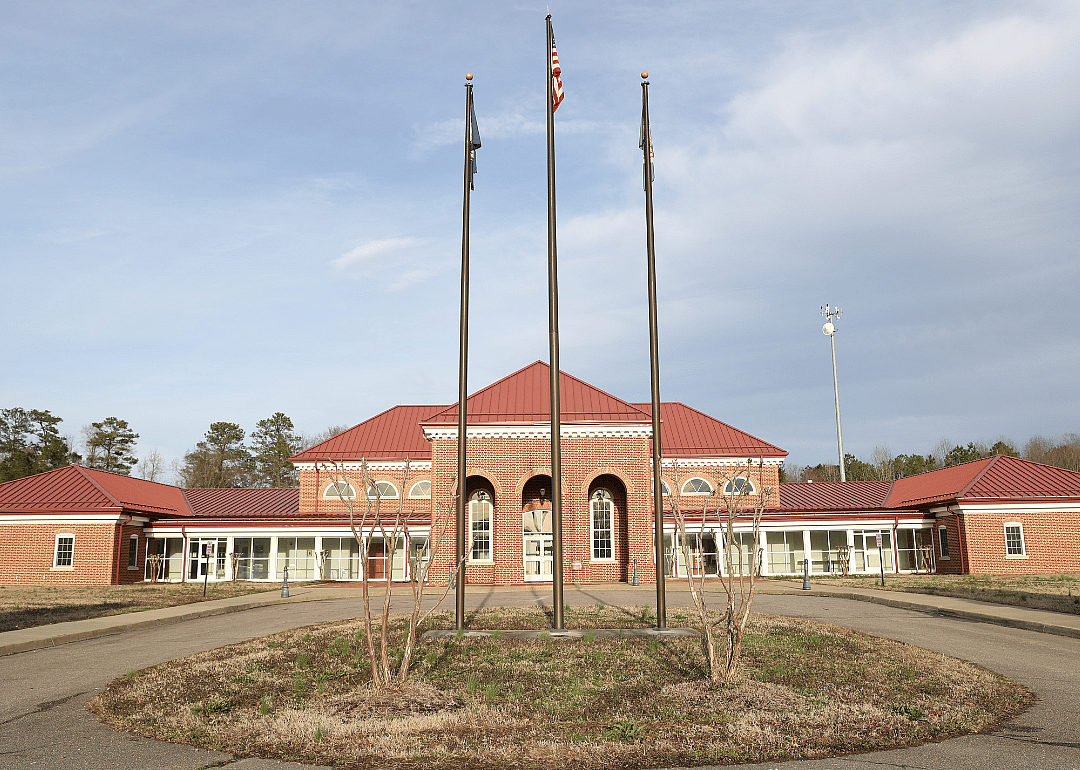
OJUP // Shutterstock
5 / 20- Bridges in poor condition: 9.1% (2 of 22 bridges)
- Square meters of bridges in poor condition: 0.8% (134 of 17,541 square meters of bridges)
You may also like: Most commonly seen birds in Virginia
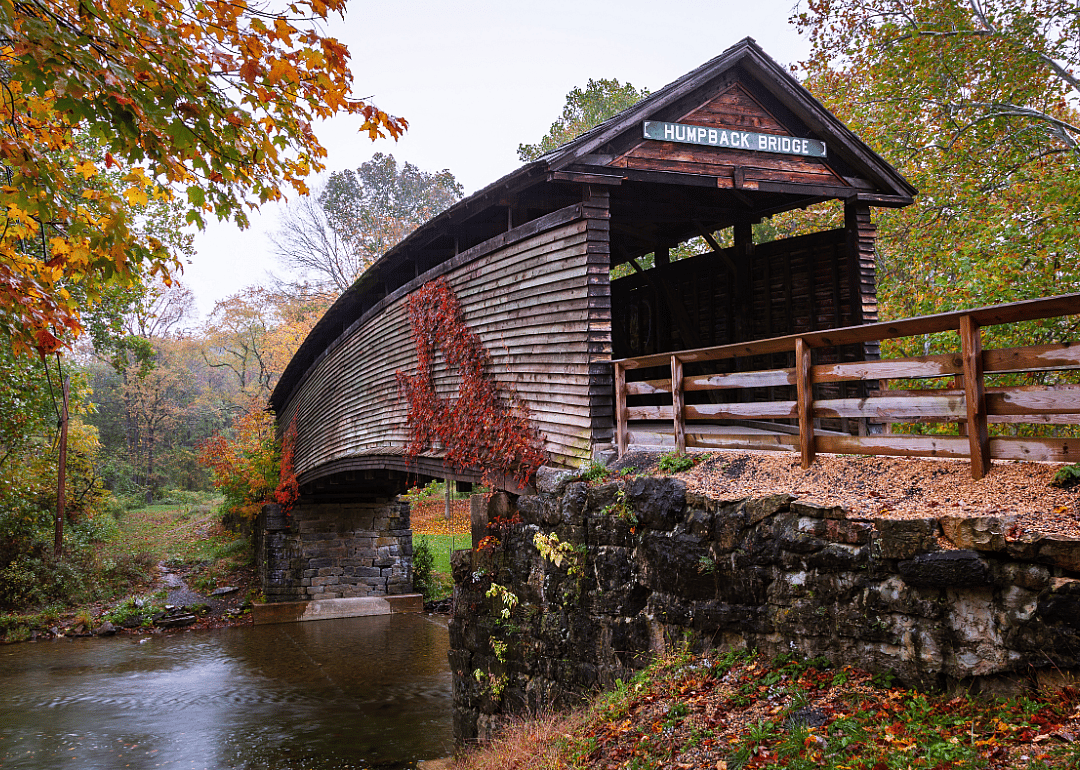
Canva
6 / 20- Bridges in poor condition: 9.1% (1 of 11 bridges)
- Square meters of bridges in poor condition: 5.3% (640 of 12,174 square meters of bridges)
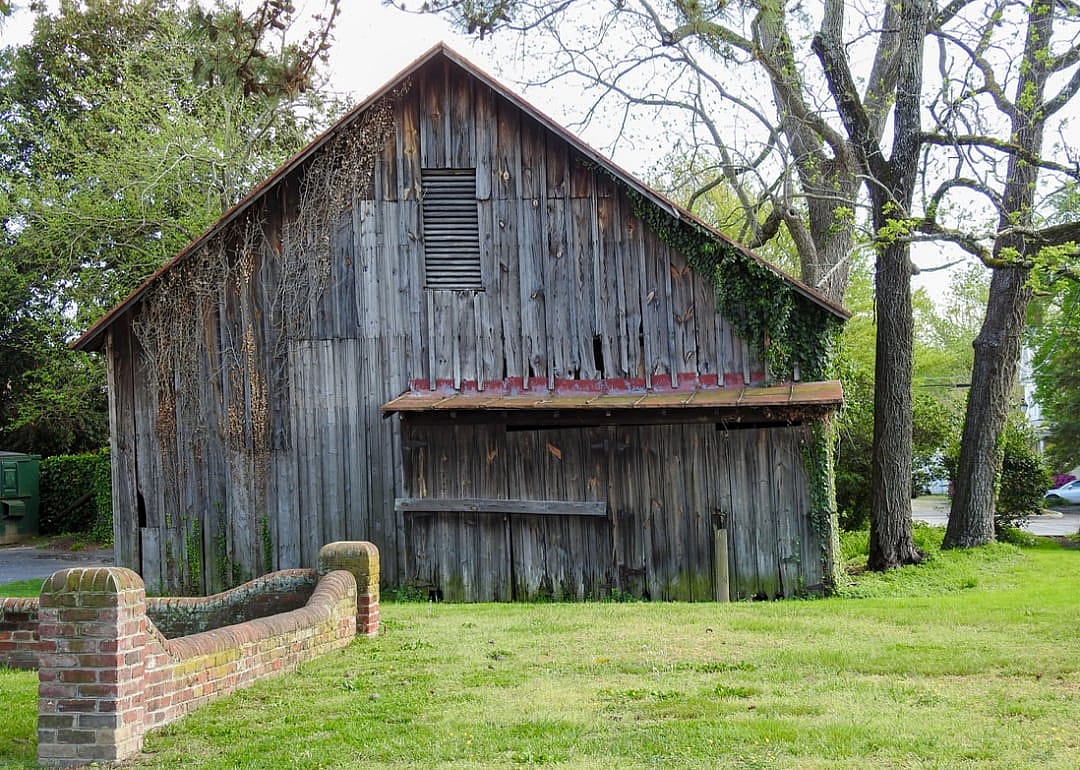
EchoFree // Shutterstock
7 / 20- Bridges in poor condition: 11.1% (1 of 9 bridges)
- Square meters of bridges in poor condition: 0.9% (261 of 28,998 square meters of bridges)
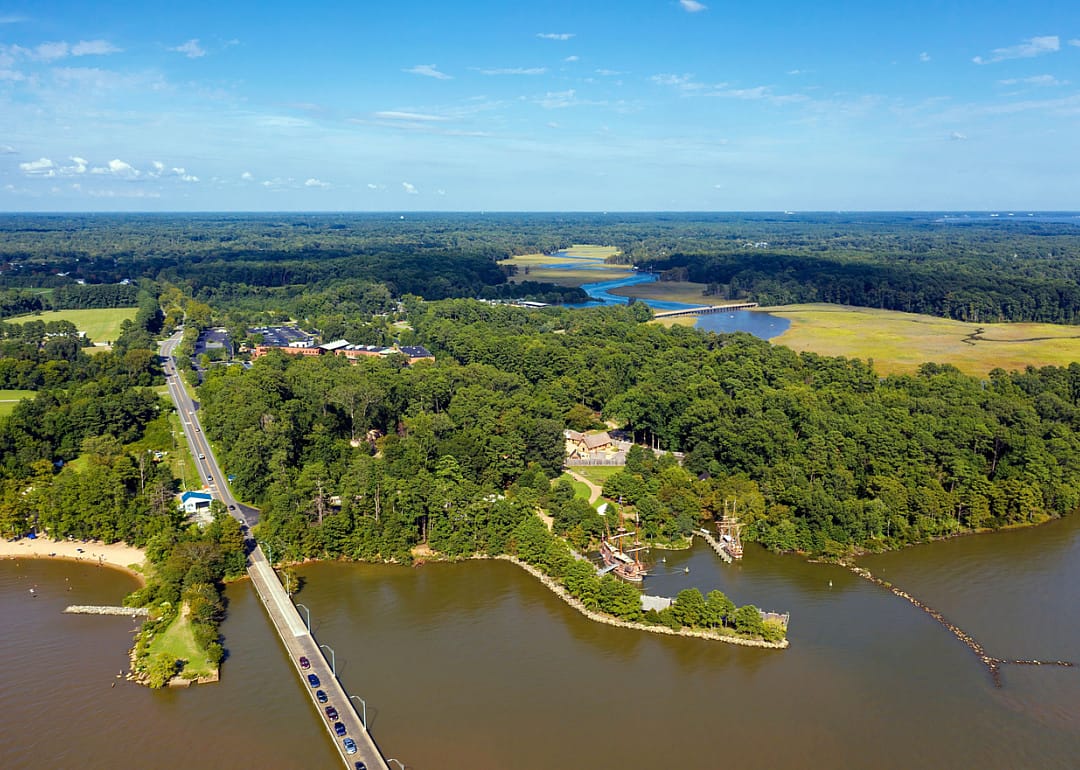
John Couture // Shutterstock
8 / 20- Bridges in poor condition: 11.1% (4 of 36 bridges)
- Square meters of bridges in poor condition: 2.7% (1,236 of 46,181 square meters of bridges)

Canva
9 / 20- Bridges in poor condition: 11.2% (10 of 89 bridges)
- Square meters of bridges in poor condition: 4.7% (836 of 17,694 square meters of bridges)

Erin Cadigan // Shutterstock
10 / 20- Bridges in poor condition: 11.4% (21 of 184 bridges)
- Square meters of bridges in poor condition: 6.7% (24,756 of 371,453 square meters of bridges)
You may also like: Coldest Januarys in Virginia since 1895
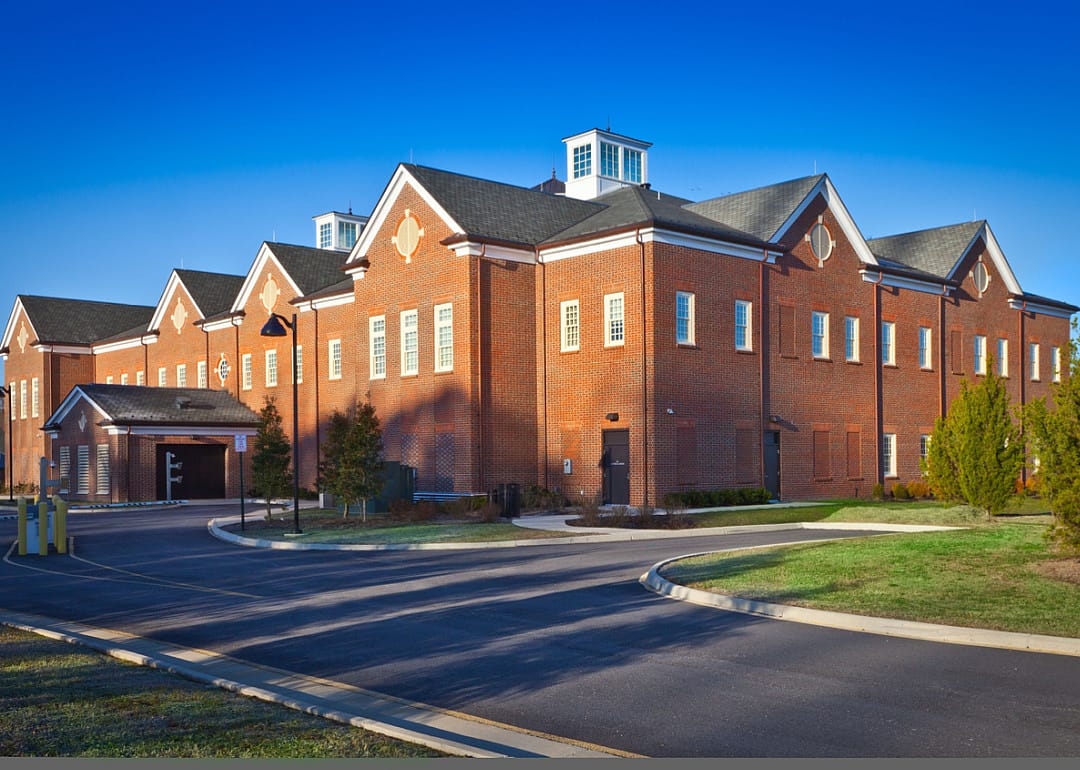
Melinda Fawver // Shutterstock
11 / 20- Bridges in poor condition: 11.5% (10 of 87 bridges)
- Square meters of bridges in poor condition: 4.0% (7,913 of 197,253 square meters of bridges)
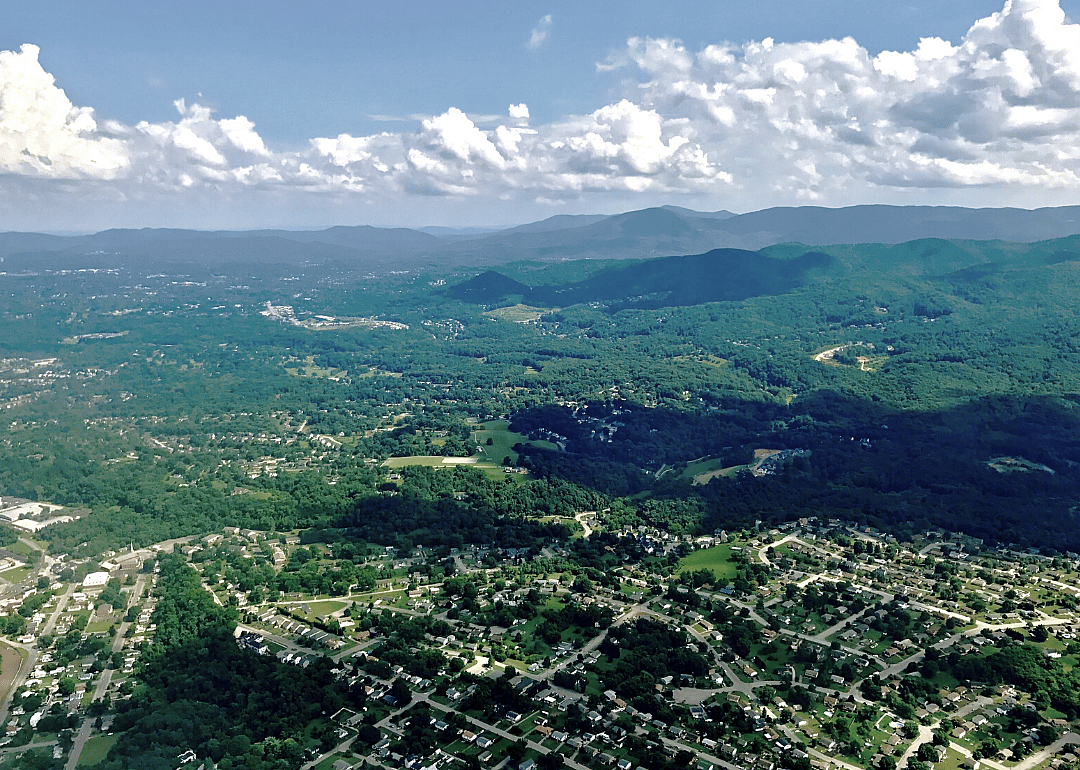
Canva
12 / 20- Bridges in poor condition: 11.8% (2 of 17 bridges)
- Square meters of bridges in poor condition: 14.2% (1,913 of 13,482 square meters of bridges)

Nolichuckyjake // Shutterstock
13 / 20- Bridges in poor condition: 11.8% (6 of 51 bridges)
- Square meters of bridges in poor condition: 19.1% (7,313 of 38,239 square meters of bridges)

Chankhamp // Shutterstock
14 / 20- Bridges in poor condition: 12.0% (3 of 25 bridges)
- Square meters of bridges in poor condition: 10.3% (1,936 of 18,834 square meters of bridges)
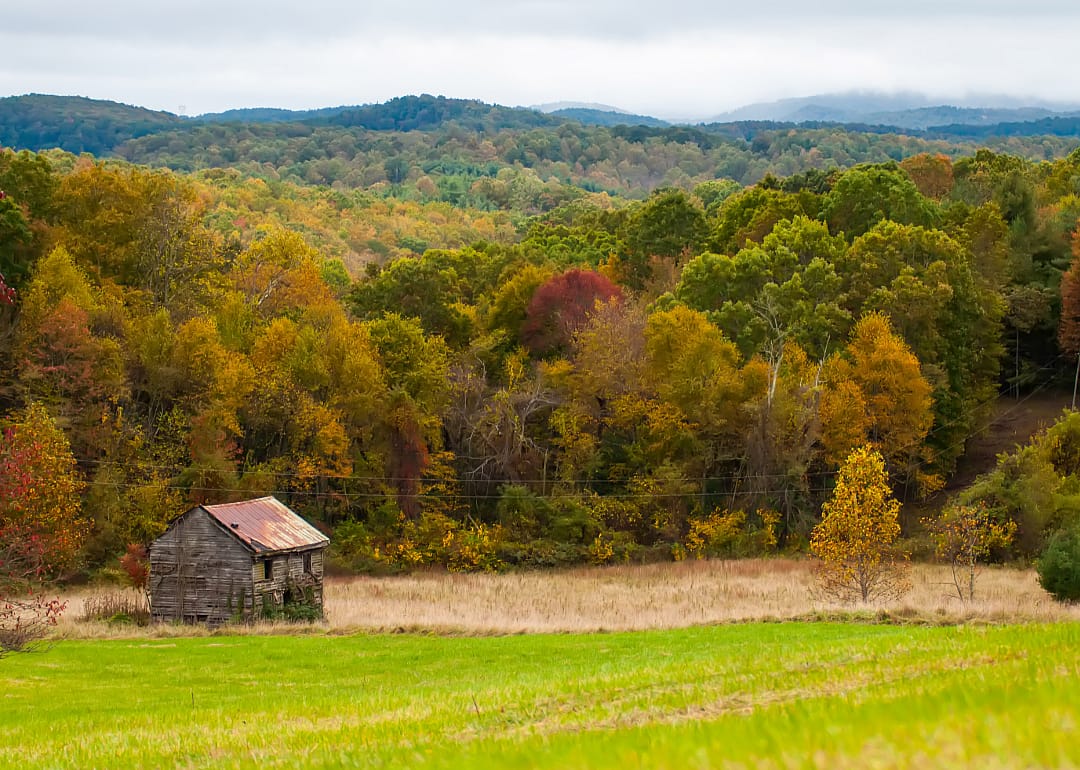
Canva
15 / 20- Bridges in poor condition: 12.5% (1 of 8 bridges)
- Square meters of bridges in poor condition: 2.9% (55 of 1,885 square meters of bridges)
You may also like: Highest-earning counties in Virginia
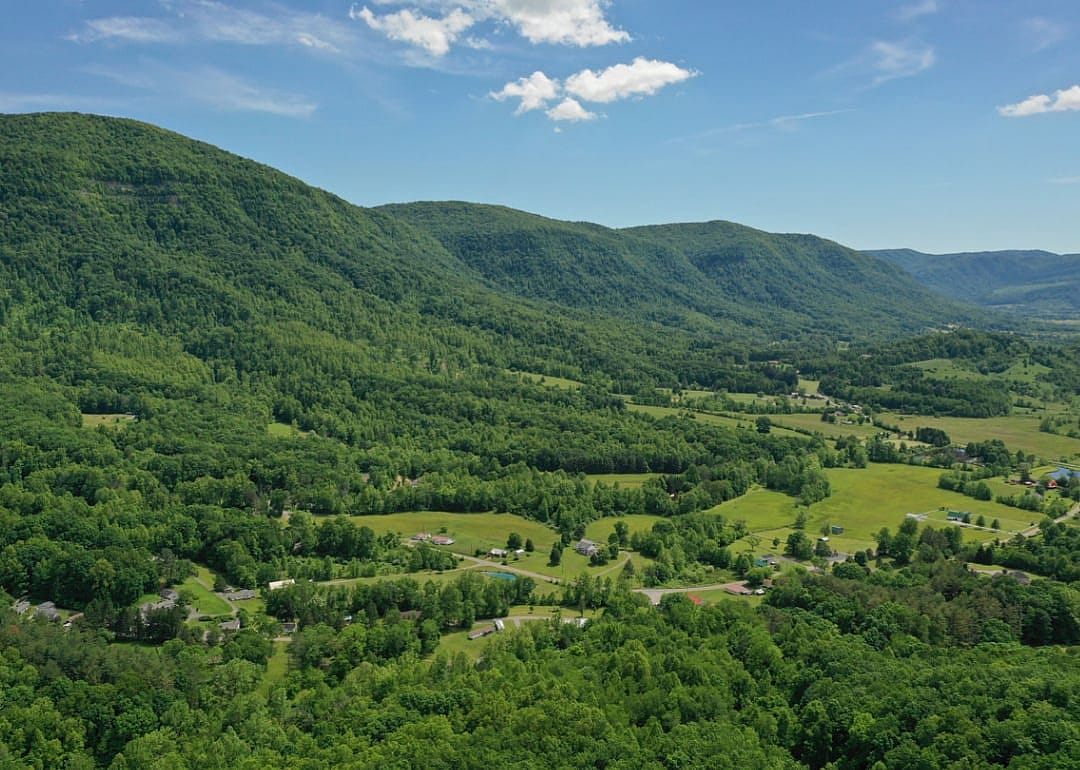
Mfinity SAM // Shutterstock
16 / 20- Bridges in poor condition: 15.0% (3 of 20 bridges)
- Square meters of bridges in poor condition: 19.4% (4,147 of 21,414 square meters of bridges)
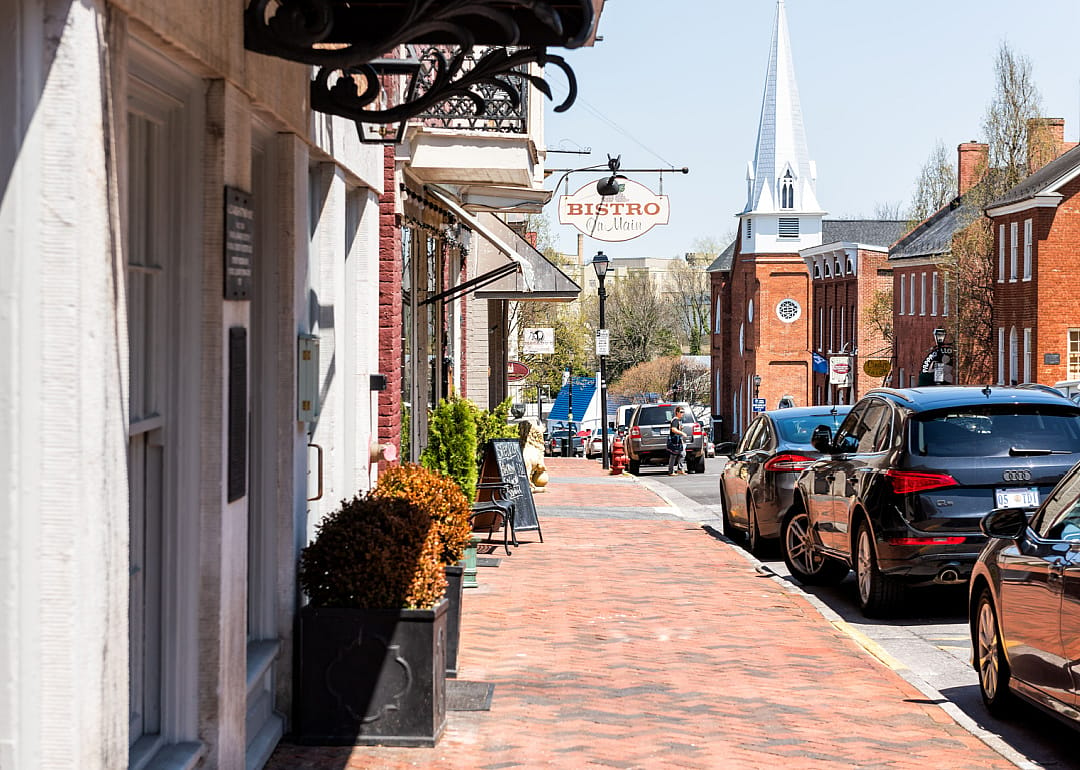
Kristi Blokhin // Shutterstock
17 / 20- Bridges in poor condition: 22.2% (2 of 9 bridges)
- Square meters of bridges in poor condition: 16.4% (416 of 2,536 square meters of bridges)
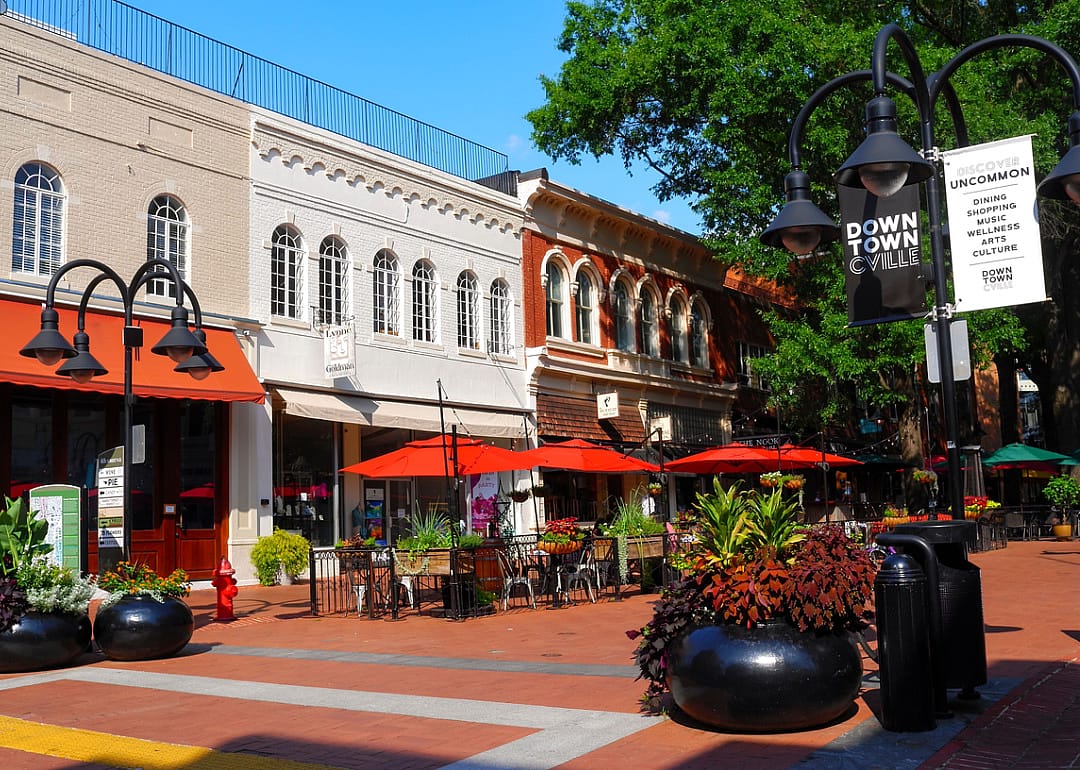
ImagineerInc // Shutterstock
18 / 20- Bridges in poor condition: 26.9% (7 of 26 bridges)
- Square meters of bridges in poor condition: 56.3% (8,564 of 15,211 square meters of bridges)
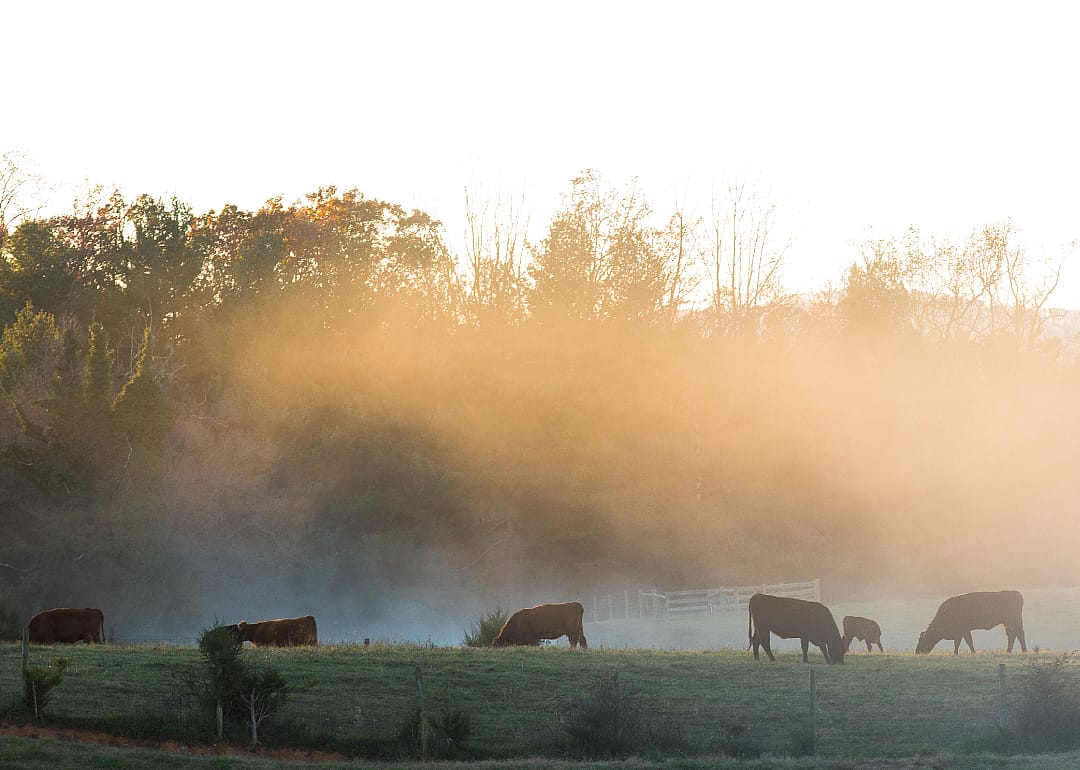
Canva
19 / 20- Bridges in poor condition: 33.3% (2 of 6 bridges)
- Square meters of bridges in poor condition: 6.2% (505 of 8,200 square meters of bridges)

Canva
20 / 20- Bridges in poor condition: 40.0% (2 of 5 bridges)
- Square meters of bridges in poor condition: 13.8% (228 of 1,652 square meters of bridges)
You may also like: Most popular diamond shapes in Virginia



