During the past winter, parts of California experienced massive amounts of rain and snow. Though it momentarily eased the frequent drought periods that had been affecting the state, the surge in rainfall flooded roads, knocked out power, and broke levees. Fueled by multiple converging atmospheric rivers, the state's infrastructure was not able to capture all of the excess water, meaning water shortages could again return during future dry spells.
Climate change can both intensify rainfall and also extend droughts. Warmer temperatures increase rates of evaporation, pulling more water from the ocean and causing more precipitation overall. Data indicates single-day precipitation extremes are happening more frequently. Conversely, more evaporation also dries out surface water and soil, leaving less fresh water available. Even as the moist air from oceans and other sources returns to land as rain, sleet, or snow, inconsistent wind patterns and currents mean it isn't distributed evenly. That's why even as some counties experienced their wettest year on record, others experienced their driest.
Nationwide, 43% of counties reported precipitation over the past year greater than their long-term average. A 1,000-year event dumped 25 inches of rainfall over 24 hours in Fort Lauderdale on April 13. Nevada desert regions experienced thunderstorms and heavy rain in June. Severe weather through the mid-Atlantic in August brought tennis ball-sized hail to West Virginia and softball-sized hail and flash flooding in Maryland.
Using data from the National Centers for Environmental Information, Stacker identified counties in Virginia that received the most precipitation from September 2022 to August 2023 compared to their average annual precipitation from 1901 to 2000. In the case of a tie, the amount of precipitation over the past year served as a tiebreaker.
Read on to see which counties reported more precipitation over the past year than usual.
You may also like: Highest-rated Class of 2026 men's basketball recruits from Virginia
#50. Halifax County
- Precipitation over the past year: 43.1 inches
- Comparison to 1901-2000 average: 0.1 inches above average (#67 rainiest September-August period since 1895)
- Comparison to state's precipitation over past year: 1.3 inches above statewide average
Wileydoc // Shutterstock
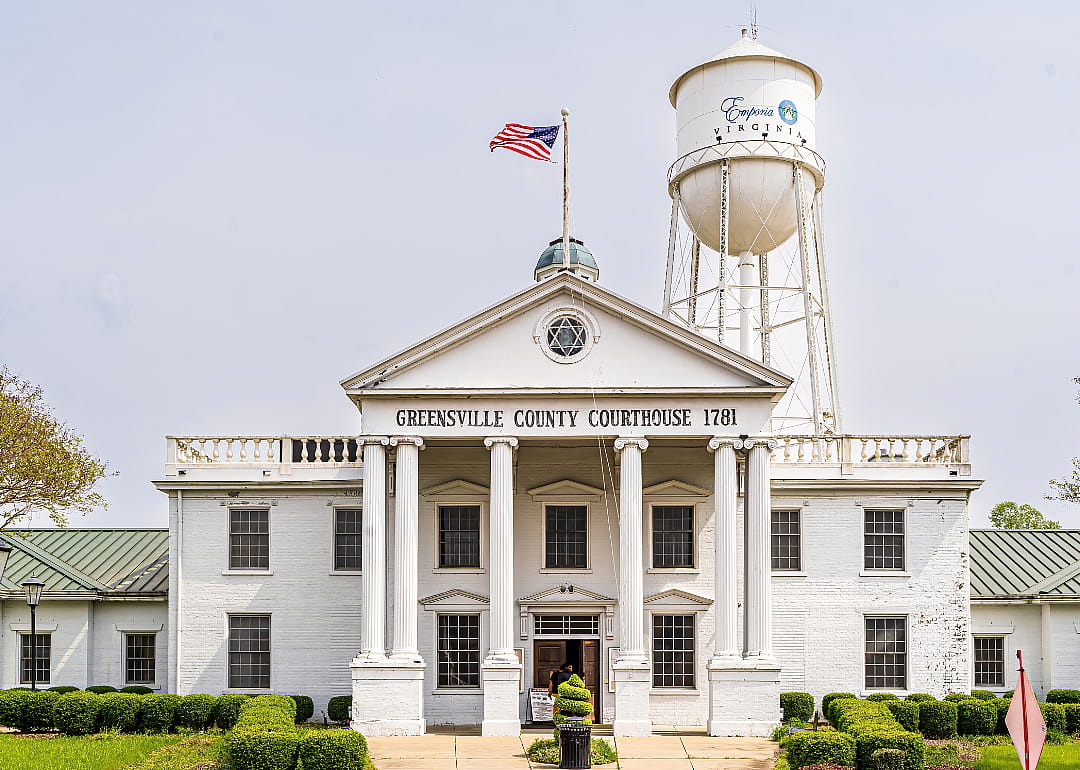
2 / 50#49. Greensville County
- Precipitation over the past year: 45.0 inches
- Comparison to 1901-2000 average: 0.2 inches above average (#57 rainiest September-August period since 1895)
- Comparison to state's precipitation over past year: 3.1 inches above statewide average
Nolichuckyjake // Shutterstock
3 / 50#48. Bristol
- Precipitation over the past year: 44.8 inches
- Comparison to 1901-2000 average: 0.2 inches above average (#64 rainiest September-August period since 1895)
- Comparison to state's precipitation over past year: 2.9 inches above statewide average
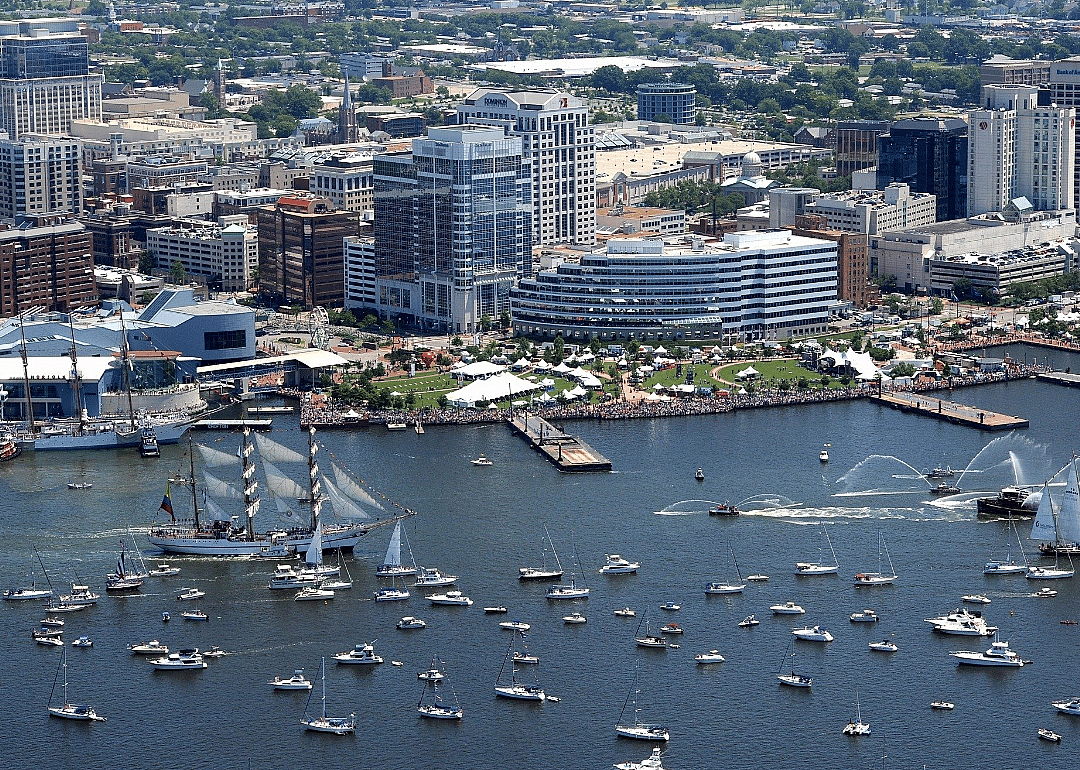
#47. Norfolk
- Precipitation over the past year: 45.3 inches
- Comparison to 1901-2000 average: 0.3 inches above average (#64 rainiest September-August period since 1895)
- Comparison to state's precipitation over past year: 3.5 inches above statewide average
Timothy L Barnes // Shutterstock
5 / 50#46. Surry County
- Precipitation over the past year: 44.9 inches
- Comparison to 1901-2000 average: 0.3 inches above average (#58 rainiest September-August period since 1895)
- Comparison to state's precipitation over past year: 3.0 inches above statewide average
You may also like: How Virginia ranks for most motorcycle fatalities
Ethan Quin // Shutterstock
6 / 50#45. Pulaski County
- Precipitation over the past year: 40.1 inches
- Comparison to 1901-2000 average: 0.3 inches above average (#61 rainiest September-August period since 1895)
- Comparison to state's precipitation over past year: 1.8 inches below statewide average
Wileydoc // Shutterstock
7 / 50#44. Emporia
- Precipitation over the past year: 45.1 inches
- Comparison to 1901-2000 average: 0.4 inches above average (#56 rainiest September-August period since 1895)
- Comparison to state's precipitation over past year: 3.2 inches above statewide average
#43. Brunswick County
- Precipitation over the past year: 44.8 inches
- Comparison to 1901-2000 average: 0.5 inches above average (#56 rainiest September-August period since 1895)
- Comparison to state's precipitation over past year: 2.9 inches above statewide average
#42. Newport News
- Precipitation over the past year: 45.5 inches
- Comparison to 1901-2000 average: 0.5 inches above average (#57 rainiest September-August period since 1895)
- Comparison to state's precipitation over past year: 3.6 inches above statewide average
#41. Washington County
- Precipitation over the past year: 45.2 inches
- Comparison to 1901-2000 average: 0.5 inches above average (#64 rainiest September-August period since 1895)
- Comparison to state's precipitation over past year: 3.4 inches above statewide average
You may also like: Coldest Decembers in Virginia since 1895
#40. Accomack County
- Precipitation over the past year: 42.3 inches
- Comparison to 1901-2000 average: 0.5 inches above average (#61 rainiest September-August period since 1895)
- Comparison to state's precipitation over past year: 0.5 inches above statewide average
Kyle J Little // Shutterstock
12 / 50#39. Hampton
- Precipitation over the past year: 45.1 inches
- Comparison to 1901-2000 average: 0.7 inches above average (#56 rainiest September-August period since 1895)
- Comparison to state's precipitation over past year: 3.3 inches above statewide average
#38. Mathews County
- Precipitation over the past year: 44.4 inches
- Comparison to 1901-2000 average: 0.7 inches above average (#57 rainiest September-August period since 1895)
- Comparison to state's precipitation over past year: 2.6 inches above statewide average
#37. York County
- Precipitation over the past year: 45.2 inches
- Comparison to 1901-2000 average: 0.7 inches above average (#54 rainiest September-August period since 1895)
- Comparison to state's precipitation over past year: 3.4 inches above statewide average
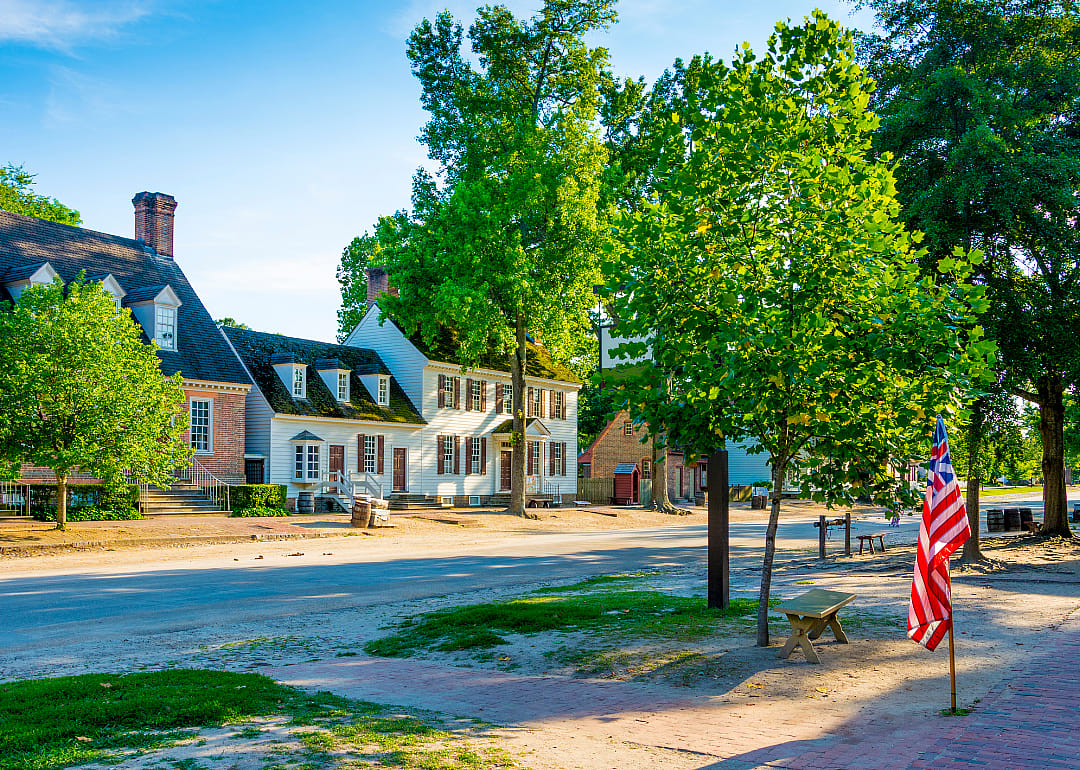
Bryan Pollard // Shutterstock
15 / 50#35. Williamsburg
- Precipitation over the past year: 45.6 inches
- Comparison to 1901-2000 average: 0.9 inches above average (#54 rainiest September-August period since 1895)
- Comparison to state's precipitation over past year: 3.7 inches above statewide average
#34. Fluvanna County
- Precipitation over the past year: 43.3 inches
- Comparison to 1901-2000 average: 0.9 inches above average (#63 rainiest September-August period since 1895)
- Comparison to state's precipitation over past year: 1.4 inches above statewide average
Comfreeze.Net Inc // Shutterstock
18 / 50#33. Poquoson
- Precipitation over the past year: 45.1 inches
- Comparison to 1901-2000 average: 1.1 inches above average (#51 rainiest September-August period since 1895)
- Comparison to state's precipitation over past year: 3.2 inches above statewide average
Kristi Blokhin // Shutterstock
19 / 50#32. Nelson County
- Precipitation over the past year: 45.5 inches
- Comparison to 1901-2000 average: 1.2 inches above average (#61 rainiest September-August period since 1895)
- Comparison to state's precipitation over past year: 3.6 inches above statewide average
Don Williamson // Shutterstock
21 / 50#30. Nottoway County
- Precipitation over the past year: 45.0 inches
- Comparison to 1901-2000 average: 1.8 inches above average (#50 rainiest September-August period since 1895)
- Comparison to state's precipitation over past year: 3.1 inches above statewide average
ThomasPerkins.org // Shutterstock
22 / 50#29. Botetourt County
- Precipitation over the past year: 43.5 inches
- Comparison to 1901-2000 average: 2.0 inches above average (#54 rainiest September-August period since 1895)
- Comparison to state's precipitation over past year: 1.6 inches above statewide average
#28. Charlotte County
- Precipitation over the past year: 44.8 inches
- Comparison to 1901-2000 average: 2.3 inches above average (#54 rainiest September-August period since 1895)
- Comparison to state's precipitation over past year: 3.0 inches above statewide average
Kyle J Little // Shutterstock
24 / 50#27. Northampton County
- Precipitation over the past year: 44.6 inches
- Comparison to 1901-2000 average: 2.3 inches above average (#45 rainiest September-August period since 1895)
- Comparison to state's precipitation over past year: 2.8 inches above statewide average
#26. Roanoke County
- Precipitation over the past year: 44.1 inches
- Comparison to 1901-2000 average: 2.3 inches above average (#45 rainiest September-August period since 1895)
- Comparison to state's precipitation over past year: 2.3 inches above statewide average
You may also like: Best private colleges in Virginia
Carolyn M Carpenter // Shutterstock
26 / 50#25. Rockbridge County
- Precipitation over the past year: 43.8 inches
- Comparison to 1901-2000 average: 2.4 inches above average (#54 rainiest September-August period since 1895)
- Comparison to state's precipitation over past year: 2.0 inches above statewide average
#24. Salem
- Precipitation over the past year: 43.4 inches
- Comparison to 1901-2000 average: 2.4 inches above average (#43 rainiest September-August period since 1895)
- Comparison to state's precipitation over past year: 1.5 inches above statewide average
#23. Buena Vista
- Precipitation over the past year: 44.1 inches
- Comparison to 1901-2000 average: 2.5 inches above average (#55 rainiest September-August period since 1895)
- Comparison to state's precipitation over past year: 2.2 inches above statewide average
Nolichuckyjake // Shutterstock
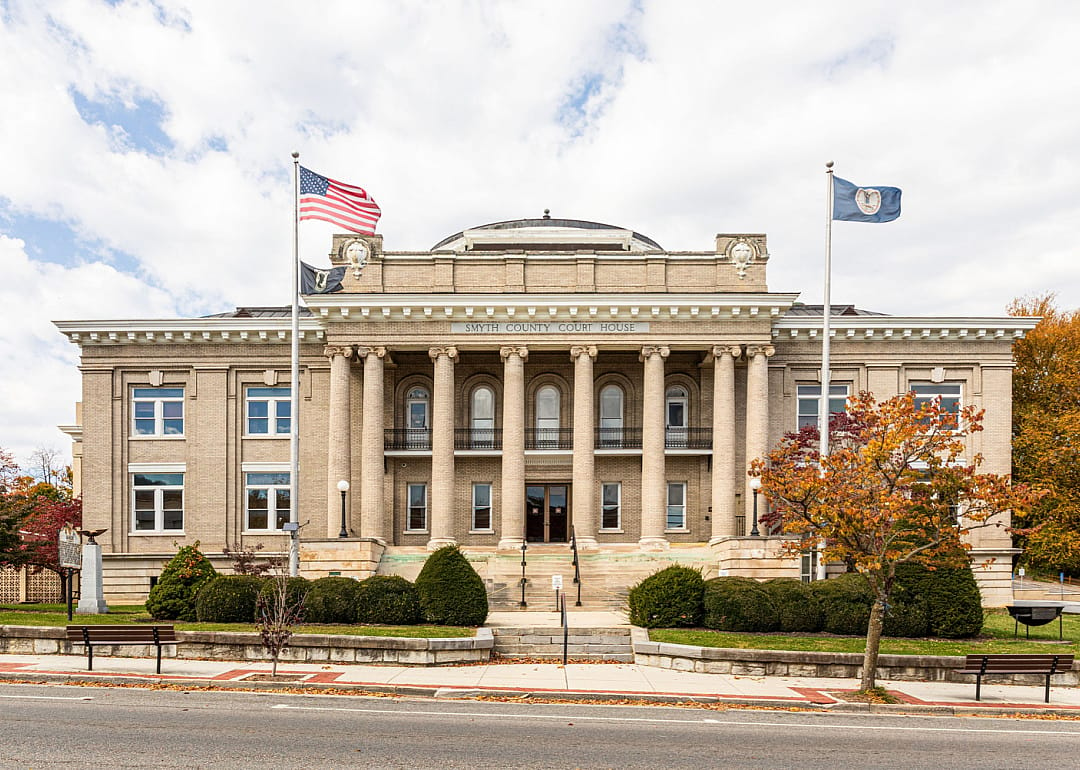
29 / 50#22. Smyth County
- Precipitation over the past year: 47.5 inches
- Comparison to 1901-2000 average: 2.6 inches above average (#53 rainiest September-August period since 1895)
- Comparison to state's precipitation over past year: 5.7 inches above statewide average
Dee Browning // Shutterstock
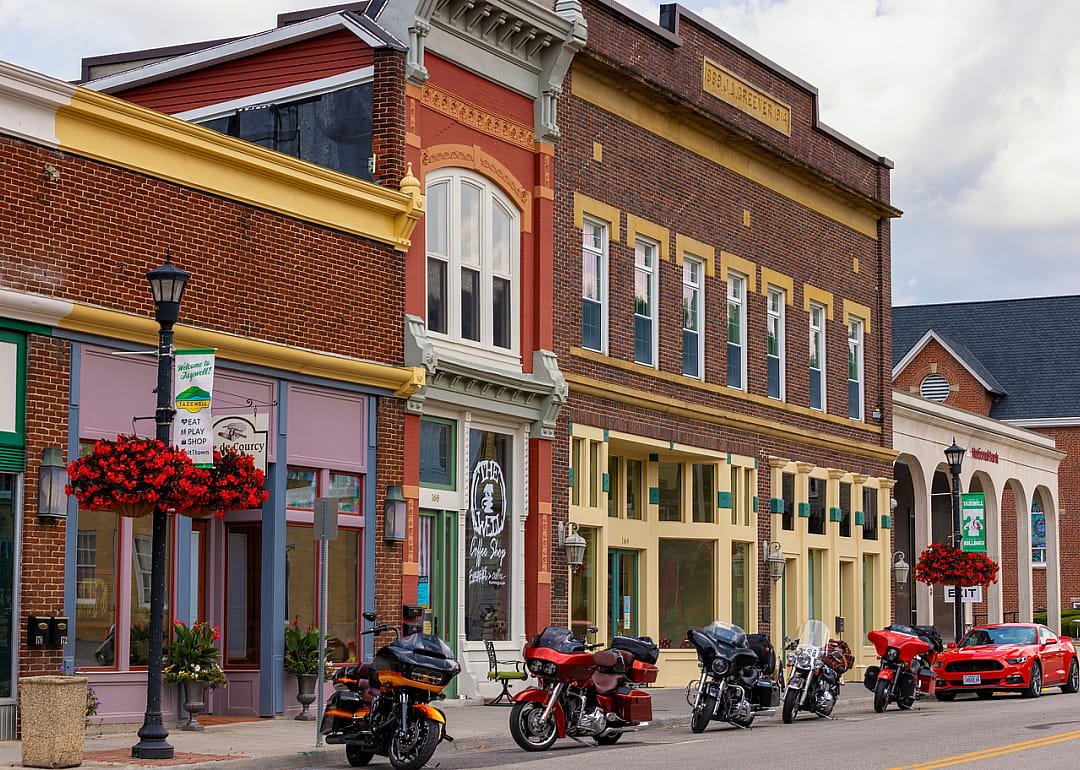
30 / 50#21. Tazewell County
- Precipitation over the past year: 48.1 inches
- Comparison to 1901-2000 average: 2.7 inches above average (#48 rainiest September-August period since 1895)
- Comparison to state's precipitation over past year: 6.2 inches above statewide average
You may also like: Highest-rated museums in Virginia by visitors
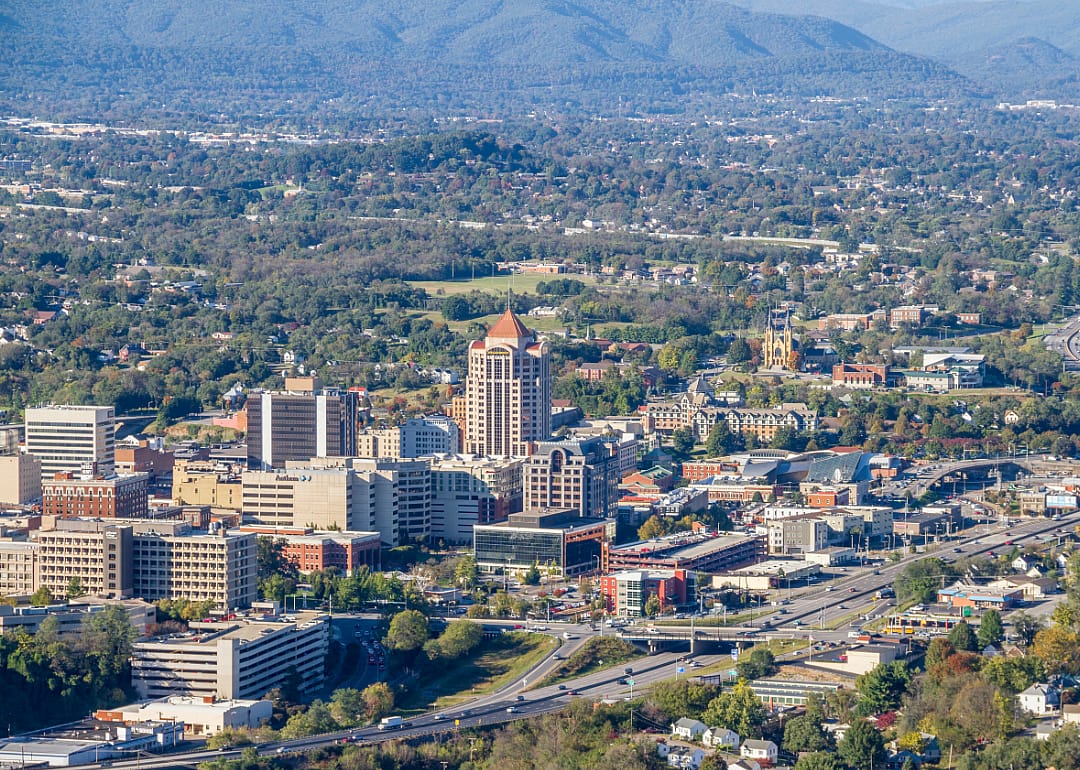
#20. Roanoke
- Precipitation over the past year: 44.0 inches
- Comparison to 1901-2000 average: 2.7 inches above average (#43 rainiest September-August period since 1895)
- Comparison to state's precipitation over past year: 2.1 inches above statewide average
#19. Cumberland County
- Precipitation over the past year: 45.5 inches
- Comparison to 1901-2000 average: 2.8 inches above average (#51 rainiest September-August period since 1895)
- Comparison to state's precipitation over past year: 3.7 inches above statewide average
#18. Grayson County
- Precipitation over the past year: 49.1 inches
- Comparison to 1901-2000 average: 3.6 inches above average (#41 rainiest September-August period since 1895)
- Comparison to state's precipitation over past year: 7.3 inches above statewide average
Felix Mizioznikov // Shutterstock
34 / 50#17. Wythe County
- Precipitation over the past year: 43.8 inches
- Comparison to 1901-2000 average: 3.6 inches above average (#36 rainiest September-August period since 1895)
- Comparison to state's precipitation over past year: 2.0 inches above statewide average
Jon Marc Lyttle / Shutterstock
35 / 50#16. Bedford County
- Precipitation over the past year: 47.2 inches
- Comparison to 1901-2000 average: 3.8 inches above average (#43 rainiest September-August period since 1895)
- Comparison to state's precipitation over past year: 5.4 inches above statewide average
You may also like: Cities with the fastest-growing home prices in Virginia
#15. Pittsylvania County
- Precipitation over the past year: 46.9 inches
- Comparison to 1901-2000 average: 3.8 inches above average (#43 rainiest September-August period since 1895)
- Comparison to state's precipitation over past year: 5.1 inches above statewide average
#14. Bland County
- Precipitation over the past year: 45.0 inches
- Comparison to 1901-2000 average: 3.9 inches above average (#36 rainiest September-August period since 1895)
- Comparison to state's precipitation over past year: 3.1 inches above statewide average
#13. Campbell County
- Precipitation over the past year: 46.4 inches
- Comparison to 1901-2000 average: 4.3 inches above average (#39 rainiest September-August period since 1895)
- Comparison to state's precipitation over past year: 4.5 inches above statewide average
Lekali Studio // Shutterstock
39 / 50#12. Prince Edward County
- Precipitation over the past year: 47.4 inches
- Comparison to 1901-2000 average: 4.8 inches above average (#34 rainiest September-August period since 1895)
- Comparison to state's precipitation over past year: 5.6 inches above statewide average
#11. Amherst County
- Precipitation over the past year: 49.5 inches
- Comparison to 1901-2000 average: 4.8 inches above average (#36 rainiest September-August period since 1895)
- Comparison to state's precipitation over past year: 7.7 inches above statewide average
You may also like: Highest-rated scenic drives in Virginia by visitors
#10. Franklin County
- Precipitation over the past year: 48.3 inches
- Comparison to 1901-2000 average: 4.9 inches above average (#28 rainiest September-August period since 1895)
- Comparison to state's precipitation over past year: 6.5 inches above statewide average
#9. Floyd County
- Precipitation over the past year: 50.1 inches
- Comparison to 1901-2000 average: 5.1 inches above average (#32 rainiest September-August period since 1895)
- Comparison to state's precipitation over past year: 8.3 inches above statewide average
Joseph Sohm // // Shutterstock
43 / 50#8. Buckingham County
- Precipitation over the past year: 48.2 inches
- Comparison to 1901-2000 average: 5.7 inches above average (#31 rainiest September-August period since 1895)
- Comparison to state's precipitation over past year: 6.3 inches above statewide average
Nolichuckyjake // Shutterstock
44 / 50#7. Galax
- Precipitation over the past year: 50.1 inches
- Comparison to 1901-2000 average: 5.7 inches above average (#31 rainiest September-August period since 1895)
- Comparison to state's precipitation over past year: 8.2 inches above statewide average
#6. Lynchburg
- Precipitation over the past year: 48.2 inches
- Comparison to 1901-2000 average: 5.8 inches above average (#28 rainiest September-August period since 1895)
- Comparison to state's precipitation over past year: 6.3 inches above statewide average
You may also like: Most common jobs 150 years ago in Virginia
Jon Bilous // Shutterstock
46 / 50#5. Carroll County
- Precipitation over the past year: 52.7 inches
- Comparison to 1901-2000 average: 6.8 inches above average (#23 rainiest September-August period since 1895)
- Comparison to state's precipitation over past year: 10.8 inches above statewide average
#4. Appomattox County
- Precipitation over the past year: 49.4 inches
- Comparison to 1901-2000 average: 7.3 inches above average (#23 rainiest September-August period since 1895)
- Comparison to state's precipitation over past year: 7.6 inches above statewide average
#3. Patrick County
- Precipitation over the past year: 57.1 inches
- Comparison to 1901-2000 average: 7.5 inches above average (#22 rainiest September-August period since 1895)
- Comparison to state's precipitation over past year: 15.2 inches above statewide average
grandbrothers // Shutterstock
49 / 50#2. Henry County
- Precipitation over the past year: 53.7 inches
- Comparison to 1901-2000 average: 8.7 inches above average (#15 rainiest September-August period since 1895)
- Comparison to state's precipitation over past year: 11.9 inches above statewide average
#1. Martinsville
- Precipitation over the past year: 56.0 inches
- Comparison to 1901-2000 average: 11.2 inches above average (#9 rainiest September-August period since 1895)
- Comparison to state's precipitation over past year: 14.2 inches above statewide average
This story features data reporting and writing by Emma Rubin, and is part of a series utilizing data automation across 44 states.
You may also like: More electric vehicles means less gas tax revenue: How this impacts Virginia's budget