Lonely road: The counties in Virginia where people drive to work alone the most

·Stacker

Photoroyalty // Shutterstock

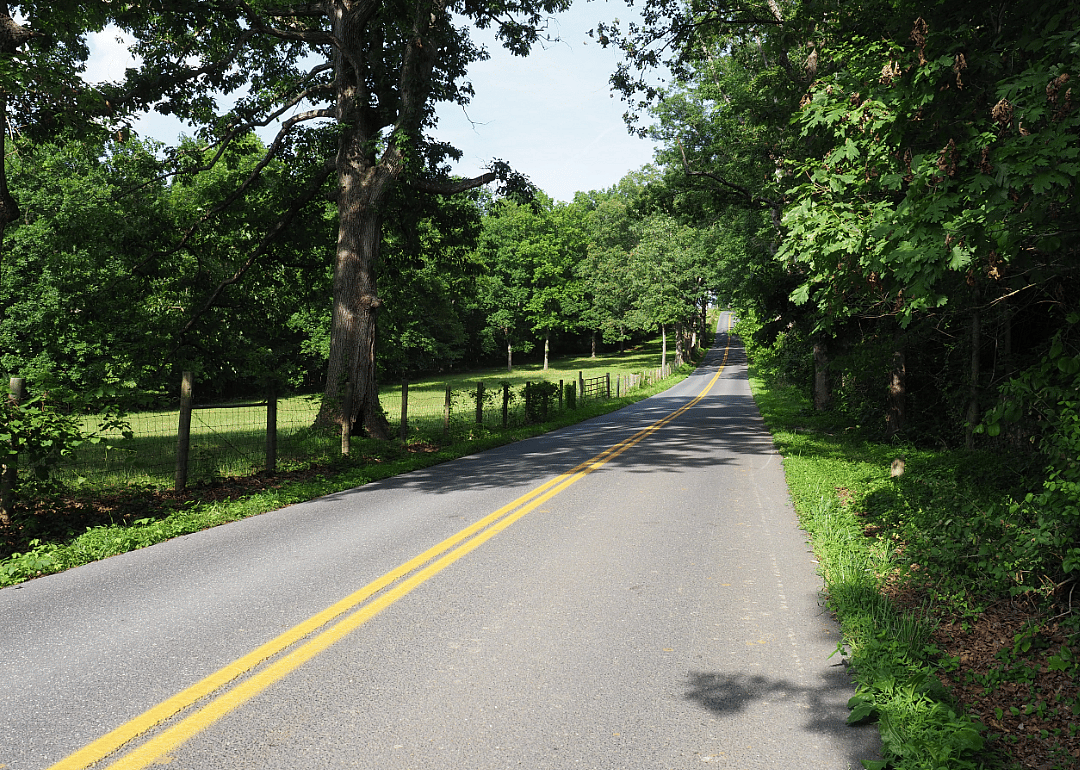
Rush hours are infamous for densely packed streets, seas of brake lights, and raging commuters—all products of a population that mostly drives alone.

About 7 in 10 Americans drive alone to work. That marks a new standard for the U.S. in the wake of the COVID-19 pandemic, which caused drive-alone commutes to drop as remote work became more widespread. Even so, driving alone remains the primary commuting method in the nation.

To identify areas where solo commutes remain most common, Truck Parking Club used Census Bureau data to map states by the share of people who drive to work alone, and to rank Virginia counties by their drive-alone rates. State-level figures are from 2023, while county-level data and comparisons are for 2022—the most recent data available in both cases. The analysis draws on other surveys and research to identify why these areas have more solo commuters and how it impacts individuals and their communities.

Americans drive alone to work more than their counterparts in peer nations. Across a selection of six countries, including China, Germany, and Brazil, the share of U.S. commuters who drove alone led the other nations by at least 10 percentage points in 2022, according to Statista's Global Consumer Survey. Researchers from the University of California, Berkeley, and other institutions found that most American cities have less access to jobs by walking or cycling than in European cities, and transit access to jobs falls behind other major cities throughout the world, according to a 2021 article in the journal Nature.

Research also shows that these driving habits often lead to physical inactivity, stress, anxiety, air-quality related health concerns, and a higher risk of car accidents. A high volume of people driving their own cars also creates congestion, which costs Americans valuable time—$733 worth of time on average in 2023 while spending 42 hours in traffic, according to data from transportation insights company Inrix. Some U.S. city economies lost billions in productivity and supply chain delays.

U.S. drive-alone rates hovered between 76% to 78% for decades, but dropped during the COVID-19 pandemic, falling to 68% in 2021. The rates have continued to hover below 70% through 2023, mitigating the adverse effects of driving alone. What's more, younger Americans acquire driver's licenses less often than previous generations, according to an analysis of Census data by the Washington Post published in 2023, meaning there are fewer drivers among the working-age population.

Still, the drop in drive-alone commutes has not happened evenly across the country. Read on to see where Americans—and Virginia residents—continue driving alone to work at the highest rates.

In the Northwest and mid-Atlantic, people drive to work alone at the lowest rates

Truck Parking Club

1 / 51

In the Northwest and mid-Atlantic, people drive to work alone at the lowest rates

In Virginia, 68.4% of workers over 16 drove alone for their commutes in 2023.

In general, states in the central part of the country had the highest rates of drive-alone commutes, between the central South and Midwest. Mississippi and Alabama were the top states for solo commutes, with about 8 in 10 people driving alone to work. They were followed closely by neighboring Louisiana and Arkansas, where 78.7% and 78.3% of commuters drove alone, respectively.

As of 2023, these states had below-average rates of remote work as compared to the rest of the nation. In Mississippi, for instance, only 5.5% of people worked from home, compared to 15.2% nationally. Lacking opportunities to work remotely, commuters in these states maintained their solo drives.

Most leading states also have below-average gas prices, making drive-alone commutes more affordable. And with lower population density, there is more space between homes and workplaces, making other transportation modes less feasible.

Meanwhile, states in the Northeast and Northwest have lower drive-alone rates. In New York, fewer than half of workers drive alone to work. Solo drivers comprise between 62% and 65% of commuters in Massachusetts, New Jersey, Hawai'i, Oregon, and Washington. Each has some combination of population density, heightened environmental consciousness, existing or expanding infrastructure for public transit, cycling, and walkability, and incentives for carpooling. As a result, residents of the Northeast and Northwest are more likely to use alternative commute methods.

Additionally, the Northeast and Northwest offer plentiful jobs in business, finance, information, and other professional services—industries with more capabilities for remote work, per 2023 data from the Bureau of Labor Statistics. Most employers in these industries increased telework after the pandemic's onset and continue to offer it at higher rates than the economy overall, BLS data shows. This further minimizes the need for drive-alone commutes in those areas.

Remote work opportunities have fallen since the pandemic's peak, and some have reverted back to their former driving habits. However, as the return of heavy traffic harms people's health, the economy, and the planet, and as gas prices in most areas of the country remain high, individuals and communities may continue seeking ways to cut down on their driving trips.

Read on to see the counties in Virginia with the most drive-alone commutes.
#50. King and Queen County
Canva

2 / 51

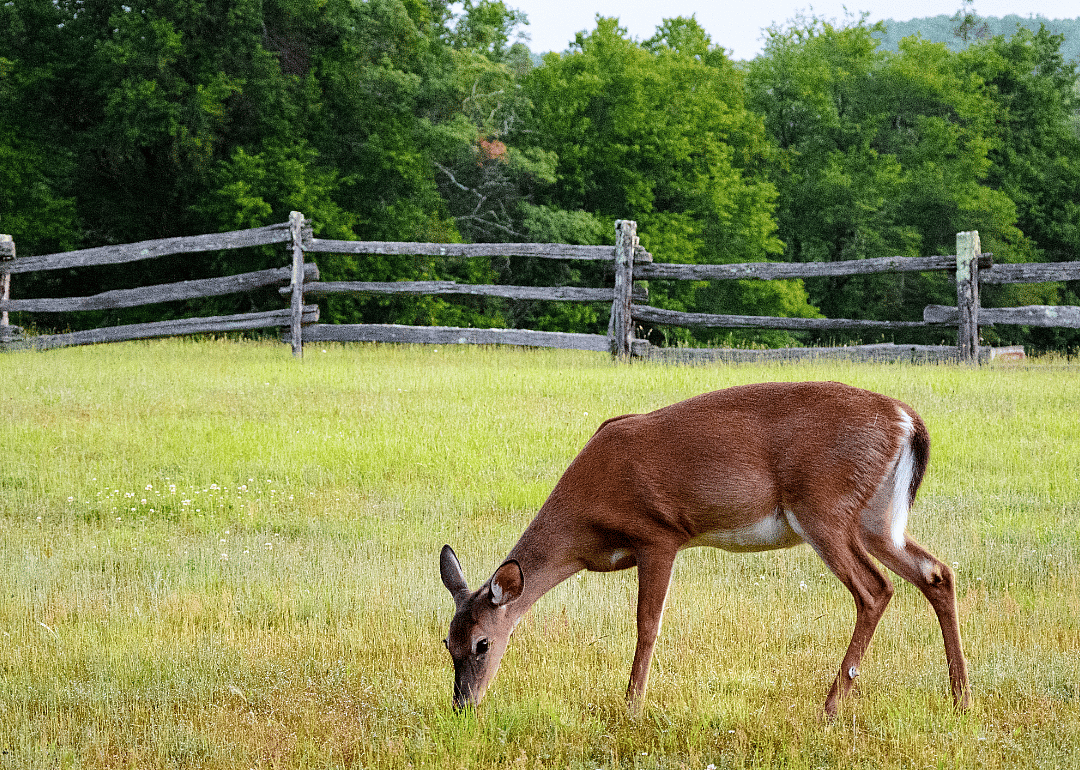
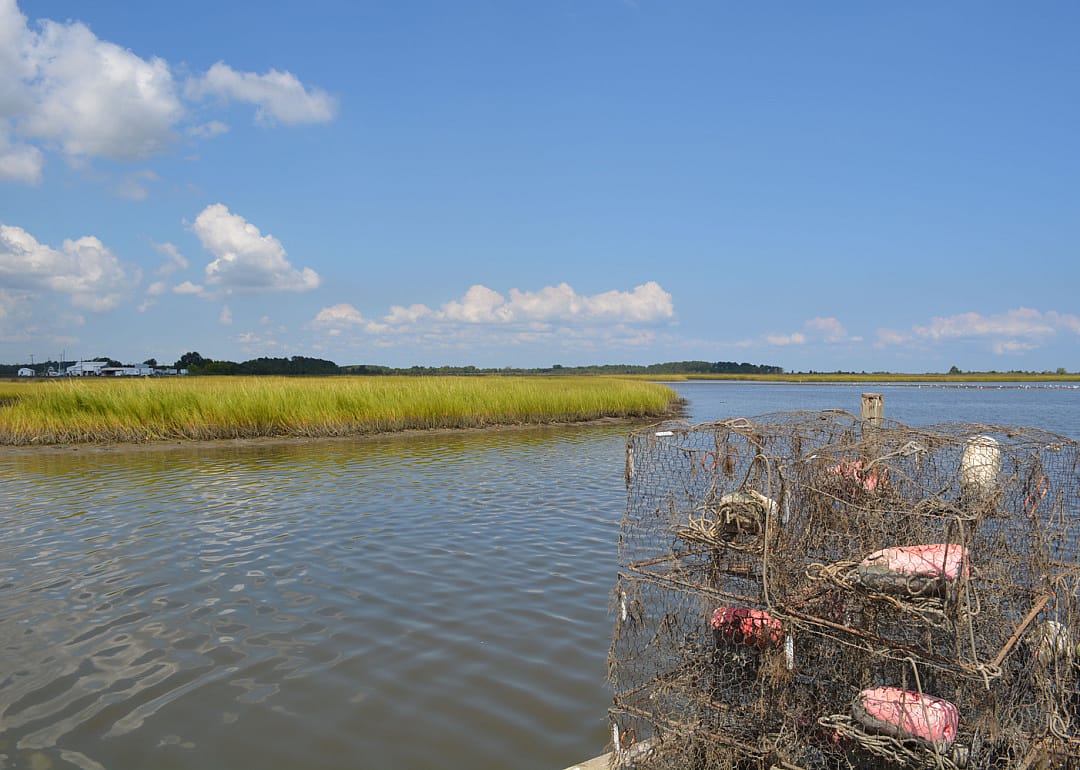
#50. King and Queen County

- Workers who drove alone: 80%
- Difference from state share: 11.6 percentage points higher
- Difference from national share: 8.3 percentage points higher

#49. Rockbridge County

Carolyn M Carpenter // Shutterstock

3 / 51

#49. Rockbridge County

- Workers who drove alone: 80.1%
- Difference from state share: 11.7 percentage points higher
- Difference from national share: 8.4 percentage points higher

#47. Brunswick County (tie)

Canva

4 / 51

#47. Brunswick County (tie)

- Workers who drove alone: 80.2%
- Difference from state share: 11.8 percentage points higher
- Difference from national share: 8.5 percentage points higher

#47. Southampton County (tie)

Canva

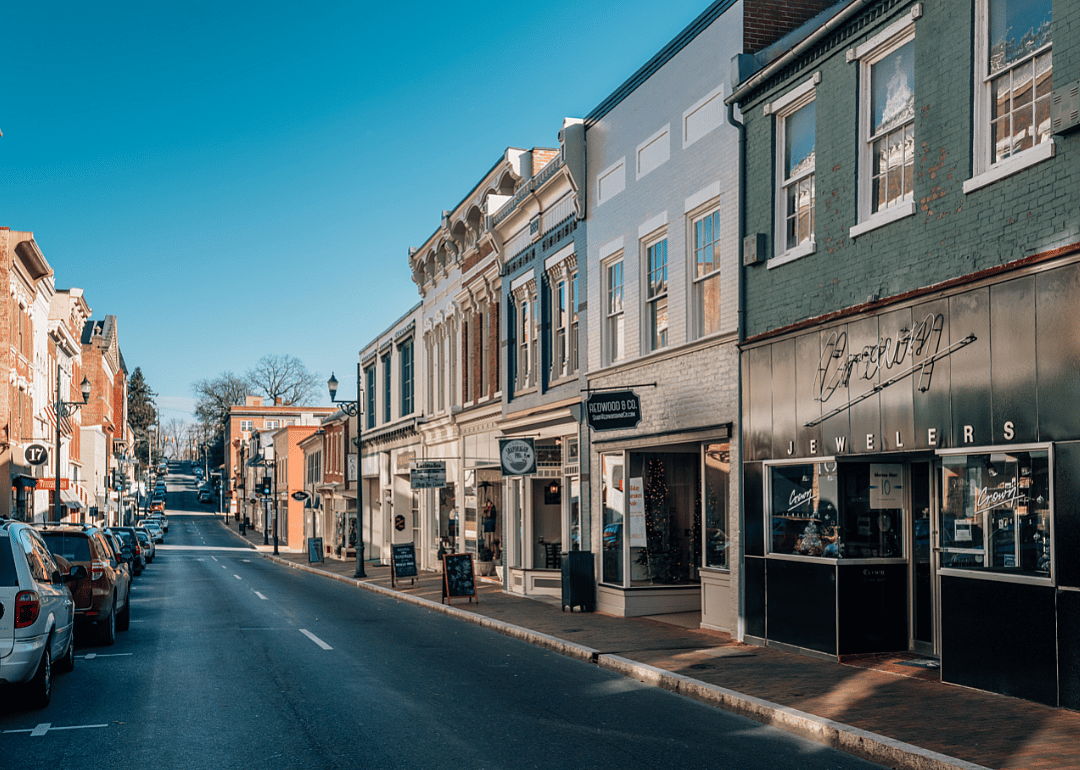
5 / 51

#47. Southampton County (tie)

- Workers who drove alone: 80.2%
- Difference from state share: 11.8 percentage points higher
- Difference from national share: 8.5 percentage points higher

#45. Buena Vista city (tie)

Canva

6 / 51

#45. Buena Vista city (tie)

- Workers who drove alone: 80.6%
- Difference from state share: 12.2 percentage points higher
- Difference from national share: 8.9 percentage points higher

#45. Staunton city (tie)

Canva

7 / 51

#45. Staunton city (tie)

- Workers who drove alone: 80.6%
- Difference from state share: 12.2 percentage points higher
- Difference from national share: 8.9 percentage points higher

#43. Charlotte County (tie)

Canva

8 / 51

#43. Charlotte County (tie)

- Workers who drove alone: 80.7%
- Difference from state share: 12.3 percentage points higher
- Difference from national share: 9.0 percentage points higher

#43. Wise County (tie)

Katssoup // Shutterstock

9 / 51

#43. Wise County (tie)

- Workers who drove alone: 80.7%
- Difference from state share: 12.3 percentage points higher
- Difference from national share: 9.0 percentage points higher

#41. Bland County (tie)

Canva

10 / 51

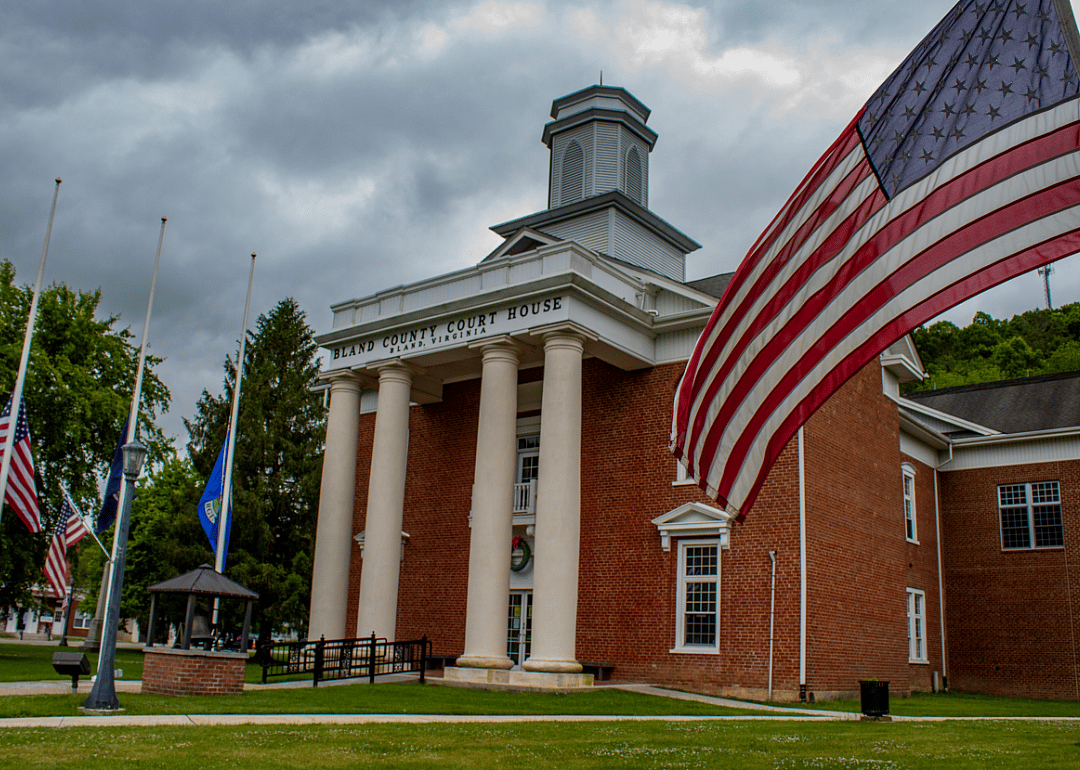
#41. Bland County (tie)

- Workers who drove alone: 80.8%
- Difference from state share: 12.4 percentage points higher
- Difference from national share: 9.1 percentage points higher

#41. Halifax County (tie)

Canva

11 / 51

#41. Halifax County (tie)

- Workers who drove alone: 80.8%
- Difference from state share: 12.4 percentage points higher
- Difference from national share: 9.1 percentage points higher

#39. King William County (tie)

Canva

12 / 51

#39. King William County (tie)

- Workers who drove alone: 81.2%
- Difference from state share: 12.8 percentage points higher
- Difference from national share: 9.5 percentage points higher

#39. Surry County (tie)

Timothy L Barnes // Shutterstock

13 / 51

#39. Surry County (tie)

- Workers who drove alone: 81.2%
- Difference from state share: 12.8 percentage points higher
- Difference from national share: 9.5 percentage points higher

#37. Buckingham County (tie)

Joseph Sohm // // Shutterstock

14 / 51

#37. Buckingham County (tie)

- Workers who drove alone: 81.3%
- Difference from state share: 12.9 percentage points higher
- Difference from national share: 9.6 percentage points higher

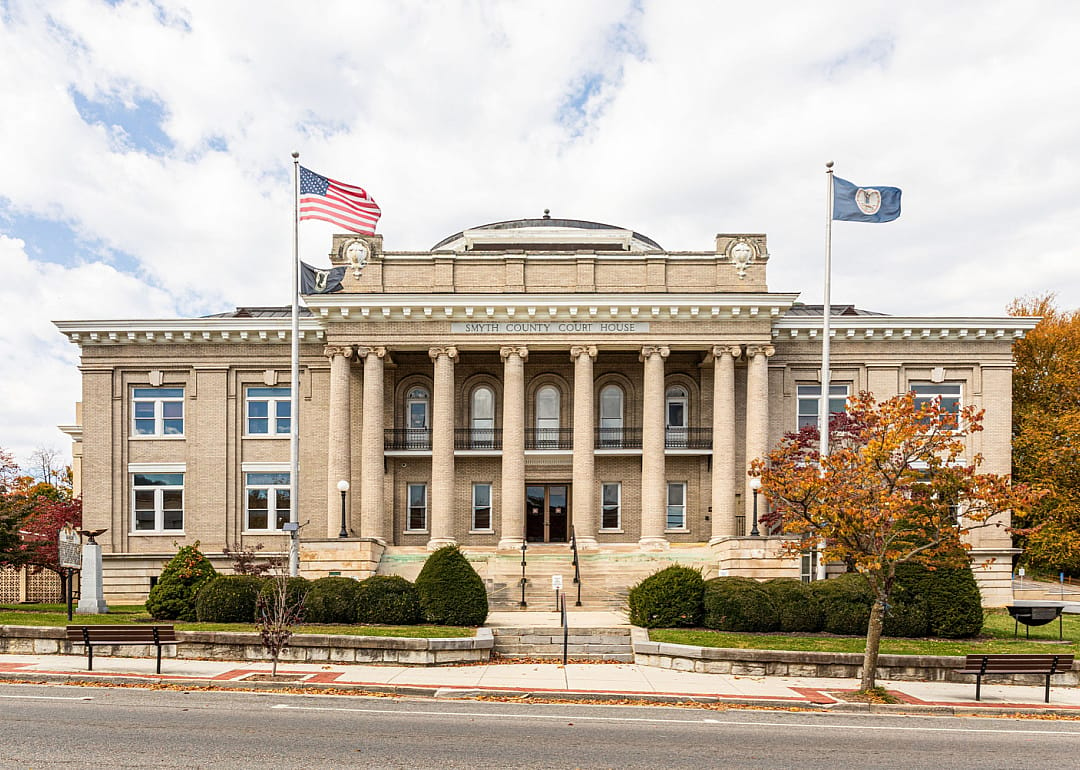
#37. Smyth County (tie)

Nolichuckyjake // Shutterstock

15 / 51

#37. Smyth County (tie)

- Workers who drove alone: 81.3%
- Difference from state share: 12.9 percentage points higher
- Difference from national share: 9.6 percentage points higher

#35. Charles City County (tie)

OJUP // Shutterstock

16 / 51

#35. Charles City County (tie)

- Workers who drove alone: 81.4%
- Difference from state share: 13.0 percentage points higher
- Difference from national share: 9.7 percentage points higher

#35. Hopewell city (tie)

OJUP // Shutterstock

17 / 51

#35. Hopewell city (tie)

- Workers who drove alone: 81.4%
- Difference from state share: 13.0 percentage points higher
- Difference from national share: 9.7 percentage points higher

#34. Grayson County

Canva

18 / 51

#34. Grayson County

- Workers who drove alone: 81.6%
- Difference from state share: 13.2 percentage points higher
- Difference from national share: 9.9 percentage points higher

#33. Botetourt County

ThomasPerkins.org // Shutterstock

19 / 51

#33. Botetourt County

- Workers who drove alone: 81.7%
- Difference from state share: 13.3 percentage points higher
- Difference from national share: 10.0 percentage points higher

#32. Lunenburg County

Canva

20 / 51

#32. Lunenburg County

- Workers who drove alone: 81.8%
- Difference from state share: 13.4 percentage points higher
- Difference from national share: 10.1 percentage points higher

#31. Bedford County

Jon Marc Lyttle / Shutterstock

21 / 51

#31. Bedford County

- Workers who drove alone: 81.9%
- Difference from state share: 13.5 percentage points higher
- Difference from national share: 10.2 percentage points higher

#30. Amelia County

Canva

22 / 51

#30. Amelia County

- Workers who drove alone: 82%
- Difference from state share: 13.6 percentage points higher
- Difference from national share: 10.3 percentage points higher

#29. Cumberland County

Canva

23 / 51

#29. Cumberland County

- Workers who drove alone: 82.2%
- Difference from state share: 13.8 percentage points higher
- Difference from national share: 10.5 percentage points higher

#28. Colonial Heights city

EWY Media // Shutterstock

24 / 51

#28. Colonial Heights city

- Workers who drove alone: 82.4%
- Difference from state share: 14.0 percentage points higher
- Difference from national share: 10.7 percentage points higher

#26. Dinwiddie County (tie)

Canva

25 / 51

#26. Dinwiddie County (tie)

- Workers who drove alone: 82.7%
- Difference from state share: 14.3 percentage points higher
- Difference from national share: 11.0 percentage points higher

#26. Isle of Wight County (tie)

Melinda Fawver // Shutterstock

26 / 51

#26. Isle of Wight County (tie)

- Workers who drove alone: 82.7%
- Difference from state share: 14.3 percentage points higher
- Difference from national share: 11.0 percentage points higher

#25. Mecklenburg County

Canva

27 / 51

#25. Mecklenburg County

- Workers who drove alone: 82.9%
- Difference from state share: 14.5 percentage points higher
- Difference from national share: 11.2 percentage points higher

#24. Suffolk city

O.C Ritz // Shutterstock

28 / 51

#24. Suffolk city

- Workers who drove alone: 83%
- Difference from state share: 14.6 percentage points higher
- Difference from national share: 11.3 percentage points higher

#23. Lee County

Jeffery L Willis // Shutterstock

29 / 51

#23. Lee County

- Workers who drove alone: 83.2%
- Difference from state share: 14.8 percentage points higher
- Difference from national share: 11.5 percentage points higher

#22. Henry County

grandbrothers // Shutterstock

30 / 51

#22. Henry County

- Workers who drove alone: 83.7%
- Difference from state share: 15.3 percentage points higher
- Difference from national share: 12.0 percentage points higher

#20. Campbell County (tie)

Canva

31 / 51

#20. Campbell County (tie)

- Workers who drove alone: 83.8%
- Difference from state share: 15.4 percentage points higher
- Difference from national share: 12.1 percentage points higher

#20. Wythe County (tie)

Felix Mizioznikov // Shutterstock

32 / 51

#20. Wythe County (tie)

- Workers who drove alone: 83.8%
- Difference from state share: 15.4 percentage points higher
- Difference from national share: 12.1 percentage points higher

#19. Carroll County

Jon Bilous // Shutterstock

33 / 51

#19. Carroll County

- Workers who drove alone: 83.9%
- Difference from state share: 15.5 percentage points higher
- Difference from national share: 12.2 percentage points higher

#18. Washington County

Canva

34 / 51

#18. Washington County

- Workers who drove alone: 84.4%
- Difference from state share: 16.0 percentage points higher
- Difference from national share: 12.7 percentage points higher

#17. Augusta County

Canva

35 / 51

#17. Augusta County

- Workers who drove alone: 84.6%
- Difference from state share: 16.2 percentage points higher
- Difference from national share: 12.9 percentage points higher

#16. Gloucester County

Barry Blackburn // Shutterstock

36 / 51

#16. Gloucester County

- Workers who drove alone: 84.7%
- Difference from state share: 16.3 percentage points higher
- Difference from national share: 13.0 percentage points higher

#14. Pulaski County (tie)

Ethan Quin // Shutterstock

37 / 51

#14. Pulaski County (tie)

- Workers who drove alone: 84.9%
- Difference from state share: 16.5 percentage points higher
- Difference from national share: 13.2 percentage points higher

#14. Franklin city (tie)

Canva

38 / 51

#14. Franklin city (tie)

- Workers who drove alone: 84.9%
- Difference from state share: 16.5 percentage points higher
- Difference from national share: 13.2 percentage points higher

#13. Dickenson County

Canva

39 / 51

#13. Dickenson County

- Workers who drove alone: 85%
- Difference from state share: 16.6 percentage points higher
- Difference from national share: 13.3 percentage points higher

#12. Scott County

Canva

40 / 51

#12. Scott County

- Workers who drove alone: 85.1%
- Difference from state share: 16.7 percentage points higher
- Difference from national share: 13.4 percentage points higher

#11. Poquoson city

Comfreeze.Net Inc // Shutterstock

41 / 51

#11. Poquoson city

- Workers who drove alone: 85.4%
- Difference from state share: 17.0 percentage points higher
- Difference from national share: 13.7 percentage points higher

#9. Appomattox County (tie)

Canva

42 / 51

#9. Appomattox County (tie)

- Workers who drove alone: 85.5%
- Difference from state share: 17.1 percentage points higher
- Difference from national share: 13.8 percentage points higher

#9. Giles County (tie)

Richie Sheppard // Shutterstock

43 / 51

#9. Giles County (tie)

- Workers who drove alone: 85.5%
- Difference from state share: 17.1 percentage points higher
- Difference from national share: 13.8 percentage points higher

#8. Tazewell County

Dee Browning // Shutterstock

44 / 51

#8. Tazewell County

- Workers who drove alone: 85.6%
- Difference from state share: 17.2 percentage points higher
- Difference from national share: 13.9 percentage points higher

#7. Pittsylvania County

Canva

45 / 51

#7. Pittsylvania County

- Workers who drove alone: 85.9%
- Difference from state share: 17.5 percentage points higher
- Difference from national share: 14.2 percentage points higher

#6. Buchanan County

Canva

46 / 51

#6. Buchanan County

- Workers who drove alone: 86.1%
- Difference from state share: 17.7 percentage points higher
- Difference from national share: 14.4 percentage points higher

#5. Sussex County

Canva

47 / 51

#5. Sussex County

- Workers who drove alone: 86.3%
- Difference from state share: 17.9 percentage points higher
- Difference from national share: 14.6 percentage points higher

#4. Bath County

Andriy Blokhin // Shutterstock

48 / 51

#4. Bath County

- Workers who drove alone: 87.7%
- Difference from state share: 19.3 percentage points higher
- Difference from national share: 16.0 percentage points higher

#2. Alleghany County (tie)

ThomasPerkins.org // Shutterstock

49 / 51

#2. Alleghany County (tie)

- Workers who drove alone: 90.1%
- Difference from state share: 21.7 percentage points higher
- Difference from national share: 18.4 percentage points higher

#2. Covington city (tie)

Canva

50 / 51

#2. Covington city (tie)

- Workers who drove alone: 90.1%
- Difference from state share: 21.7 percentage points higher
- Difference from national share: 18.4 percentage points higher

#1. Craig County

Jordan Kercheff // Shutterstock

51 / 51

#1. Craig County

- Workers who drove alone: 90.6%
- Difference from state share: 22.2 percentage points higher
- Difference from national share: 18.9 percentage points higher

This story features data reporting and writing by Paxtyn Merten and is part of a series utilizing data automation across 50 states.