Stacker
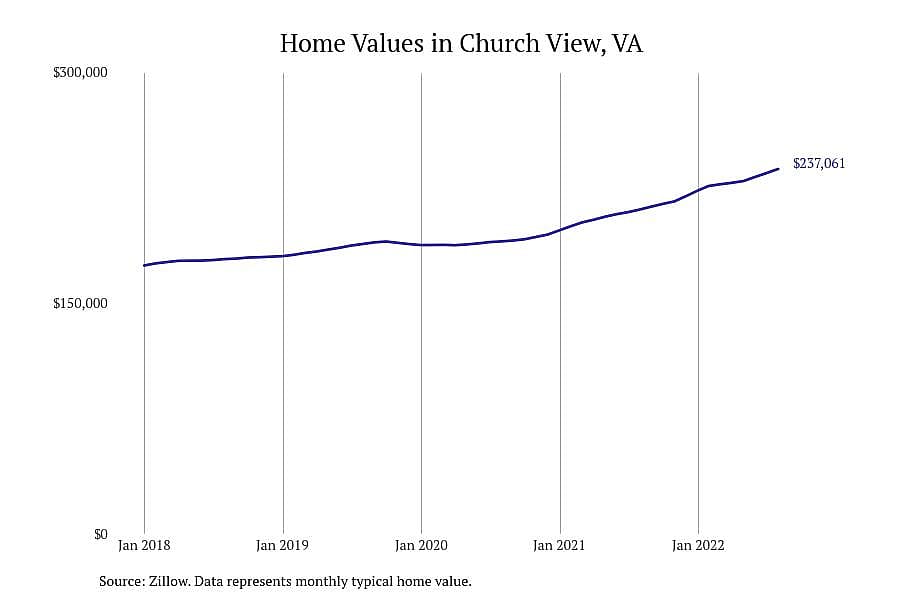
1 / 11#11. Church View, VA
- Typical home value: $237,061
- 1-year price change: +12.5%
- 5-year price change: +37.0%

Stacker compiled a list of places with the most expensive homes in Middlesex County, VA using data from Zillow. Places are ranked by the Zillow Home Values Index for all homes as of August 2022. The ZVHI represents a seasonally adjusted price for the middle market for all homes. All 11 cities and towns with data available were included in the list. Charts for each place show the monthly typical home value since January 2018.
You may also like: How personal income has changed in Middlesex County, Virginia
Stacker
1 / 11- Typical home value: $237,061
- 1-year price change: +12.5%
- 5-year price change: +37.0%
Stacker
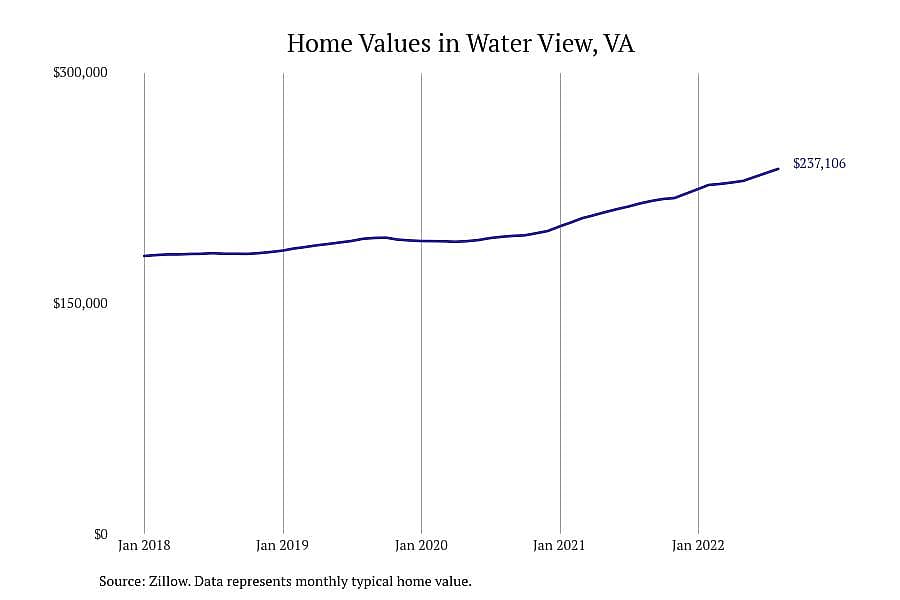
2 / 11- Typical home value: $237,106
- 1-year price change: +10.5%
- 5-year price change: +30.5%
Stacker
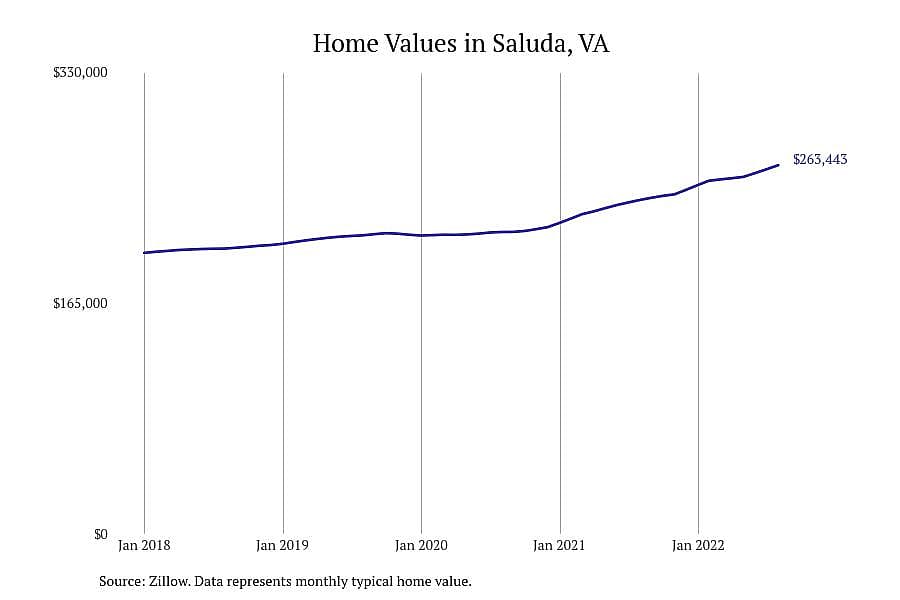
3 / 11- Typical home value: $263,443
- 1-year price change: +10.4%
- 5-year price change: +32.1%
Stacker
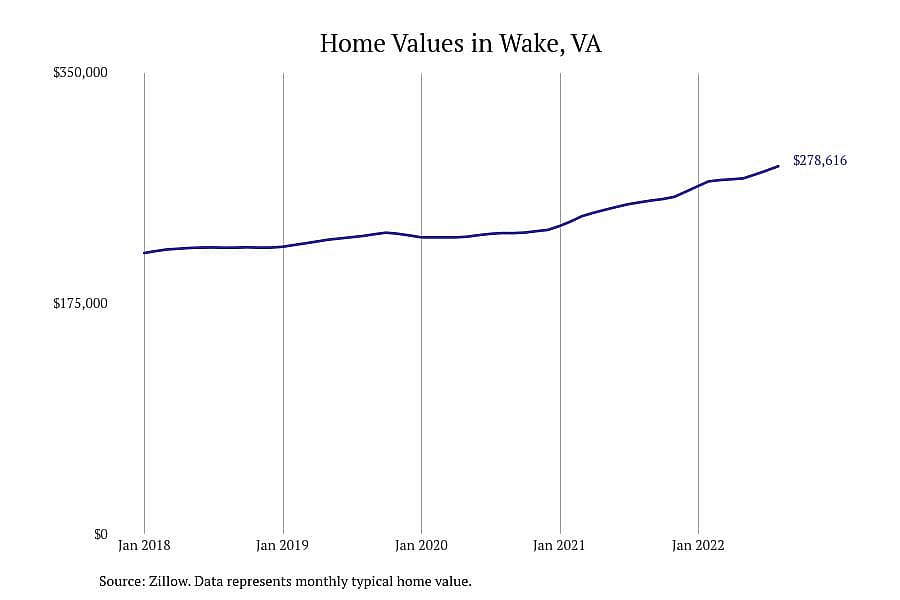
4 / 11- Typical home value: $278,616
- 1-year price change: +10.9%
- 5-year price change: +33.3%
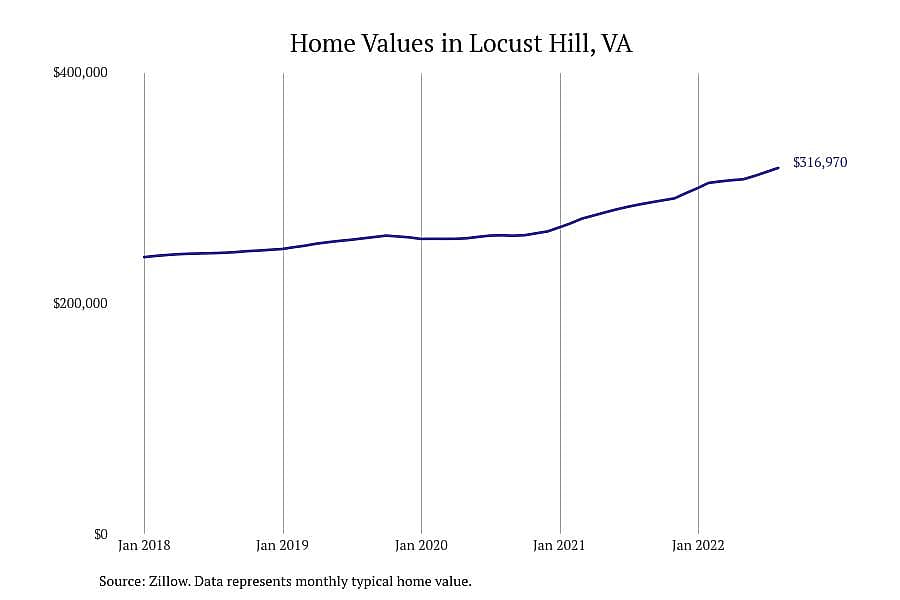
Stacker
5 / 11- Typical home value: $316,970
- 1-year price change: +11.1%
- 5-year price change: +32.4%
You may also like: Food insecurity rates in Middlesex County, VA
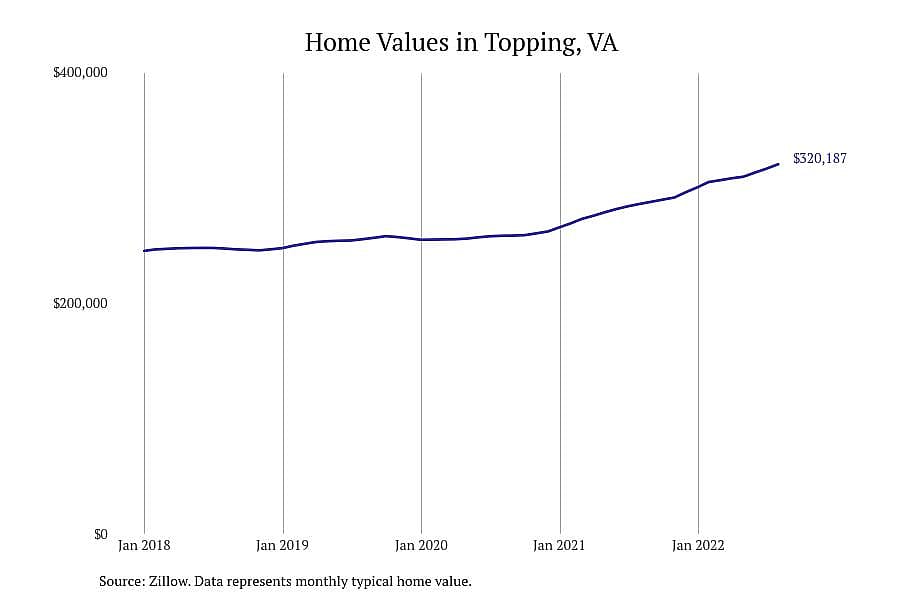
Stacker
6 / 11- Typical home value: $320,187
- 1-year price change: +12.0%
- 5-year price change: +30.1%
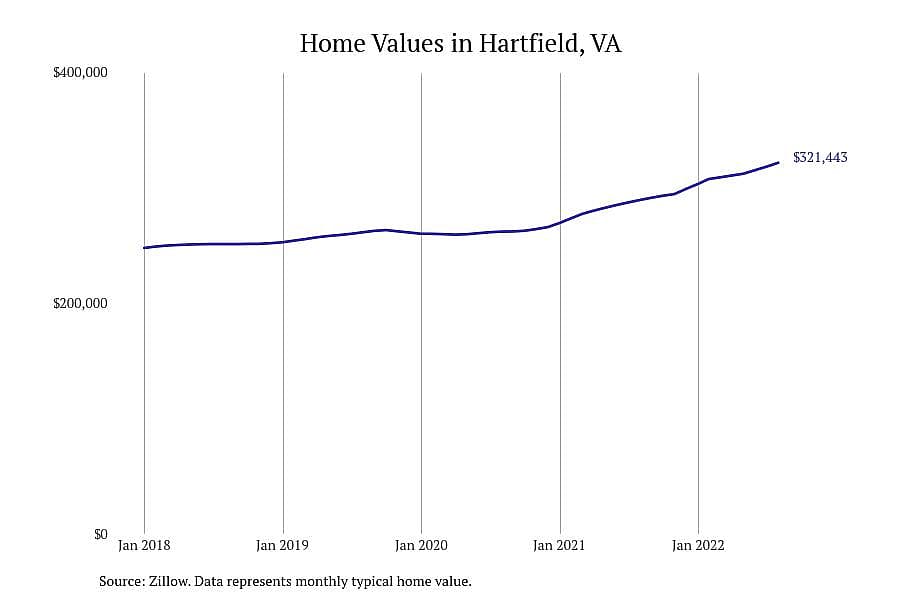
Stacker
7 / 11- Typical home value: $321,443
- 1-year price change: +11.2%
- 5-year price change: +30.9%
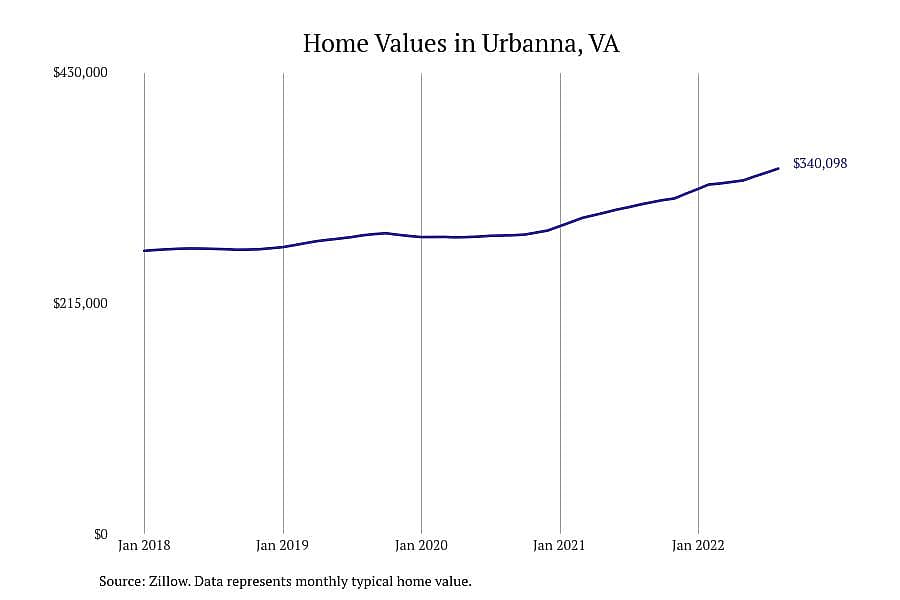
Stacker
8 / 11- Typical home value: $340,098
- 1-year price change: +10.9%
- 5-year price change: +27.1%
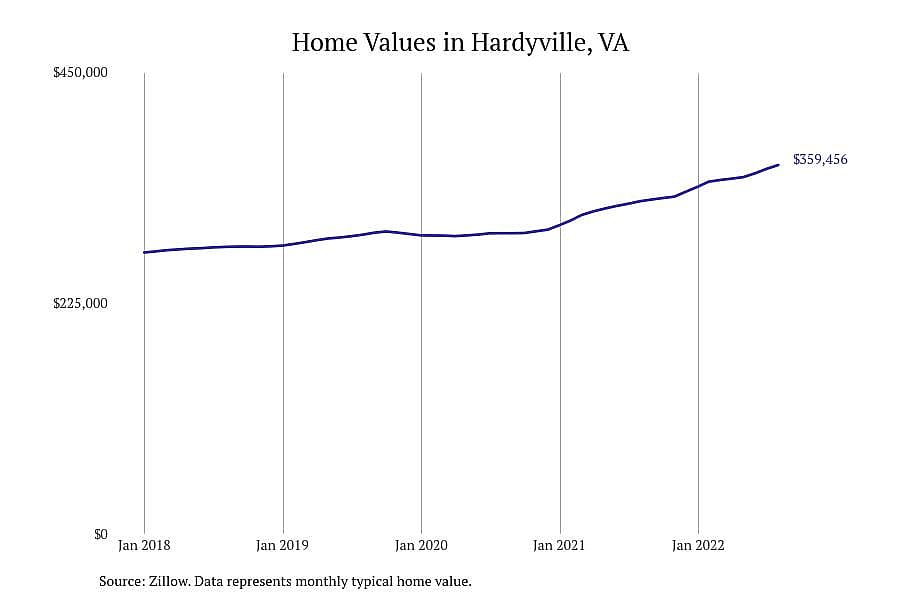
Stacker
9 / 11- Typical home value: $359,456
- 1-year price change: +10.9%
- 5-year price change: +32.2%
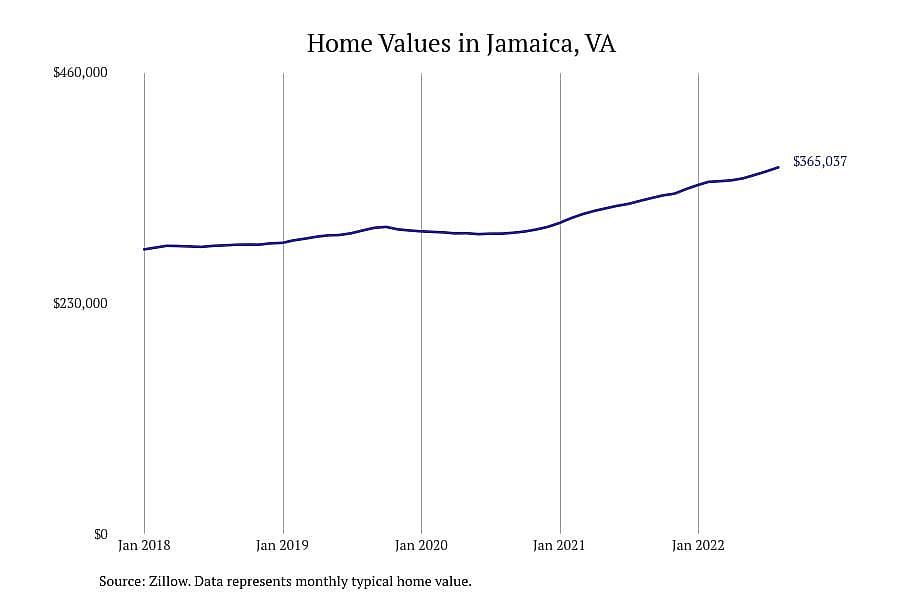
Stacker
10 / 11- Typical home value: $365,037
- 1-year price change: +10.1%
- 5-year price change: +32.9%
You may also like: How Middlesex County, Virginia's GDP has changed since 2018
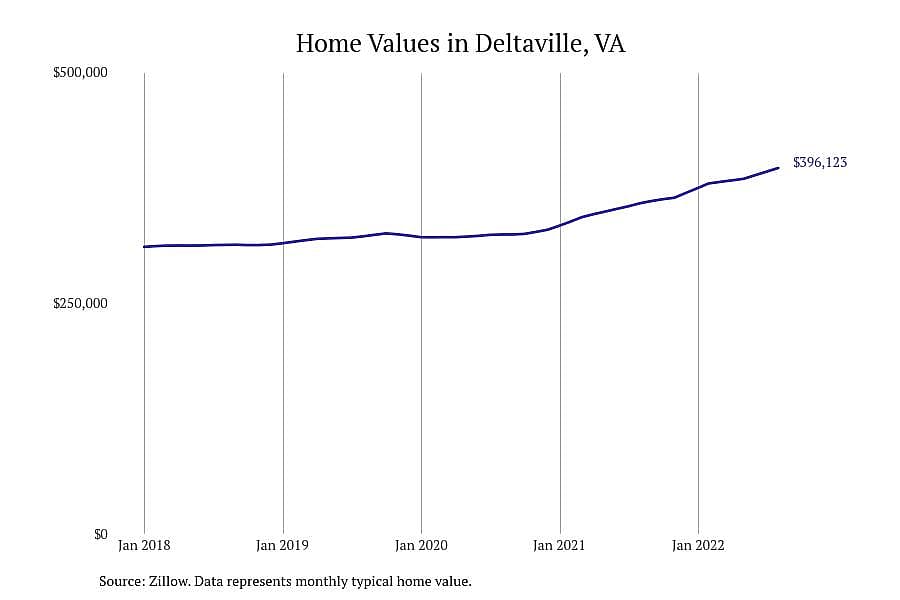
Stacker
11 / 11- Typical home value: $396,123
- 1-year price change: +10.7%
- 5-year price change: +27.1%