Rain, sleet, snow, hail, wintry mix. Precipitation takes on many forms, and the degree to which climate change affects precipitation levels comes down to something almost everyone learns about in school—Earth's water cycle. A system in endless motion, the water cycle traces the process through which water exists in its three primary phases—liquid, solid, and gas—as it moves perpetually between the Earth and its atmosphere.
Increases in precipitation frequency and intensity are markers of climate change. When temperatures rise and oceans grow warmer, the amount of water that evaporates into the atmosphere—and the speed at which it does so—also increases. As atmospheric circulation carries the moisture-rich air over land or pushes it into a storm system, heavy rain or snow is often the result.
The continental U.S. on average received about 30 inches of precipitation between March 2022 and February 2023. Traditionally "wet" regions—such as Washington state and Alaska in the northwest and Georgia and Mississippi in the southeast—continue to have some of the rainiest counties in the United States. Other areas such as Oklahoma, Kansas, and Nebraska, as well as pockets of the South and of California, experience the opposite extreme: drought, also largely a product of climate change.
Stacker cited data from the National Centers for Environmental Information to identify the counties in Virginia that receive the most precipitation through rain, sleet, or snow. Counties are ranked by five-year precipitation averages in inches as of February 2023 with rainfall over the past year serving as a tiebreaker. Supplementary data on how last year's precipitation compares to the 100-year average for the area is also included.
You may also like: Cities with the fastest-growing home prices in Virginia
#50. Charlotte County
- Five-year precipitation average: 51.74 inches
- Precipitation over the past year: 43.26 inches (#71 rainiest year since 1895)
- Precipitation compared to 1901-2000 average: 0.81 inches above norm
EchoFree // Shutterstock
2 / 50#49. Middlesex County
- Five-year precipitation average: 51.77 inches
- Precipitation over the past year: 40.69 inches (#40 rainiest year since 1895)
- Precipitation compared to 1901-2000 average: -3.01 inches below norm
#48. Newport News City
- Five-year precipitation average: 51.87 inches
- Precipitation over the past year: 43.09 inches (#48 rainiest year since 1895)
- Precipitation compared to 1901-2000 average: -1.81 inches below norm
EWY Media // Shutterstock
4 / 50#47. Colonial Heights City
- Five-year precipitation average: 51.93 inches
- Precipitation over the past year: 39.58 inches (#40 rainiest year since 1895)
- Precipitation compared to 1901-2000 average: -3.40 inches below norm
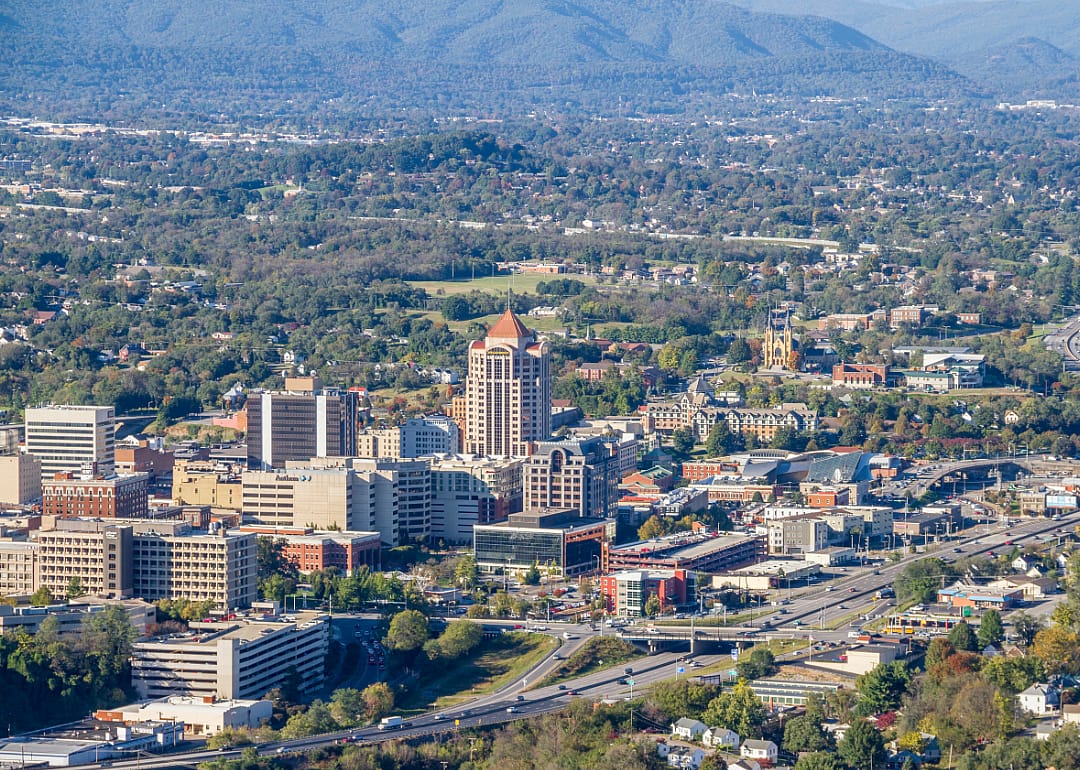
#46. Roanoke City
- Five-year precipitation average: 52.00 inches
- Precipitation over the past year: 49.22 inches (#117 rainiest year since 1895)
- Precipitation compared to 1901-2000 average: 8.08 inches above norm
You may also like: Car insurance rates in Virginia
#45. Halifax County
- Five-year precipitation average: 52.02 inches
- Precipitation over the past year: 46.30 inches (#89 rainiest year since 1895)
- Precipitation compared to 1901-2000 average: 3.34 inches above norm
#44. Campbell County
- Five-year precipitation average: 52.05 inches
- Precipitation over the past year: 42.83 inches (#70 rainiest year since 1895)
- Precipitation compared to 1901-2000 average: 0.79 inches above norm
#43. King and Queen County
- Five-year precipitation average: 52.19 inches
- Precipitation over the past year: 40.15 inches (#37 rainiest year since 1895)
- Precipitation compared to 1901-2000 average: -3.47 inches below norm
#42. King William County
- Five-year precipitation average: 52.37 inches
- Precipitation over the past year: 40.44 inches (#41 rainiest year since 1895)
- Precipitation compared to 1901-2000 average: -2.97 inches below norm
OJUP // Shutterstock
10 / 50#41. Petersburg City
- Five-year precipitation average: 52.39 inches
- Precipitation over the past year: 40.05 inches (#39 rainiest year since 1895)
- Precipitation compared to 1901-2000 average: -3.22 inches below norm
You may also like: Movies and TV shows casting in Virginia
#40. Roanoke County
- Five-year precipitation average: 52.47 inches
- Precipitation over the past year: 49.03 inches (#113 rainiest year since 1895)
- Precipitation compared to 1901-2000 average: 7.29 inches above norm
#39. Mecklenburg County
- Five-year precipitation average: 52.49 inches
- Precipitation over the past year: 43.78 inches (#62 rainiest year since 1895)
- Precipitation compared to 1901-2000 average: 0.09 inches above norm
Barry Blackburn // Shutterstock
13 / 50#38. Gloucester County
- Five-year precipitation average: 52.68 inches
- Precipitation over the past year: 42.72 inches (#53 rainiest year since 1895)
- Precipitation compared to 1901-2000 average: -1.34 inches below norm
#37. York County
- Five-year precipitation average: 52.77 inches
- Precipitation over the past year: 43.62 inches (#55 rainiest year since 1895)
- Precipitation compared to 1901-2000 average: -0.78 inches below norm
O.C Ritz // Shutterstock
15 / 50#36. Suffolk City
- Five-year precipitation average: 52.79 inches
- Precipitation over the past year: 44.38 inches (#43 rainiest year since 1895)
- Precipitation compared to 1901-2000 average: -2.85 inches below norm
You may also like: Hottest Octobers in Virginia since 1895
OJUP // Shutterstock
16 / 50#35. Hopewell City
- Five-year precipitation average: 52.86 inches
- Precipitation over the past year: 40.10 inches (#43 rainiest year since 1895)
- Precipitation compared to 1901-2000 average: -3.06 inches below norm
Kristi Blokhin // Shutterstock
17 / 50#34. Nelson County
- Five-year precipitation average: 53.04 inches
- Precipitation over the past year: 46.38 inches (#82 rainiest year since 1895)
- Precipitation compared to 1901-2000 average: 2.12 inches above norm
Dee Browning // Shutterstock
18 / 50#33. Tazewell County
- Five-year precipitation average: 53.04 inches
- Precipitation over the past year: 52.34 inches (#109 rainiest year since 1895)
- Precipitation compared to 1901-2000 average: 7.05 inches above norm
OJUP // Shutterstock
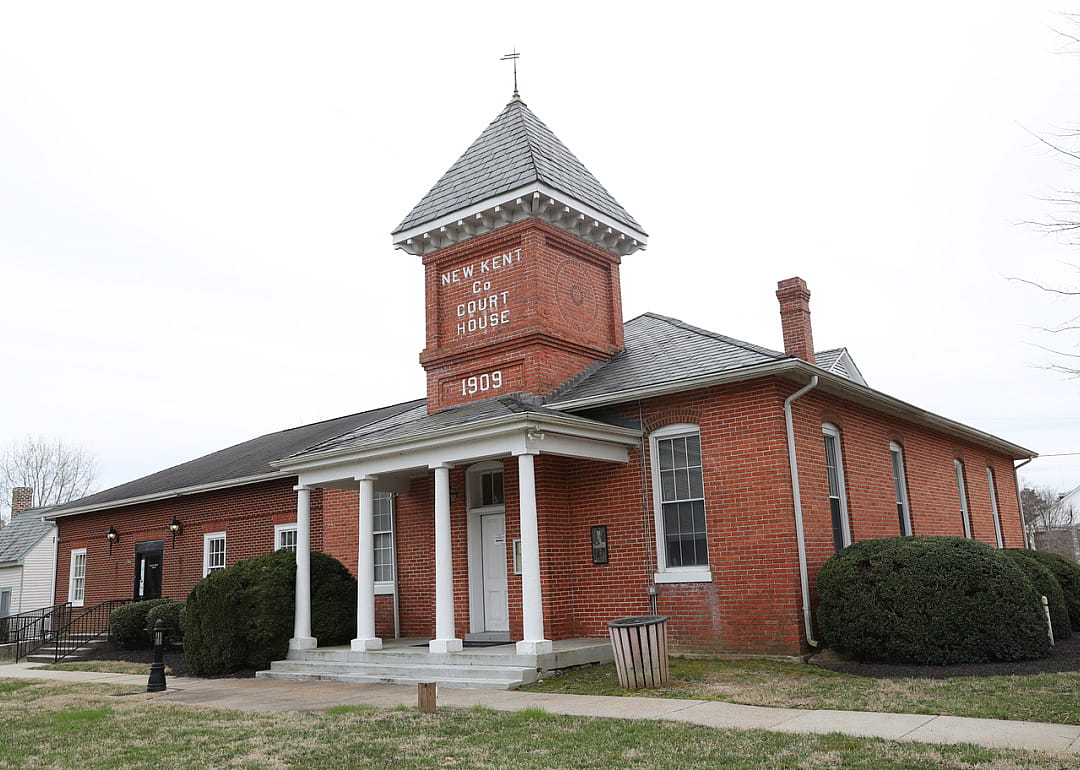
19 / 50#32. New Kent County
- Five-year precipitation average: 53.09 inches
- Precipitation over the past year: 40.93 inches (#44 rainiest year since 1895)
- Precipitation compared to 1901-2000 average: -2.83 inches below norm
#31. Lynchburg City
- Five-year precipitation average: 53.24 inches
- Precipitation over the past year: 45.15 inches (#85 rainiest year since 1895)
- Precipitation compared to 1901-2000 average: 2.76 inches above norm
You may also like: Counties with the highest unemployment in Virginia
Wirestock Creators // Shutterstock
21 / 50#30. Russell County
- Five-year precipitation average: 53.27 inches
- Precipitation over the past year: 49.42 inches (#99 rainiest year since 1895)
- Precipitation compared to 1901-2000 average: 4.87 inches above norm
#29. Pittsylvania County
- Five-year precipitation average: 53.32 inches
- Precipitation over the past year: 45.25 inches (#82 rainiest year since 1895)
- Precipitation compared to 1901-2000 average: 2.19 inches above norm
OJUP // Shutterstock
23 / 50#28. Charles City County
- Five-year precipitation average: 53.49 inches
- Precipitation over the past year: 41.57 inches (#46 rainiest year since 1895)
- Precipitation compared to 1901-2000 average: -1.98 inches below norm
#27. Dickenson County
- Five-year precipitation average: 53.51 inches
- Precipitation over the past year: 47.14 inches (#82 rainiest year since 1895)
- Precipitation compared to 1901-2000 average: 3.16 inches above norm
Nolichuckyjake // Shutterstock
25 / 50#26. Bristol City
- Five-year precipitation average: 53.62 inches
- Precipitation over the past year: 44.98 inches (#61 rainiest year since 1895)
- Precipitation compared to 1901-2000 average: 0.49 inches above norm
You may also like: Most commonly seen birds in Virginia
#25. Washington County
- Five-year precipitation average: 53.67 inches
- Precipitation over the past year: 48.56 inches (#91 rainiest year since 1895)
- Precipitation compared to 1901-2000 average: 3.87 inches above norm
Lekali Studio // Shutterstock
27 / 50#24. Prince George County
- Five-year precipitation average: 53.88 inches
- Precipitation over the past year: 41.60 inches (#45 rainiest year since 1895)
- Precipitation compared to 1901-2000 average: -1.93 inches below norm
Nolichuckyjake // Shutterstock
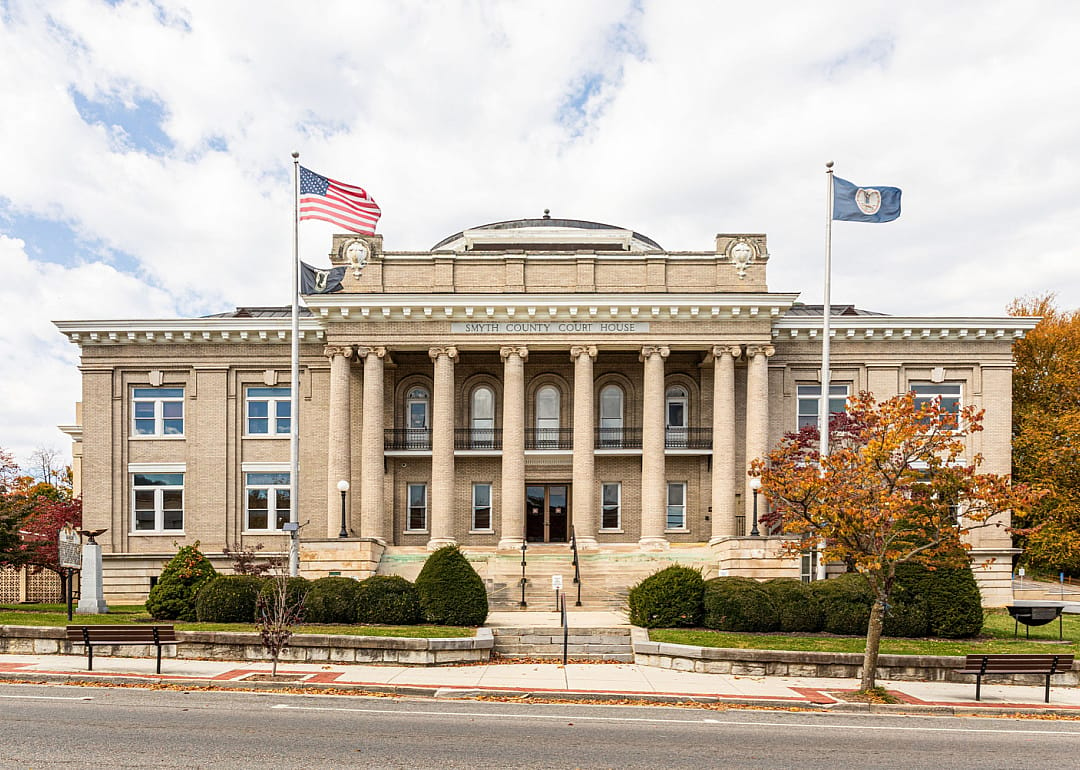
28 / 50#23. Smyth County
- Five-year precipitation average: 54.05 inches
- Precipitation over the past year: 50.07 inches (#101 rainiest year since 1895)
- Precipitation compared to 1901-2000 average: 5.20 inches above norm
#22. James City County
- Five-year precipitation average: 54.11 inches
- Precipitation over the past year: 43.76 inches (#58 rainiest year since 1895)
- Precipitation compared to 1901-2000 average: -0.57 inches below norm
Melinda Fawver // Shutterstock
30 / 50#21. Isle of Wight County
#20. Southampton County
- Five-year precipitation average: 54.36 inches
- Precipitation over the past year: 43.49 inches (#40 rainiest year since 1895)
- Precipitation compared to 1901-2000 average: -2.61 inches below norm
#19. Williamsburg City
- Five-year precipitation average: 54.39 inches
- Precipitation over the past year: 45.08 inches (#67 rainiest year since 1895)
- Precipitation compared to 1901-2000 average: 0.52 inches above norm
#18. Sussex County
- Five-year precipitation average: 54.50 inches
- Precipitation over the past year: 41.89 inches (#40 rainiest year since 1895)
- Precipitation compared to 1901-2000 average: -2.67 inches below norm
Jon Marc Lyttle / Shutterstock
34 / 50#17. Bedford County
- Five-year precipitation average: 54.70 inches
- Precipitation over the past year: 47.92 inches (#98 rainiest year since 1895)
- Precipitation compared to 1901-2000 average: 4.54 inches above norm
#15. Buchanan County
- Five-year precipitation average: 54.80 inches
- Precipitation over the past year: 49.24 inches (#98 rainiest year since 1895)
- Precipitation compared to 1901-2000 average: 4.55 inches above norm
Mfinity SAM // Shutterstock
37 / 50#14. Norton City
- Five-year precipitation average: 54.97 inches
- Precipitation over the past year: 48.27 inches (#73 rainiest year since 1895)
- Precipitation compared to 1901-2000 average: 1.36 inches above norm
#13. Franklin County
- Five-year precipitation average: 55.63 inches
- Precipitation over the past year: 50.08 inches (#113 rainiest year since 1895)
- Precipitation compared to 1901-2000 average: 6.72 inches above norm
#12. Amherst County
- Five-year precipitation average: 55.65 inches
- Precipitation over the past year: 48.51 inches (#93 rainiest year since 1895)
- Precipitation compared to 1901-2000 average: 3.87 inches above norm
#11. Scott County
- Five-year precipitation average: 55.70 inches
- Precipitation over the past year: 46.67 inches (#57 rainiest year since 1895)
- Precipitation compared to 1901-2000 average: -0.37 inches below norm
You may also like: Top 5 uniquely popular potato chip brands in Virginia
Katssoup // Shutterstock
41 / 50#10. Wise County
- Five-year precipitation average: 55.76 inches
- Precipitation over the past year: 49.03 inches (#73 rainiest year since 1895)
- Precipitation compared to 1901-2000 average: 1.54 inches above norm
Timothy L Barnes // Shutterstock
42 / 50#9. Surry County
- Five-year precipitation average: 55.81 inches
- Precipitation over the past year: 44.74 inches (#61 rainiest year since 1895)
- Precipitation compared to 1901-2000 average: 0.23 inches above norm
#8. Floyd County
- Five-year precipitation average: 56.12 inches
- Precipitation over the past year: 51.06 inches (#109 rainiest year since 1895)
- Precipitation compared to 1901-2000 average: 5.98 inches above norm
Nolichuckyjake // Shutterstock
44 / 50#7. Galax City
- Five-year precipitation average: 56.39 inches
- Precipitation over the past year: 48.44 inches (#88 rainiest year since 1895)
- Precipitation compared to 1901-2000 average: 4.10 inches above norm
#6. Grayson County
- Five-year precipitation average: 57.13 inches
- Precipitation over the past year: 47.88 inches (#78 rainiest year since 1895)
- Precipitation compared to 1901-2000 average: 2.34 inches above norm
You may also like: How Virginia ranks for most motorcycle fatalities
grandbrothers // Shutterstock
46 / 50#5. Henry County
- Five-year precipitation average: 57.63 inches
- Precipitation over the past year: 54.12 inches (#118 rainiest year since 1895)
- Precipitation compared to 1901-2000 average: 9.04 inches above norm
#4. Martinsville City
- Five-year precipitation average: 57.93 inches
- Precipitation over the past year: 55.70 inches (#118 rainiest year since 1895)
- Precipitation compared to 1901-2000 average: 10.87 inches above norm
Jon Bilous // Shutterstock
48 / 50#3. Carroll County
- Five-year precipitation average: 58.47 inches
- Precipitation over the past year: 54.07 inches (#114 rainiest year since 1895)
- Precipitation compared to 1901-2000 average: 8.24 inches above norm
Jeffery L Willis // Shutterstock
49 / 50#2. Lee County
- Five-year precipitation average: 59.40 inches
- Precipitation over the past year: 50.65 inches (#62 rainiest year since 1895)
- Precipitation compared to 1901-2000 average: 0.36 inches above norm