
Gorodenkoff // Shutterstock
1 / 50#50. Medical scientists, except epidemiologists
- Median annual wage: $112,120
- Median hourly wage: $53.90
- Total employment: 5,830 people (1.87 of every 1,000 jobs in the area)

Earning top dollar typically requires more education than an undergraduate degree can provide. Doctors, lawyers, and professors need extra years of focused study for their chosen fields, but they're not alone. Graduate degrees in fields like business, teaching, and public health build specialized knowledge that can fast-track a career—and one's salary.
Many hiring managers view a master's degree as the equivalent of two years of work experience, giving graduate degree holders a leg up. In 2024, master's degree holders earned a weekly median of $1,840, a 19% premium over undergraduate degree holders. Doctorates earned $2,278, and professional degree holders earned $2,363.
Stacker used Bureau of Labor Statistics data to find the highest-paying jobs in Washington, D.C. that require a graduate degree in Washington, D.C.. This includes doctorates, master's degrees, and professional degrees. Jobs are ranked by their median annual pay as of May 2024, so any jobs without annual compensation figures available were excluded from this analysis.
Job security is another benefit. The unemployment rate for a master's degree holder is 2.2%, compared to 2.5% for undergraduate degree holders. Doctorates and professional degree holders' unemployment rate is close to 1%.
Employers believe a graduate degree showcases an employee's drive and commitment, but that comes at a price. Between 2000 and 2020, median annual tuition and fees for graduate degree programs increased by 233%. Unsurprisingly, median student debt has also increased, rising 47% to $50,000.
Depending on the career field, some prospective students may find it difficult to justify the expense. Georgetown University's Center on Education and the Workforce found that full-time workers in STEM fields earned $128,000 annually, almost twice as much as their degreed counterparts in humanities and the arts. A graduate degree in humanities also only brought a 10% earnings premium over someone with a bachelor's degree.
You may also like: How gas prices have changed in Washington, D.C. in the last week
Gorodenkoff // Shutterstock
1 / 50- Median annual wage: $112,120
- Median hourly wage: $53.90
- Total employment: 5,830 people (1.87 of every 1,000 jobs in the area)

wavebreakmedia // Shutterstock
2 / 50- Median annual wage: $112,880
- Median hourly wage: $54.27
- Total employment: 730 people (0.23 of every 1,000 jobs in the area)

Agenturfotografin // Shutterstock
3 / 50- Median annual wage: $115,710
- Median hourly wage: $55.63
- Total employment: 420 people (0.14 of every 1,000 jobs in the area)
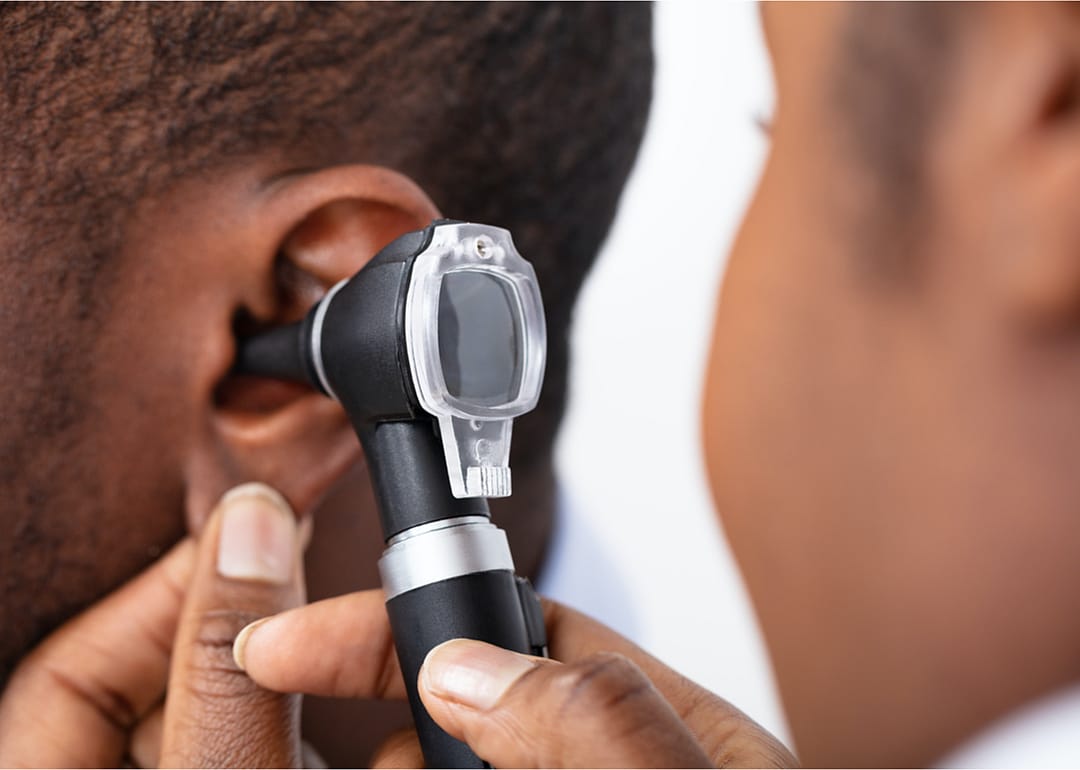
Andrey_Popov // Shutterstock
4 / 50- Median annual wage: $118,250
- Median hourly wage: $56.85
- Total employment: 180 people (0.06 of every 1,000 jobs in the area)

GagliardiPhotography // Shutterstock
5 / 50- Median annual wage: $120,220
- Median hourly wage: Not available
- Total employment: 90 people (0.03 of every 1,000 jobs in the area)
You may also like: Biggest cities in District of Columbia 150 years ago

GaudiLab // Shutterstock
6 / 50- Median annual wage: $123,370
- Median hourly wage: Not available
- Total employment: 650 people (0.21 of every 1,000 jobs in the area)

Matej Kastelic // Shutterstock
7 / 50- Median annual wage: $123,620
- Median hourly wage: Not available
- Total employment: 1,910 people (0.61 of every 1,000 jobs in the area)

Thanakorn.P // Shutterstock
8 / 50- Median annual wage: $125,050
- Median hourly wage: Not available
- Total employment: 130 people (0.04 of every 1,000 jobs in the area)

Jacob Lund // Shutterstock
9 / 50- Median annual wage: $126,620
- Median hourly wage: $60.88
- Total employment: 4,100 people (1.32 of every 1,000 jobs in the area)

Jacob Lund // Shutterstock
10 / 50- Median annual wage: $128,270
- Median hourly wage: Not available
- Total employment: 2,950 people (0.95 of every 1,000 jobs in the area)
You may also like: Highest-rated Class of 2026 men's basketball recruits from Washington, D.C.

Ground Picture // Shutterstock
11 / 50- Median annual wage: $128,490
- Median hourly wage: Not available
- Total employment: 760 people (0.24 of every 1,000 jobs in the area)

Zivica Kerkez // Shutterstock
12 / 50- Median annual wage: $129,920
- Median hourly wage: $62.46
- Total employment: 1,530 people (0.49 of every 1,000 jobs in the area)

Monkey Business Images // Shutterstock
13 / 50- Median annual wage: $129,920
- Median hourly wage: $62.46
- Total employment: 4,430 people (1.42 of every 1,000 jobs in the area)

Pheelings media // Shutterstock
14 / 50- Median annual wage: $133,240
- Median hourly wage: $64.06
- Total employment: 3,490 people (1.12 of every 1,000 jobs in the area)

Krakenimages.com // Shutterstock
15 / 50- Median annual wage: $133,720
- Median hourly wage: Not available
- Total employment: 6,950 people (2.23 of every 1,000 jobs in the area)
You may also like: Highest-rated Cajun restaurants in Washington, D.C. by diners

Stokkete // Shutterstock
16 / 50- Median annual wage: $137,650
- Median hourly wage: $66.18
- Total employment: 2,840 people (0.91 of every 1,000 jobs in the area)

antoniodiaz // Shutterstock
17 / 50- Median annual wage: $139,770
- Median hourly wage: $67.20
- Total employment: 320 people (0.1 of every 1,000 jobs in the area)

Drazen Zigic // Shutterstock
18 / 50- Median annual wage: $143,890
- Median hourly wage: $69.18
- Total employment: 4,870 people (1.56 of every 1,000 jobs in the area)

Elnur // Shutterstock
19 / 50- Median annual wage: $145,560
- Median hourly wage: $69.98
- Total employment: Not available

Worawee Meepian // Shutterstock
20 / 50- Median annual wage: $153,320
- Median hourly wage: $73.71
- Total employment: 650 people (0.21 of every 1,000 jobs in the area)
You may also like: Best high schools in the Washington, D.C. metro area

Desizned // Shutterstock
21 / 50- Median annual wage: $153,340
- Median hourly wage: $73.72
- Total employment: 3,910 people (1.25 of every 1,000 jobs in the area)

Syda Productions // Shutterstock
22 / 50- Median annual wage: $155,870
- Median hourly wage: Not available
- Total employment: 320 people (0.1 of every 1,000 jobs in the area)

Gorodenkoff // Shutterstock
23 / 50- Median annual wage: $156,360
- Median hourly wage: $75.17
- Total employment: 3,150 people (1.01 of every 1,000 jobs in the area)

Petekub // Shutterstock
24 / 50- Median annual wage: $157,980
- Median hourly wage: $75.95
- Total employment: 4,300 people (1.38 of every 1,000 jobs in the area)
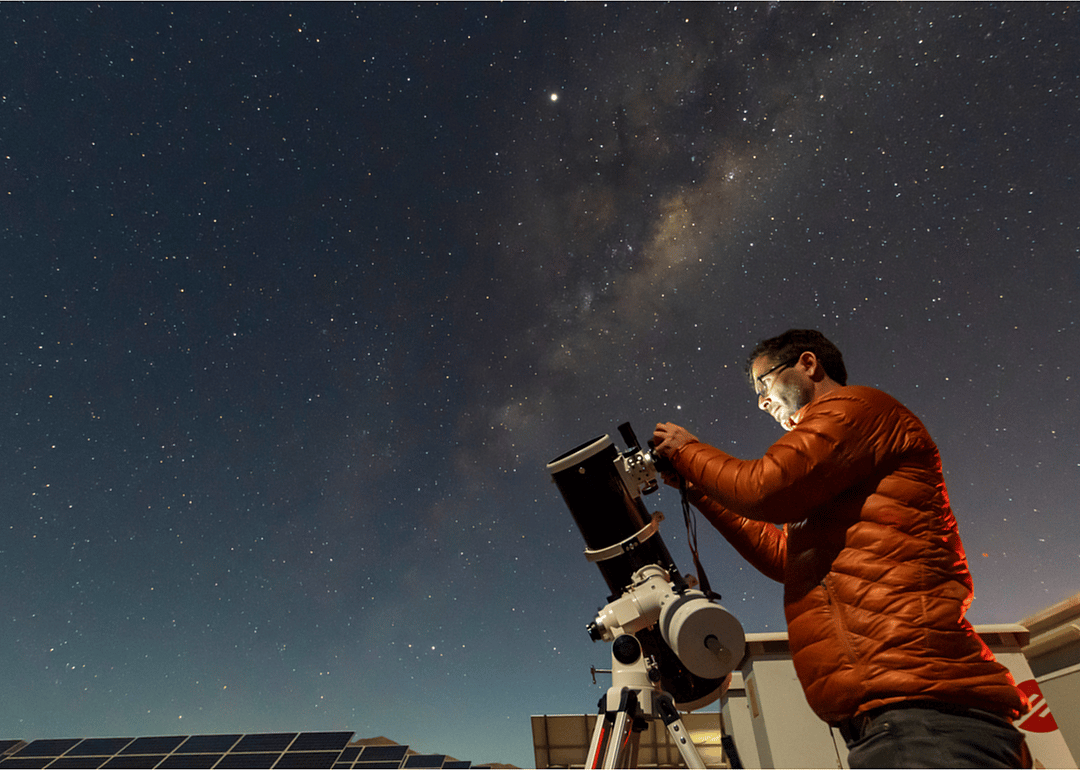
abriendomundo // Shutterstock
25 / 50- Median annual wage: $157,980
- Median hourly wage: $75.95
- Total employment: 440 people (0.14 of every 1,000 jobs in the area)
You may also like: See how popular pumpkin spice is in Washington, D.C.

Kenishirotie //Shutterstock
26 / 50- Median annual wage: $160,510
- Median hourly wage: $77.17
- Total employment: 220 people (0.07 of every 1,000 jobs in the area)

BlurryMe // Shutterstock
27 / 50- Median annual wage: $162,610
- Median hourly wage: $78.18
- Total employment: 6,330 people (2.03 of every 1,000 jobs in the area)

Sebastian Duda // Shutterstock
28 / 50- Median annual wage: $163,190
- Median hourly wage: $78.46
- Total employment: Not available
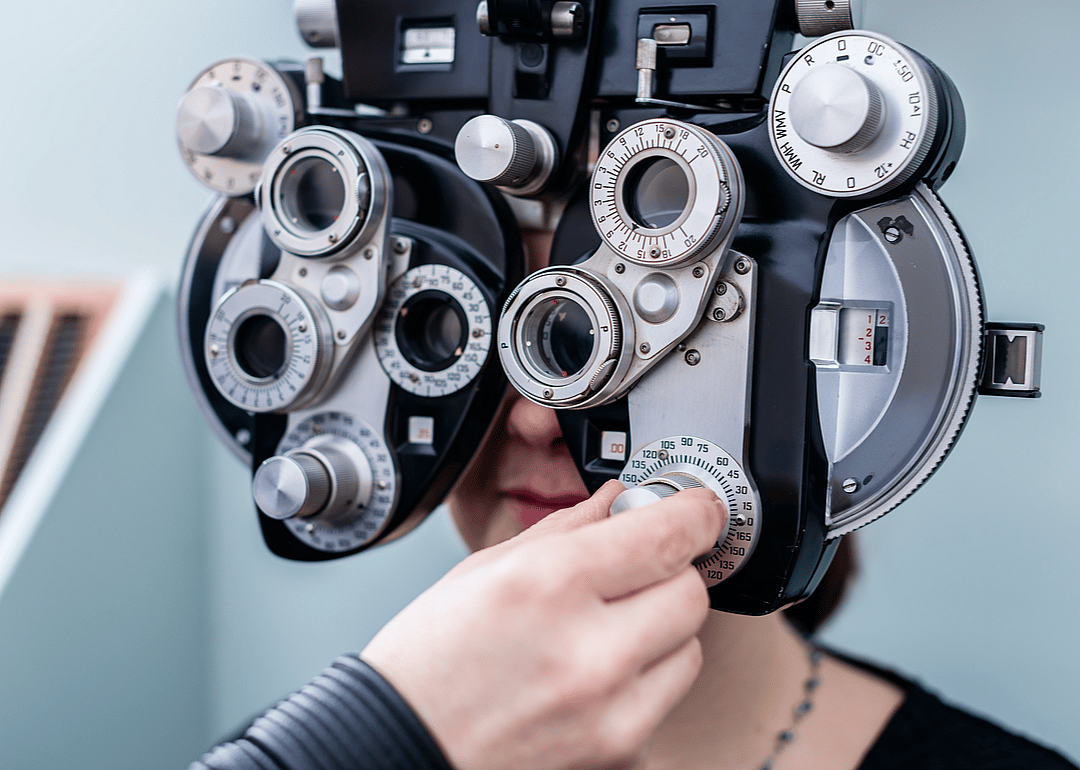
Kzenon // Shutterstock
29 / 50- Median annual wage: $163,320
- Median hourly wage: $78.52
- Total employment: 720 people (0.23 of every 1,000 jobs in the area)

luchschenF // Shutterstock
30 / 50- Median annual wage: $168,280
- Median hourly wage: $80.90
- Total employment: 1,940 people (0.62 of every 1,000 jobs in the area)
You may also like: Is it cheaper to buy or rent in Washington, D.C. in 2026?

Prostock-studio // Shutterstock
31 / 50- Median annual wage: $176,800
- Median hourly wage: $85.00
- Total employment: 3,110 people (1.0 of every 1,000 jobs in the area)

Jacob Lund // Shutterstock
32 / 50- Median annual wage: $186,990
- Median hourly wage: $89.90
- Total employment: 840 people (0.27 of every 1,000 jobs in the area)

wutzkohphoto // Shutterstock
33 / 50- Median annual wage: $191,880
- Median hourly wage: $92.25
- Total employment: 11,170 people (3.58 of every 1,000 jobs in the area)

Nicola Forenza // Shutterstock
34 / 50- Median annual wage: $191,880
- Median hourly wage: $92.25
- Total employment: 48,170 people (15.45 of every 1,000 jobs in the area)

Prostock-studio // Shutterstock
35 / 50- Median annual wage: $199,990
- Median hourly wage: $96.15
- Total employment: 150 people (0.05 of every 1,000 jobs in the area)
You may also like: Biggest sources of immigrants to Washington, D.C.

4 PM production // Shutterstock
36 / 50- Median annual wage: $218,490
- Median hourly wage: $105.04
- Total employment: 230 people (0.07 of every 1,000 jobs in the area)

LightField Studios // Shutterstock
37 / 50- Median annual wage: $219,970
- Median hourly wage: $105.76
- Total employment: 570 people (0.18 of every 1,000 jobs in the area)

BlurryMe // Shutterstock
38 / 50- Median annual wage: $223,030
- Median hourly wage: $107.22
- Total employment: 1,740 people (0.56 of every 1,000 jobs in the area)

PeopleImages.com - Yuri A // Shutterstock
39 / 50- Median annual wage: $224,330
- Median hourly wage: $107.85
- Total employment: 1,900 people (0.61 of every 1,000 jobs in the area)

LightField Studios // Shutterstock
40 / 50- Median annual wage: $225,340
- Median hourly wage: $108.34
- Total employment: 390 people (0.12 of every 1,000 jobs in the area)
You may also like: Washington, D.C.'s 2025 housing market year in review

Komsan Loonprom // Shutterstock
41 / 50- Median annual wage: At least $239,200
- Median hourly wage: At least $115.00
- Total employment: Not available

Dmytro Zinkevych // Shutterstock
42 / 50- Median annual wage: At least $239,200
- Median hourly wage: At least $115.00
- Total employment: 250 people (0.08 of every 1,000 jobs in the area)

Jacob Lund // Shutterstock
43 / 50- Median annual wage: At least $239,200
- Median hourly wage: At least $115.00
- Total employment: 340 people (0.11 of every 1,000 jobs in the area)

Photoroyalty // Shutterstock
44 / 50- Median annual wage: At least $239,200
- Median hourly wage: At least $115.00
- Total employment: 250 people (0.08 of every 1,000 jobs in the area)

Djols // Shutterstock
45 / 50- Median annual wage: At least $239,200
- Median hourly wage: At least $115.00
- Total employment: 1,060 people (0.34 of every 1,000 jobs in the area)
You may also like: Highest-rated Southern restaurants in Washington, D.C. by diners

Roman Zaiets // Shutterstock
46 / 50- Median annual wage: At least $239,200
- Median hourly wage: At least $115.00
- Total employment: Not available

Roman Zaiets // Shutterstock
47 / 50- Median annual wage: At least $239,200
- Median hourly wage: At least $115.00
- Total employment: 270 people (0.09 of every 1,000 jobs in the area)

Natee K Jindakum // Shutterstock
48 / 50- Median annual wage: At least $239,200
- Median hourly wage: At least $115.00
- Total employment: 130 people (0.04 of every 1,000 jobs in the area)
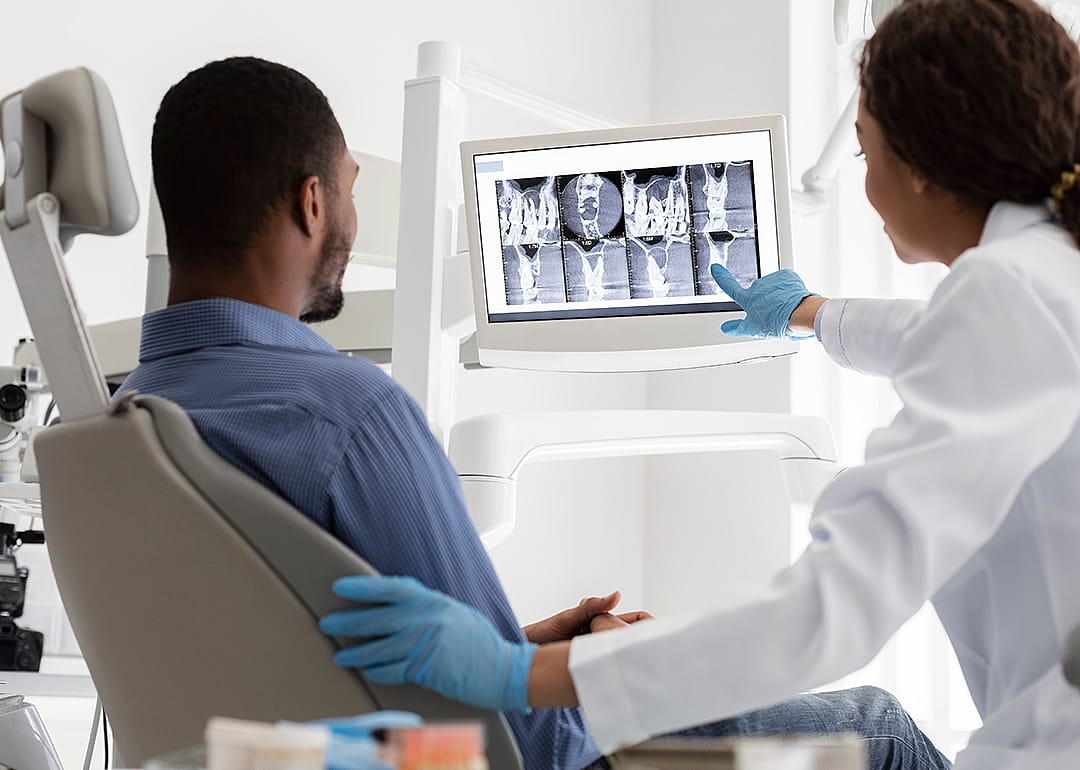
Prostock-studio // Shutterstock
49 / 50- Median annual wage: At least $239,200
- Median hourly wage: At least $115.00
- Total employment: 210 people (0.07 of every 1,000 jobs in the area)

Monkey Business Images // Shutterstock
50 / 50- Median annual wage: At least $239,200
- Median hourly wage: At least $115.00
- Total employment: 300 people (0.1 of every 1,000 jobs in the area)
This story features data reporting by Wade Zhou, writing by Jill Jaracz, and is part of a series utilizing data automation across 363 metros.
You may also like: Best private K-12 schools in the Washington, D.C. metro area



