Canva
1 / 10#10. Cincinnati, OH
- View share: 1.3%
- Median listing price: $383,367
- Listings as of July 2023: 2,252
- Median listing price per square foot: $180

The COVID-19 pandemic ushered in a period of frantic, domestic migration that saw Americans moving farther away from established urban centers.
The number of homes sold every month has slowed as interest rates have risen, cooling some of those pandemic trends. But many Americans are still choosing to move long distances, and the vast majority of U.S. homebuyers (97%) utilize online sites when looking for their next home, according to a 2021 report from the National Association of Realtors.
Stacker compiled statistics about where people in Washington, D.C. are looking to buy homes using cross-market demand and monthly inventory data from Realtor.com. Data is based on micropolitan and metropolitan areas, which include cities as well as surrounding towns and suburbs. Cross-market demand statistics are as of the second quarter of 2023. Monthly inventory data is as of July 2023.
Continue reading to see where people in Washington, D.C. are shopping for their next house.
You may also like: Highest-paying computer and engineering jobs in Washington, D.C.
Canva
1 / 10- View share: 1.3%
- Median listing price: $383,367
- Listings as of July 2023: 2,252
- Median listing price per square foot: $180

Thiago Leite // Shutterstock
2 / 10- View share: 1.4%
- Median listing price: $737,500
- Listings as of July 2023: 33,112
- Median listing price per square foot: $497

Sean Pavone // Shutterstock
3 / 10- View share: 1.5%
- Median listing price: $399,000
- Listings as of July 2023: 2,266
- Median listing price per square foot: $197

Erin Cadigan // Shutterstock
4 / 10- View share: 1.5%
- Median listing price: $439,000
- Listings as of July 2023: 1,597
- Median listing price per square foot: $214

Andrew J Simcox // Shutterstock
5 / 10- View share: 1.6%
- Median listing price: $350,000
- Listings as of July 2023: 8,348
- Median listing price per square foot: $213
You may also like: Biggest sources of immigrants to Washington, D.C.
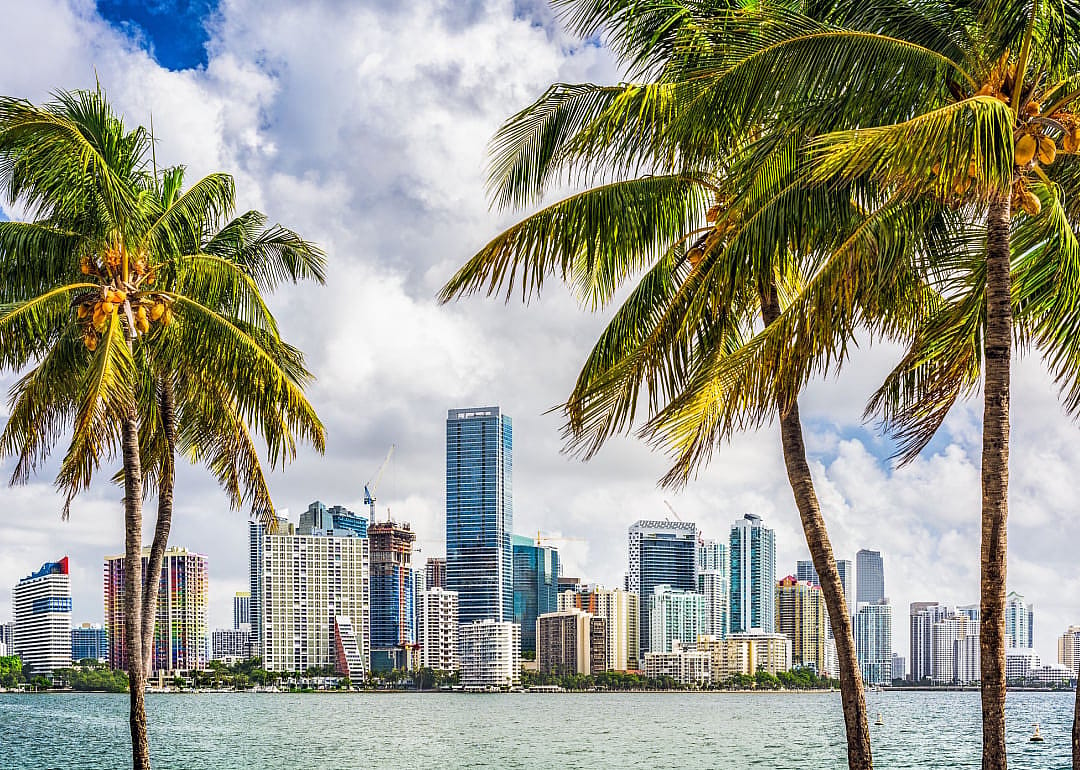
Sean Pavone // Shutterstock
6 / 10- View share: 1.8%
- Median listing price: $601,990
- Listings as of July 2023: 22,403
- Median listing price per square foot: $410
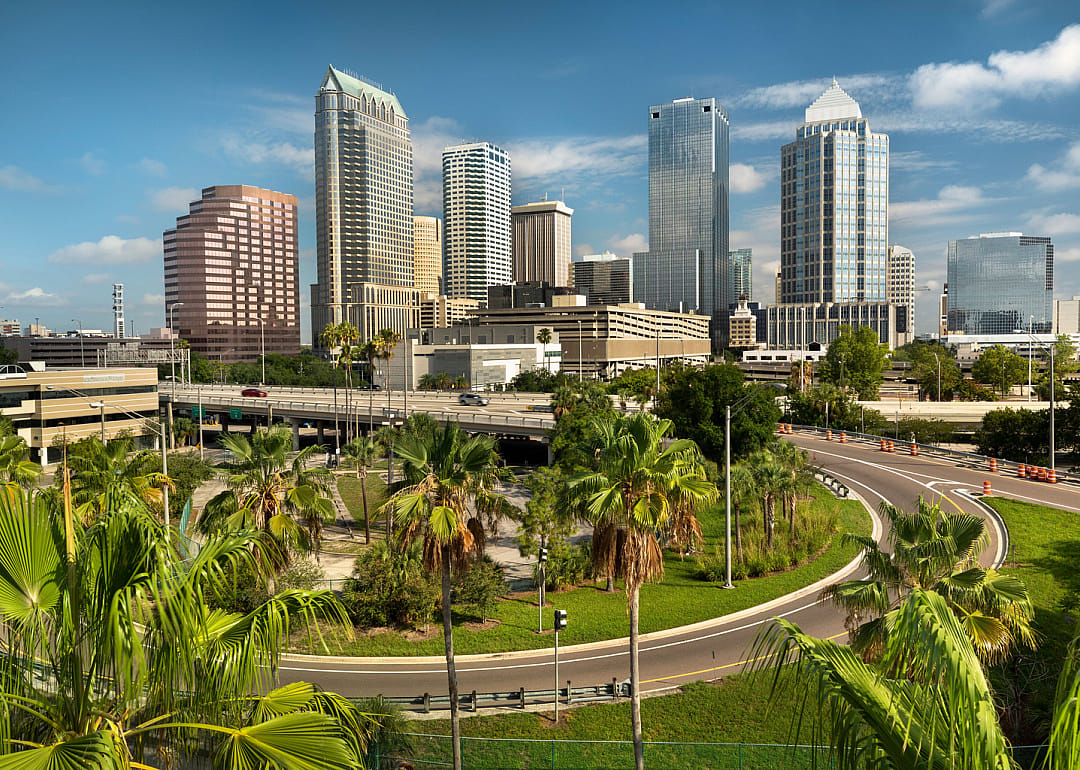
AevanStock // Shutterstock
7 / 10- View share: 1.8%
- Median listing price: $449,000
- Listings as of July 2023: 8,341
- Median listing price per square foot: $260
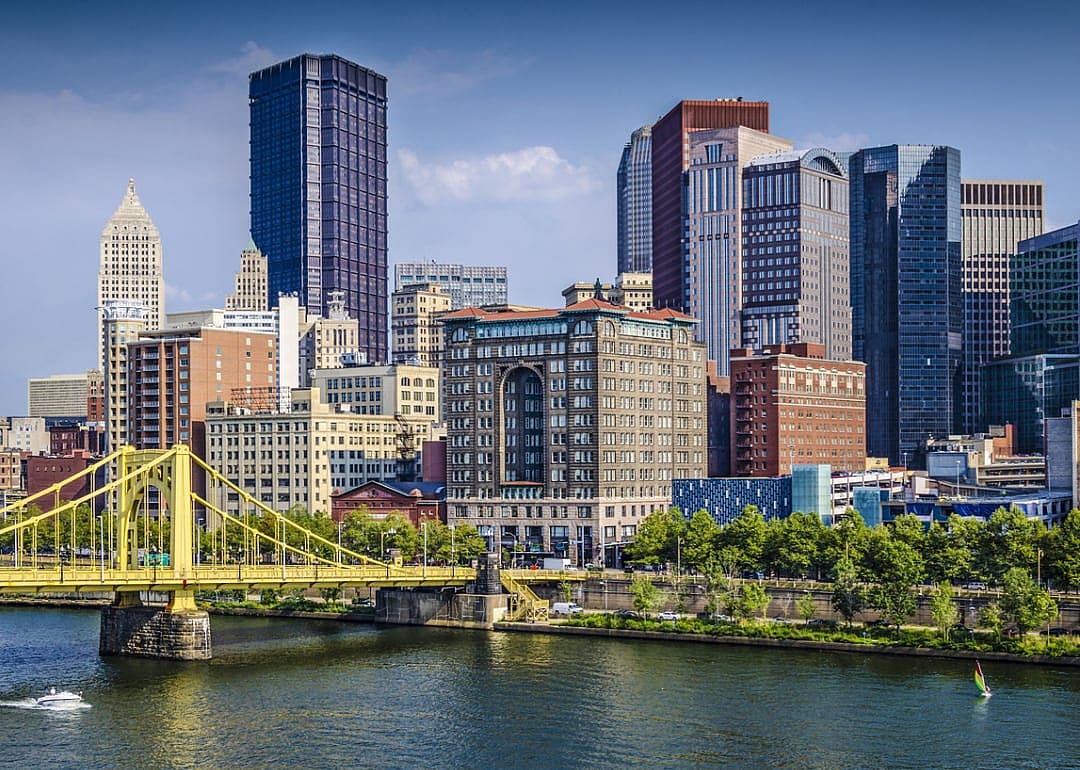
ESB Professional // Shutterstock
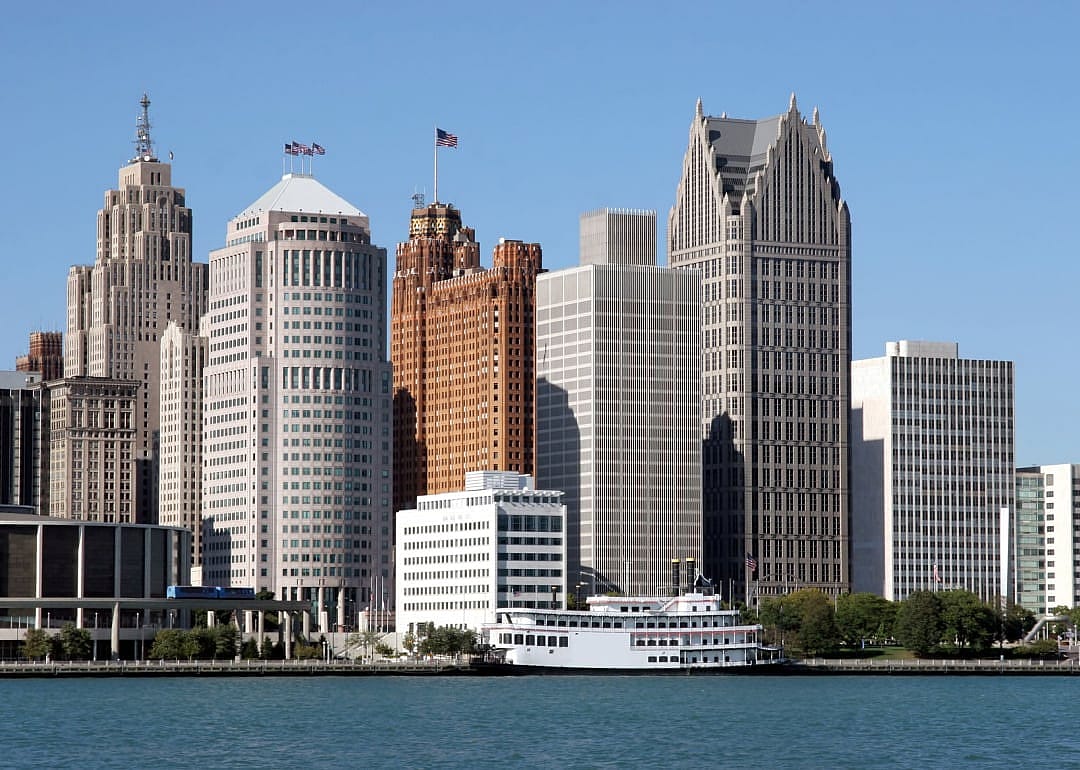
8 / 10- View share: 1.9%
- Median listing price: $249,000
- Listings as of July 2023: 3,672
- Median listing price per square foot: $156
Vladimir Mucibabic // Shutterstock
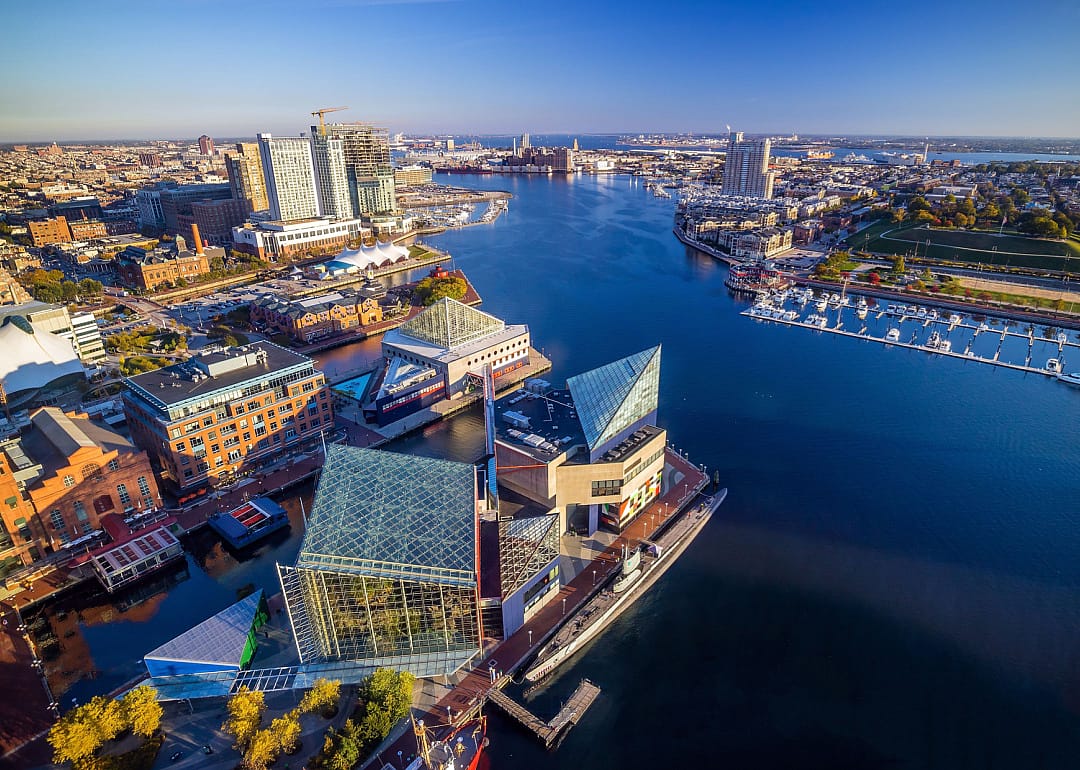
9 / 10- View share: 2.0%
- Median listing price: $269,000
- Listings as of July 2023: 6,991
- Median listing price per square foot: $176
f11photo // Shutterstock
10 / 10- View share: 3.9%
- Median listing price: $374,900
- Listings as of July 2023: 3,412
- Median listing price per square foot: $213
You may also like: Most expensive homes for sale in Washington, D.C.