Stacker
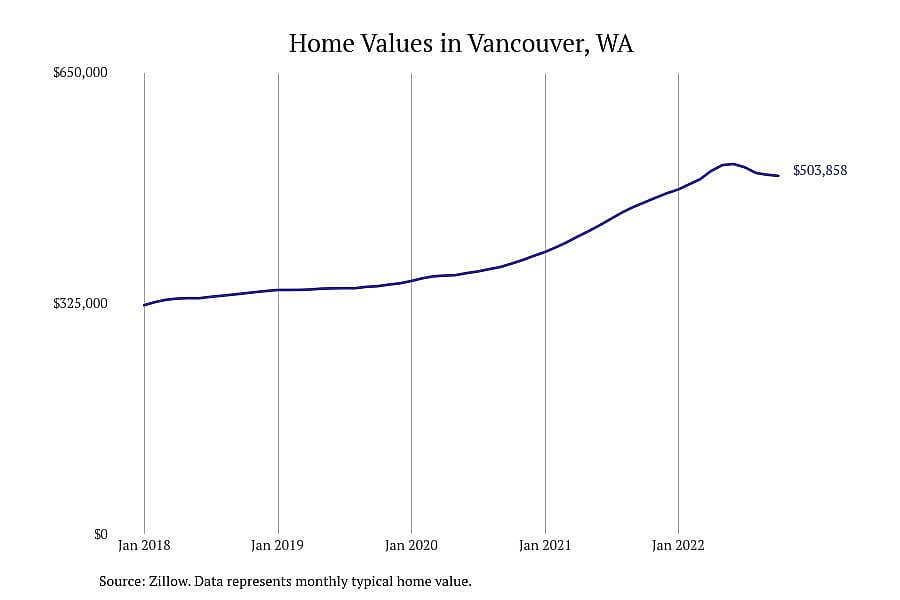
1 / 8#8. Vancouver, WA
- 1-year price change: +7.9% (+$37,106)
- 5-year price change: +61.4%
- Typical home value: $503,858

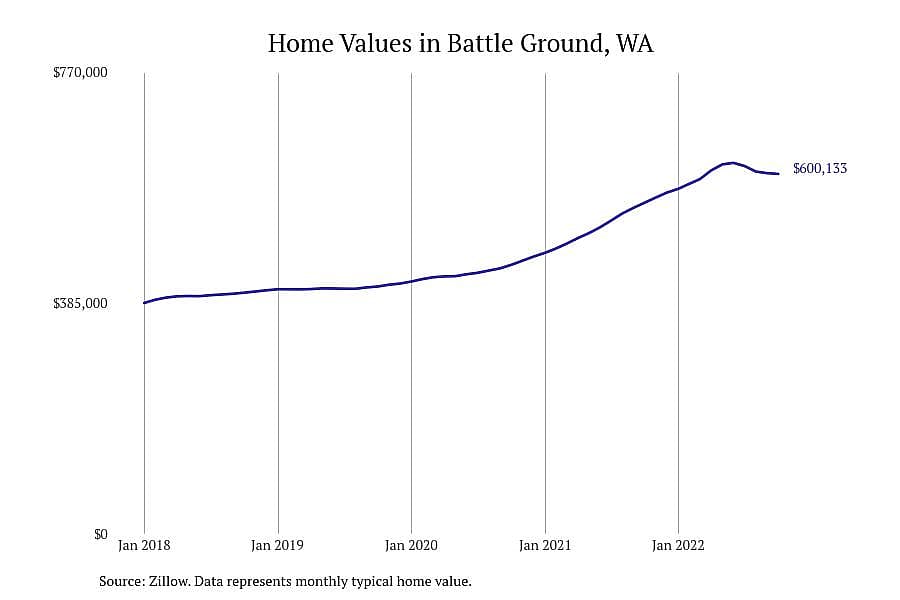
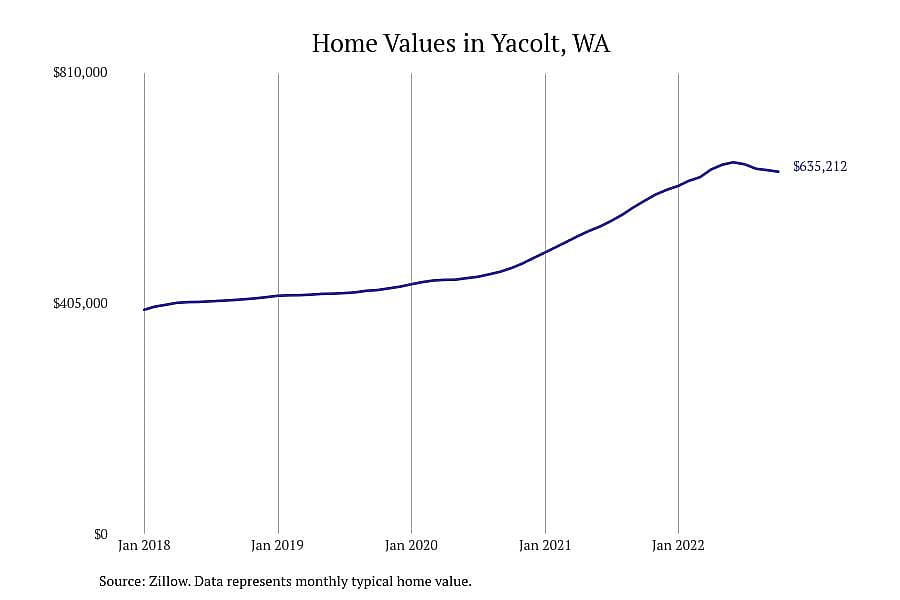
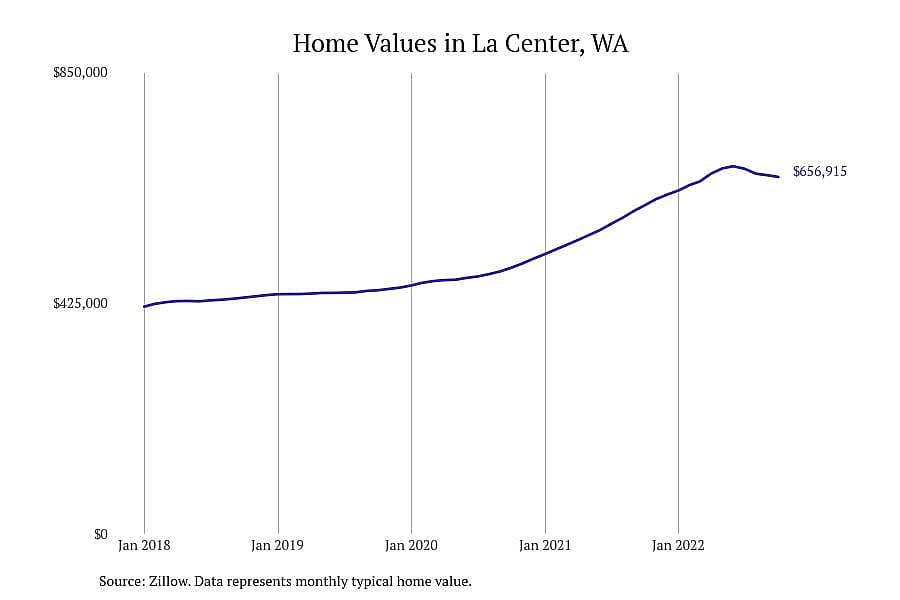
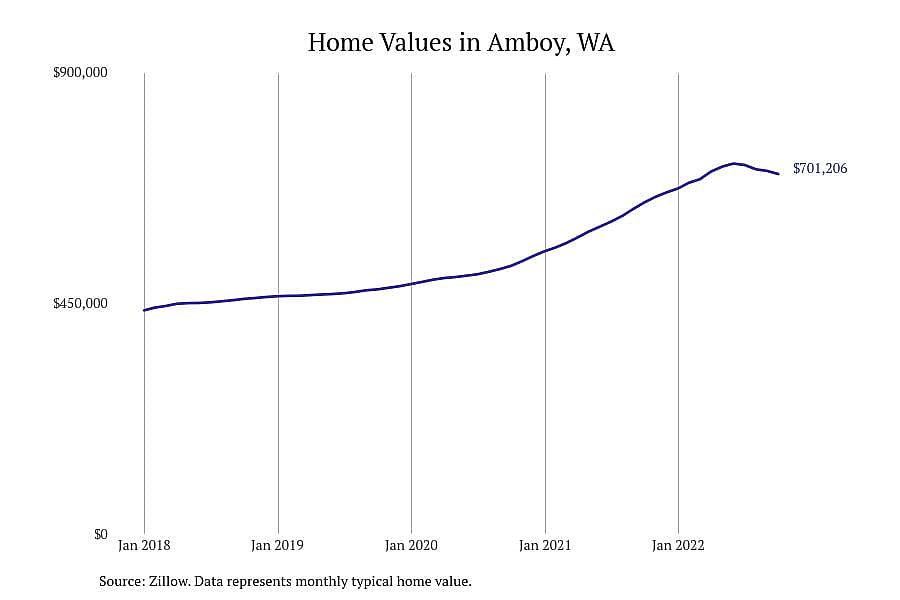
Stacker compiled a list of places with the fastest growing home prices in Clark County, WA using data from Zillow. Places are ranked by the dollar change Zillow Home Values Index for all homes from October 2021 to October 2022. The ZVHI represents a seasonally adjusted price for the middle market for all homes. All 8 cities and towns with data available were included in the list. Charts for each place show the monthly typical home value since January 2018.
You may also like: Here's how many people are behind on debt payments in Clark County, Washington
Stacker
1 / 8- 1-year price change: +7.9% (+$37,106)
- 5-year price change: +61.4%
- Typical home value: $503,858
Stacker
2 / 8- 1-year price change: +8.7% (+$47,818)
- 5-year price change: +60.8%
- Typical home value: $600,133
Stacker
3 / 8- 1-year price change: +8.7% (+$50,762)
- 5-year price change: +65.8%
- Typical home value: $635,212
Stacker
4 / 8- 1-year price change: +8.6% (+$52,097)
- 5-year price change: +61.1%
- Typical home value: $656,915
Stacker
5 / 8- 1-year price change: +8.5% (+$54,788)
- 5-year price change: +65.0%
- Typical home value: $701,206
You may also like: Food insecurity rates in Clark County, WA
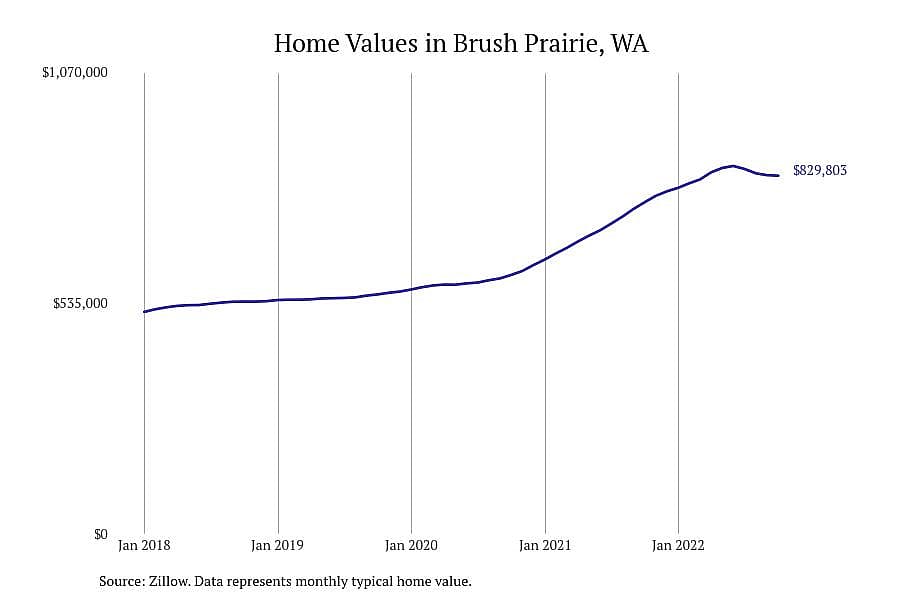
Stacker
6 / 8- 1-year price change: +8.0% (+$61,190)
- 5-year price change: +65.8%
- Typical home value: $829,803
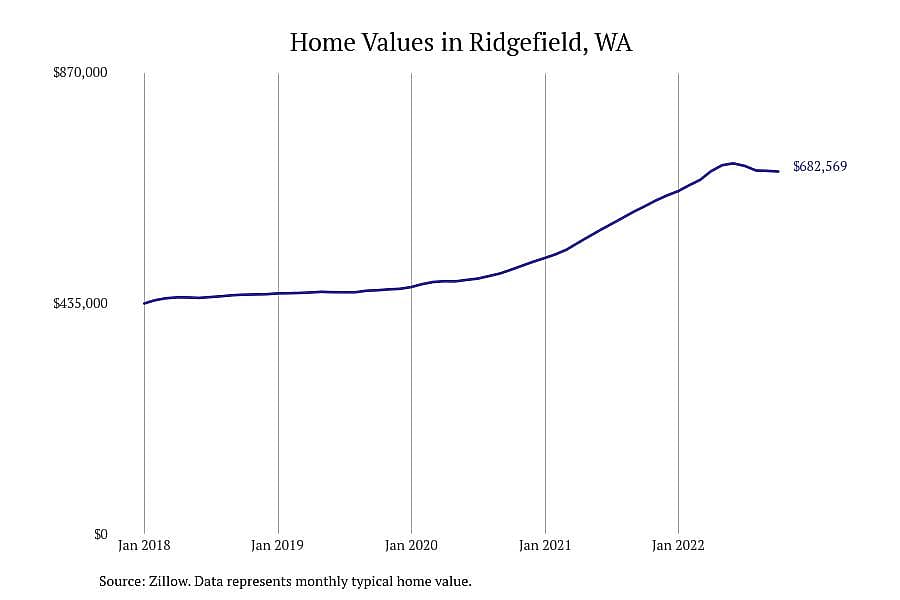
Stacker
7 / 8- 1-year price change: +10.6% (+$65,289)
- 5-year price change: +61.4%
- Typical home value: $682,569
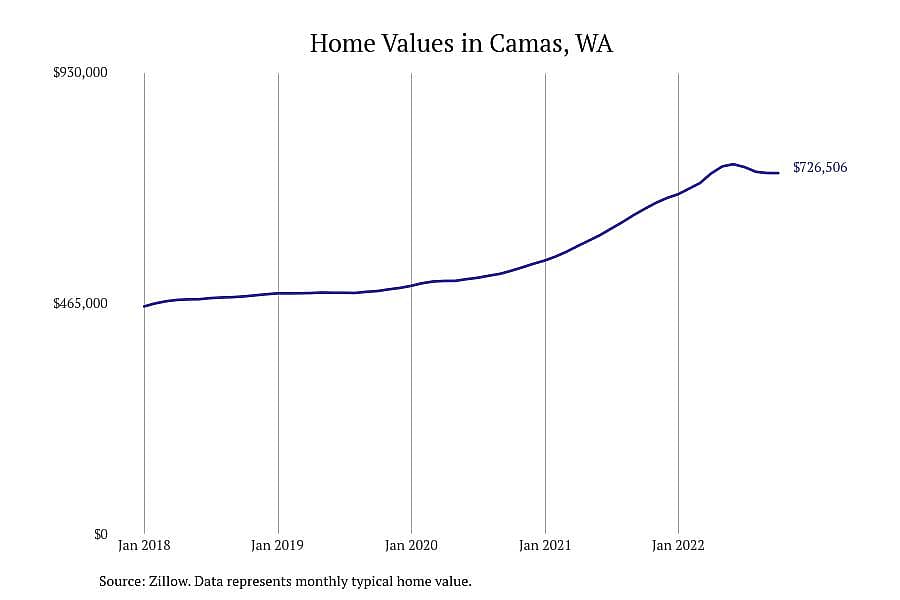
Stacker
8 / 8- 1-year price change: +11.0% (+$71,903)
- 5-year price change: +63.0%
- Typical home value: $726,506