
Canva
1 / 39#39. Mason County
- Total small business establishments: 1,062 (15.8 per 1,000 residents)
- Share of establishments that are small: 99.7%
- 2021 population: 67,229

In 2021, the IRS received a whopping 5.4 million business applications—an all-time high since the U.S. government began tracking this data in 2004. The year with the second-highest number of new business applications? 2020. Today, small businesses employ nearly half of the nation's workers, according to a Chamber of Commerce report.
It's fair to say that the past few years have been banner years for small businesses, but what about regional differences? The business climate in a small town in Texas is likely not the same as a small town in Connecticut. The Chamber of Commerce report found that the Midwest was the most business-friendly region, thanks to the relatively low cost of living, well-educated workforce, and regulations lowering taxes and easing zoning restrictions for businesses.
Of course, the East and West coasts also have plenty to offer, from California's Silicon Valley and Hollywood studios to New York's financial hub to Massachusetts' prominence in the aerospace, defense, and information technology industries. A few states—including Delaware, Wyoming, and Nevada—even allow you to incorporate your business within their borders without ever setting foot there.
For even more specific data, let's take it a step further by analyzing counties. Are certain counties more friendly to small businesses than others? To pinpoint the areas where small businesses abound, altLINE used Census Bureau data to find the counties in Washington with the highest concentration of small businesses in 2021, calculated as small establishments per 1,000 residents. Small establishments are defined as those with fewer than 500 employees. Counties with fewer than 1,000 residents were excluded from the analysis, as well as counties for which the Census Bureau didn't have population estimates.
Another important factor to consider: States where nonresidents are allowed to incorporate businesses will also have a higher ratio of small businesses to residents since not all small businesses are actually operated by people living in that state.
Taking a close look at the type of counties that topped the list in each state also reveals some interesting trends. World-class vacation destinations are well represented on the lists of each state, perhaps because tourists are looking to get a sense of how the locals live through small businesses like restaurants, bakeries, bars, and boutiques.
While the top counties in each state do include a few major cities, less populated counties with smaller towns are much more common. Although most of the nation's small businesses are located in major metropolitan areas, those that are located in rural areas tend to be more stable—possibly due to loyalty from local residents or the absence of competition from large corporations.
Keep reading to discover the counties in Washington with the highest concentration of small businesses, and see how it compares across 50 states. It just might give you inspiration for your next endeavor.
This story features data reporting by Paxtyn Merten, writing by Annalise Mantz, and is part of a series utilizing data automation across 50 states.
Canva
1 / 39- Total small business establishments: 1,062 (15.8 per 1,000 residents)
- Share of establishments that are small: 99.7%
- 2021 population: 67,229

Canva
2 / 39- Total small business establishments: 200 (16.4 per 1,000 residents)
- Share of establishments that are small: 98.5%
- 2021 population: 12,207

Canva
3 / 39- Total small business establishments: 239 (17.2 per 1,000 residents)
- Share of establishments that are small: 99.2%
- 2021 population: 13,906

Canva
4 / 39- Total small business establishments: 82 (17.9 per 1,000 residents)
- Share of establishments that are small: 96.5%
- 2021 population: 4,579

Arpad Jasko // Shutterstock
5 / 39- Total small business establishments: 377 (18.3 per 1,000 residents)
- Share of establishments that are small: 100.0%
- 2021 population: 20,640

Canva
6 / 39- Total small business establishments: 43 (18.3 per 1,000 residents)
- Share of establishments that are small: 95.6%
- 2021 population: 2,354

Canva
7 / 39- Total small business establishments: 808 (18.4 per 1,000 residents)
- Share of establishments that are small: 100.0%
- 2021 population: 43,838
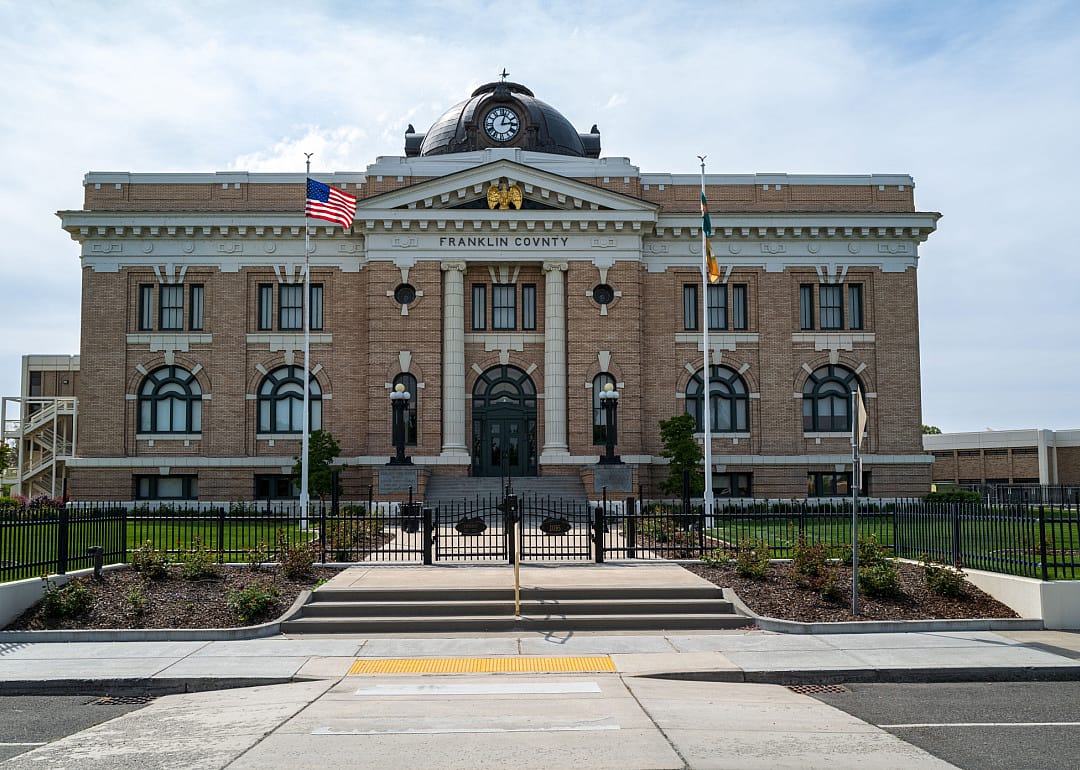
davidrh // Shutterstock
8 / 39- Total small business establishments: 1,830 (18.7 per 1,000 residents)
- Share of establishments that are small: 99.9%
- 2021 population: 98,126

kathmanduphotog // Shutterstock
9 / 39- Total small business establishments: 137 (18.9 per 1,000 residents)
- Share of establishments that are small: 97.9%
- 2021 population: 7,267
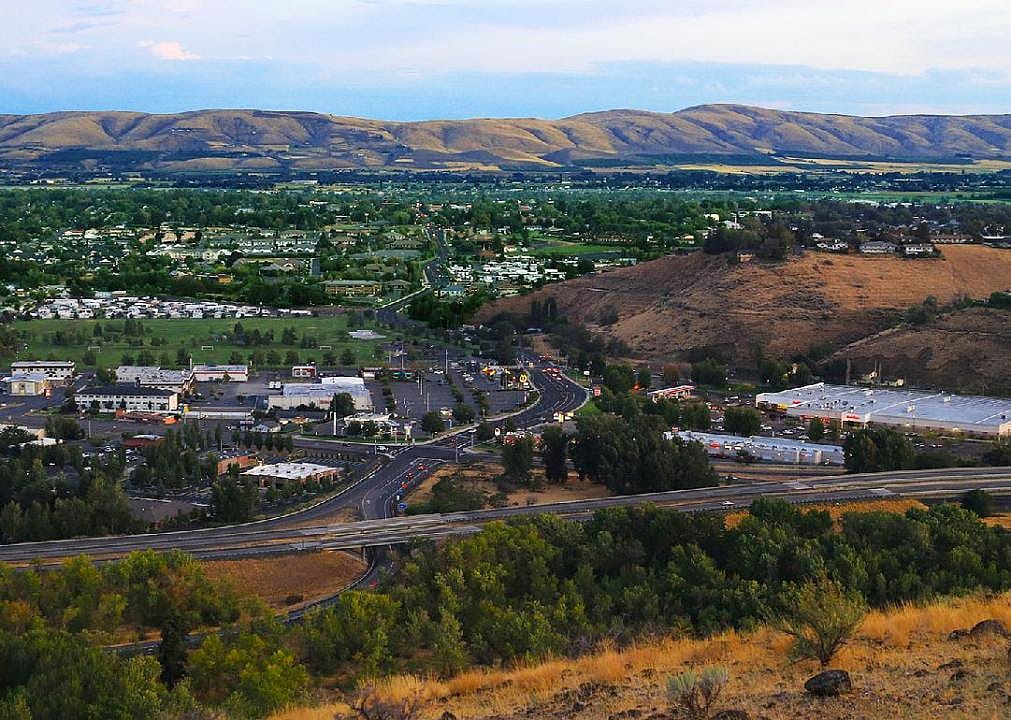
Canva
10 / 39- Total small business establishments: 4,872 (19.0 per 1,000 residents)
- Share of establishments that are small: 99.8%
- 2021 population: 256,647

Canva
11 / 39- Total small business establishments: 916 (19.3 per 1,000 residents)
- Share of establishments that are small: 99.8%
- 2021 population: 47,553

Canva
12 / 39- Total small business establishments: 439 (19.5 per 1,000 residents)
- Share of establishments that are small: 99.5%
- 2021 population: 22,468

Canva
13 / 39- Total small business establishments: 845 (19.5 per 1,000 residents)
- Share of establishments that are small: 99.6%
- 2021 population: 43,238

Irra // Shutterstock
14 / 39- Total small business establishments: 1,972 (19.6 per 1,000 residents)
- Share of establishments that are small: 99.9%
- 2021 population: 100,440

Canva
15 / 39- Total small business establishments: 2,238 (20.1 per 1,000 residents)
- Share of establishments that are small: 99.8%
- 2021 population: 111,648
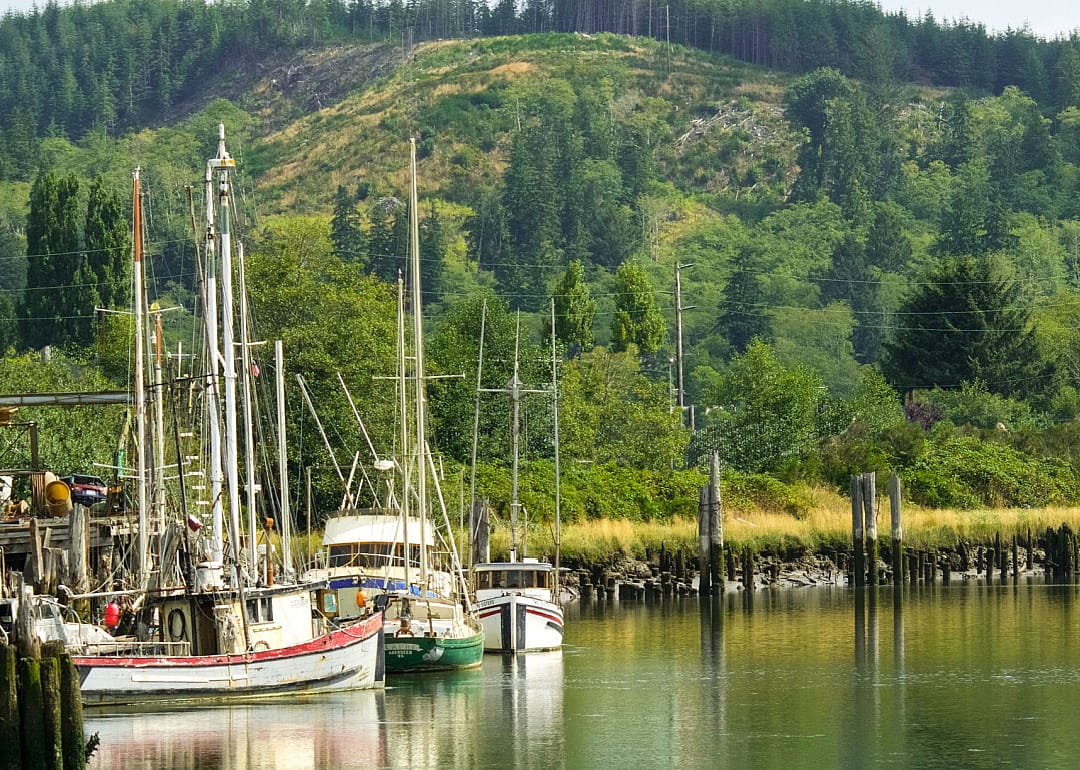
seesaw1 // Shutterstock
16 / 39- Total small business establishments: 1,558 (20.3 per 1,000 residents)
- Share of establishments that are small: 100.0%
- 2021 population: 76,787
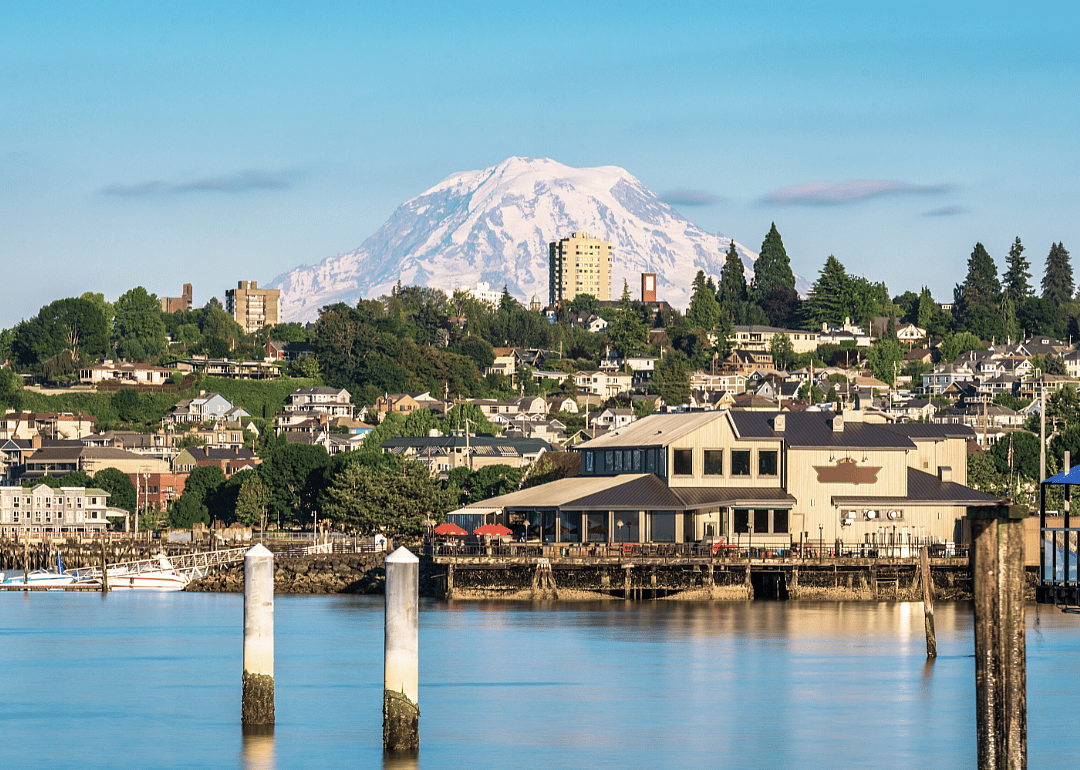
Canva
17 / 39- Total small business establishments: 19,426 (21.0 per 1,000 residents)
- Share of establishments that are small: 99.8%
- 2021 population: 927,199
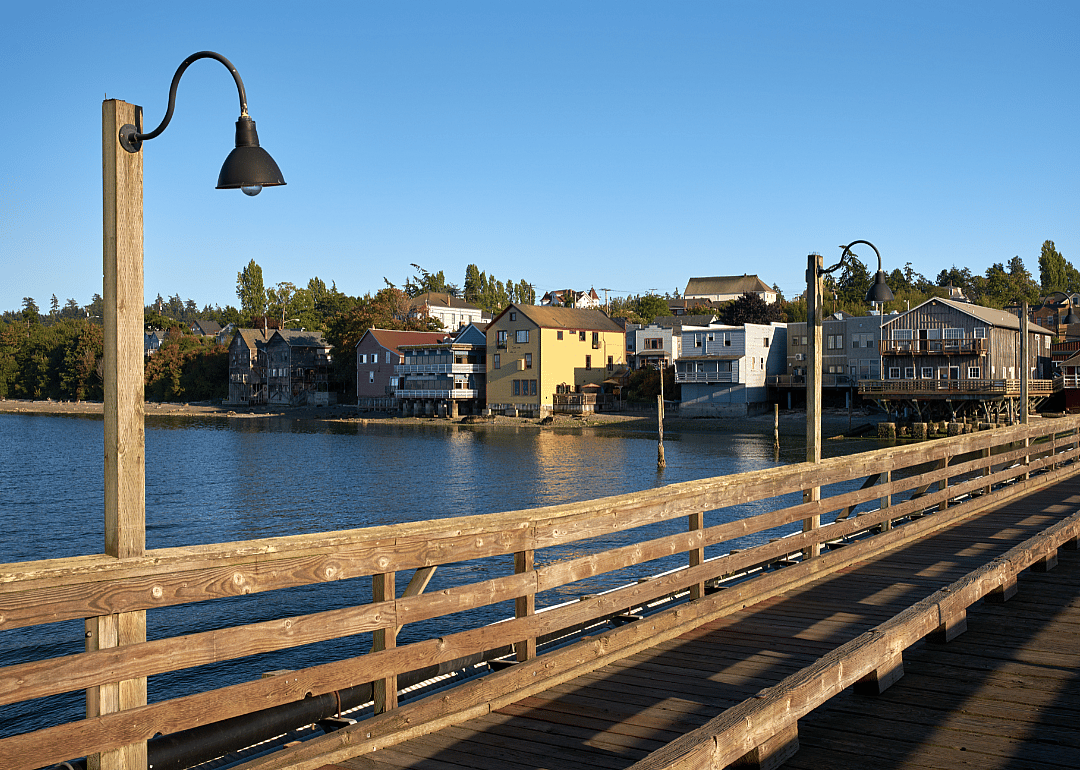
Canva
18 / 39- Total small business establishments: 1,894 (21.6 per 1,000 residents)
- Share of establishments that are small: 99.9%
- 2021 population: 87,557
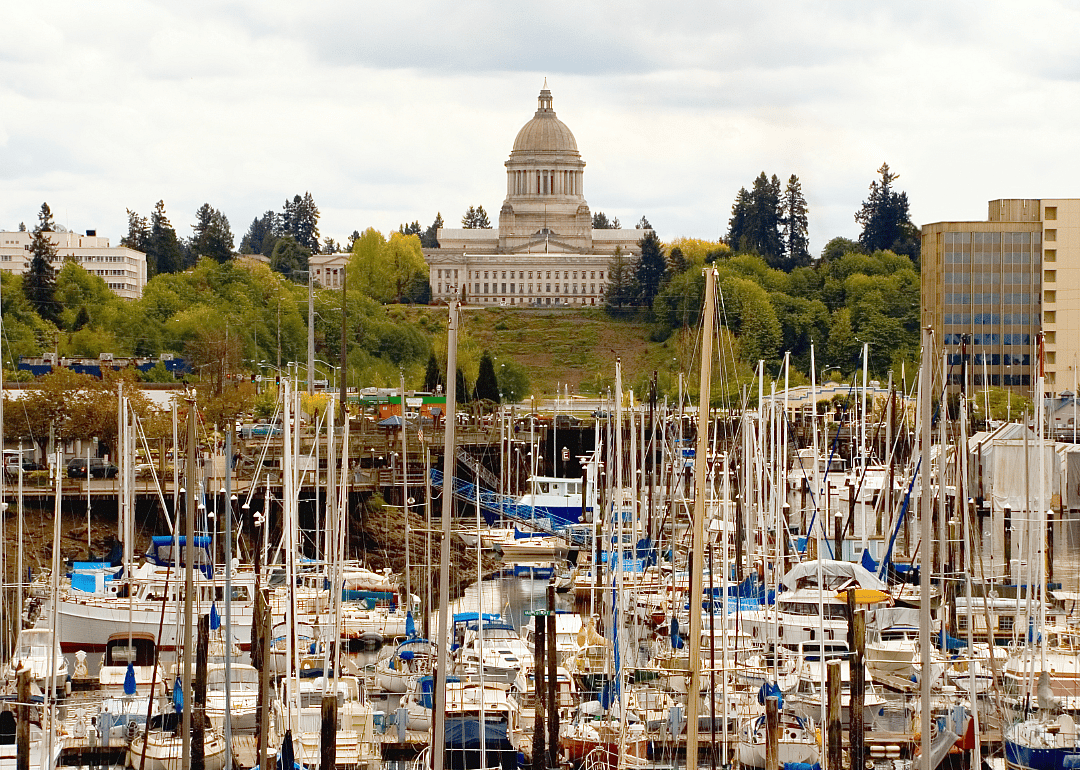
Canva
19 / 39- Total small business establishments: 6,523 (21.9 per 1,000 residents)
- Share of establishments that are small: 99.9%
- 2021 population: 298,078

Canva
20 / 39- Total small business establishments: 6,161 (22.3 per 1,000 residents)
- Share of establishments that are small: 99.9%
- 2021 population: 276,591

davidrh // Shutterstock
21 / 39- Total small business establishments: 1,942 (23.0 per 1,000 residents)
- Share of establishments that are small: 99.9%
- 2021 population: 84,575

Canva
22 / 39- Total small business establishments: 1,445 (23.3 per 1,000 residents)
- Share of establishments that are small: 99.7%
- 2021 population: 62,158

Victoria Ditkovsky // Shutterstock
23 / 39- Total small business establishments: 4,920 (23.4 per 1,000 residents)
- Share of establishments that are small: 99.8%
- 2021 population: 210,585

Canva
24 / 39- Total small business establishments: 11,978 (23.4 per 1,000 residents)
- Share of establishments that are small: 99.9%
- 2021 population: 512,588

Canva
25 / 39- Total small business establishments: 550 (23.7 per 1,000 residents)
- Share of establishments that are small: 99.6%
- 2021 population: 23,178

Canva
26 / 39- Total small business establishments: 19,892 (23.8 per 1,000 residents)
- Share of establishments that are small: 99.9%
- 2021 population: 836,037
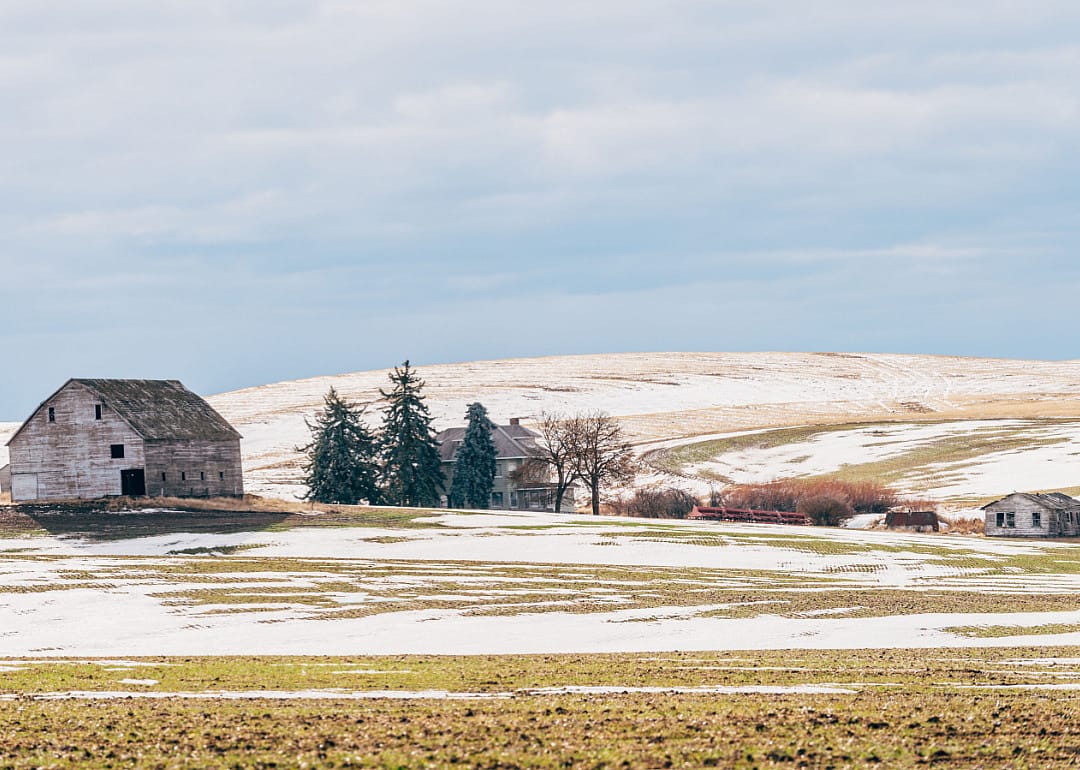
Arpad Jasko // Shutterstock
27 / 39- Total small business establishments: 273 (24.2 per 1,000 residents)
- Share of establishments that are small: 98.9%
- 2021 population: 11,277
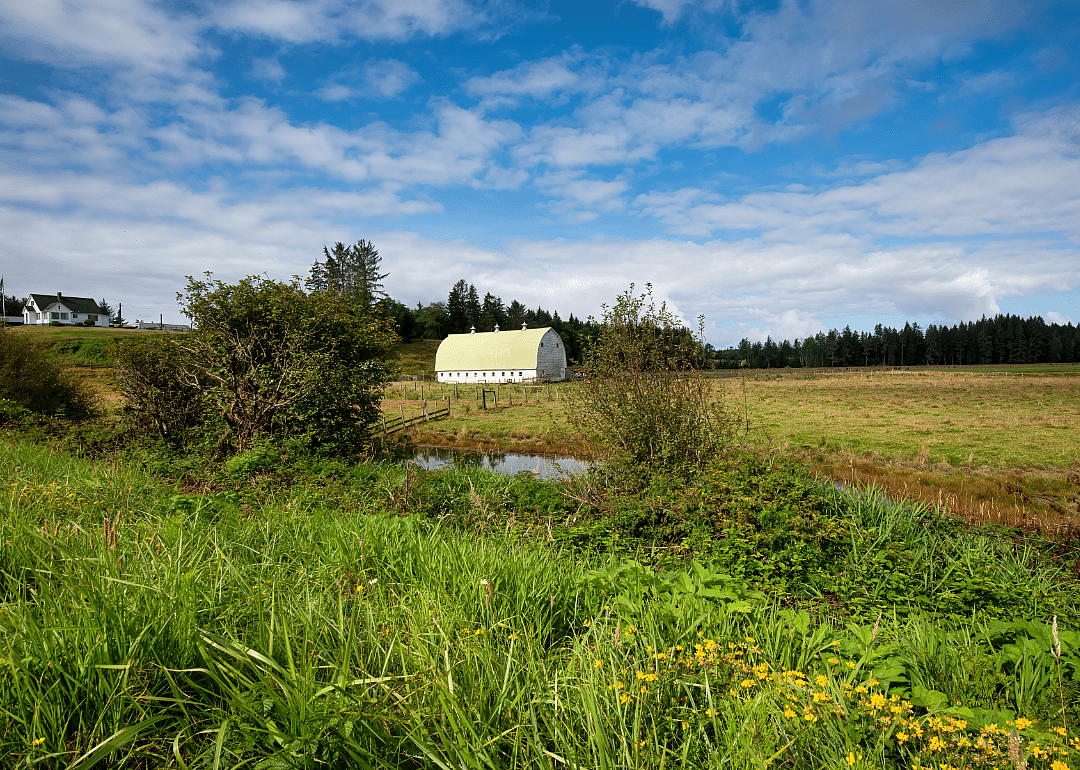
Canva
28 / 39- Total small business establishments: 597 (24.9 per 1,000 residents)
- Share of establishments that are small: 100.0%
- 2021 population: 23,971
Canva
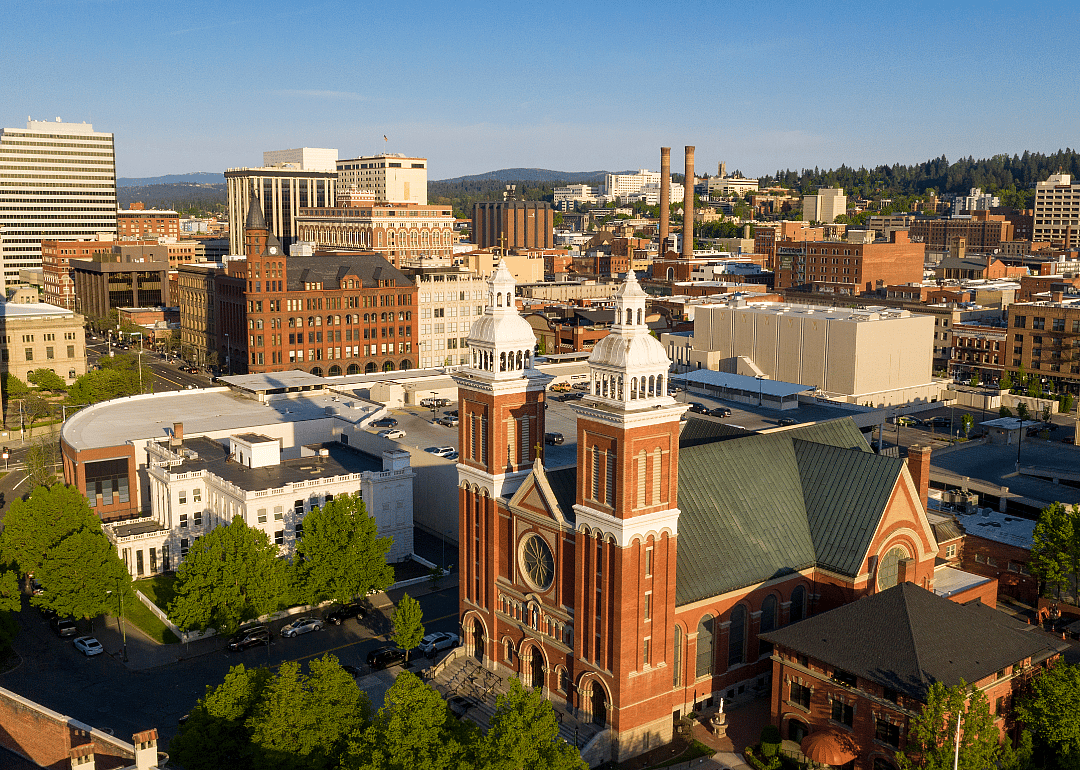
29 / 39- Total small business establishments: 13,840 (25.4 per 1,000 residents)
- Share of establishments that are small: 99.8%
- 2021 population: 545,498

Canva
30 / 39- Total small business establishments: 2,093 (26.7 per 1,000 residents)
- Share of establishments that are small: 100.0%
- 2021 population: 78,442

Canva
31 / 39- Total small business establishments: 1,159 (27.1 per 1,000 residents)
- Share of establishments that are small: 99.9%
- 2021 population: 42,741

Canva
32 / 39- Total small business establishments: 3,578 (27.3 per 1,000 residents)
- Share of establishments that are small: 99.9%
- 2021 population: 130,933

davidrh // Shutterstock
33 / 39- Total small business establishments: 117 (29.1 per 1,000 residents)
- Share of establishments that are small: 98.3%
- 2021 population: 4,015
Canva
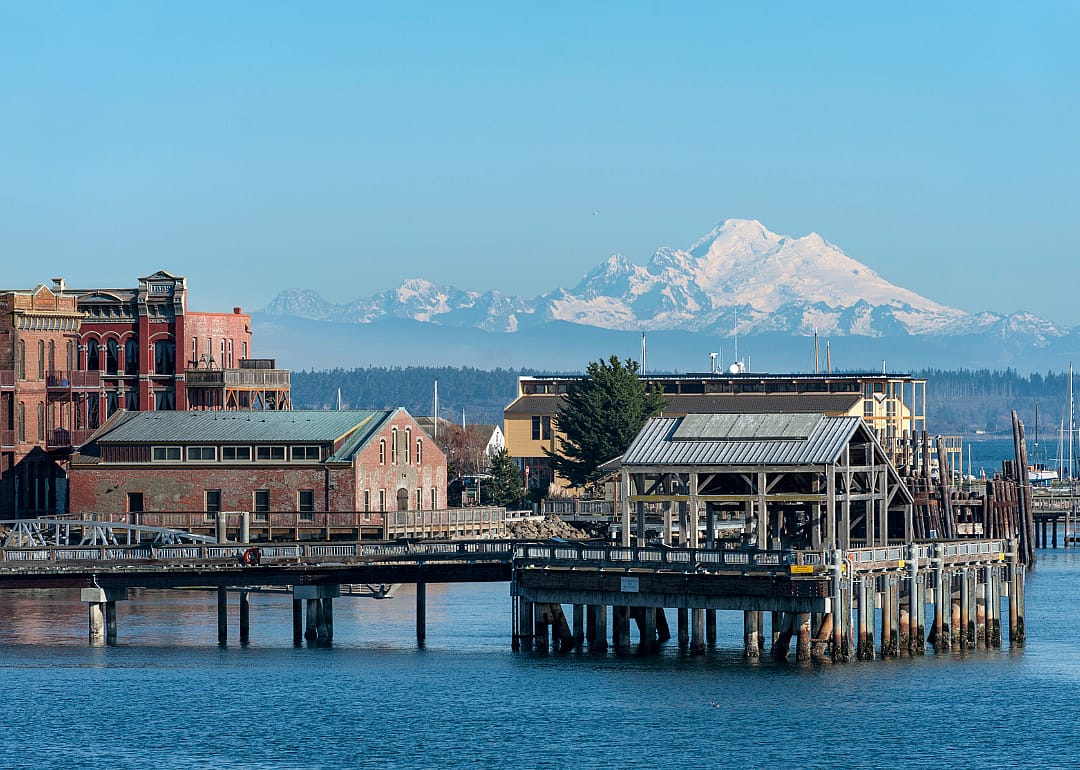
34 / 39- Total small business establishments: 1,016 (30.3 per 1,000 residents)
- Share of establishments that are small: 99.8%
- 2021 population: 33,561

Canva
35 / 39- Total small business establishments: 1,374 (30.8 per 1,000 residents)
- Share of establishments that are small: 99.7%
- 2021 population: 44,688
Canva
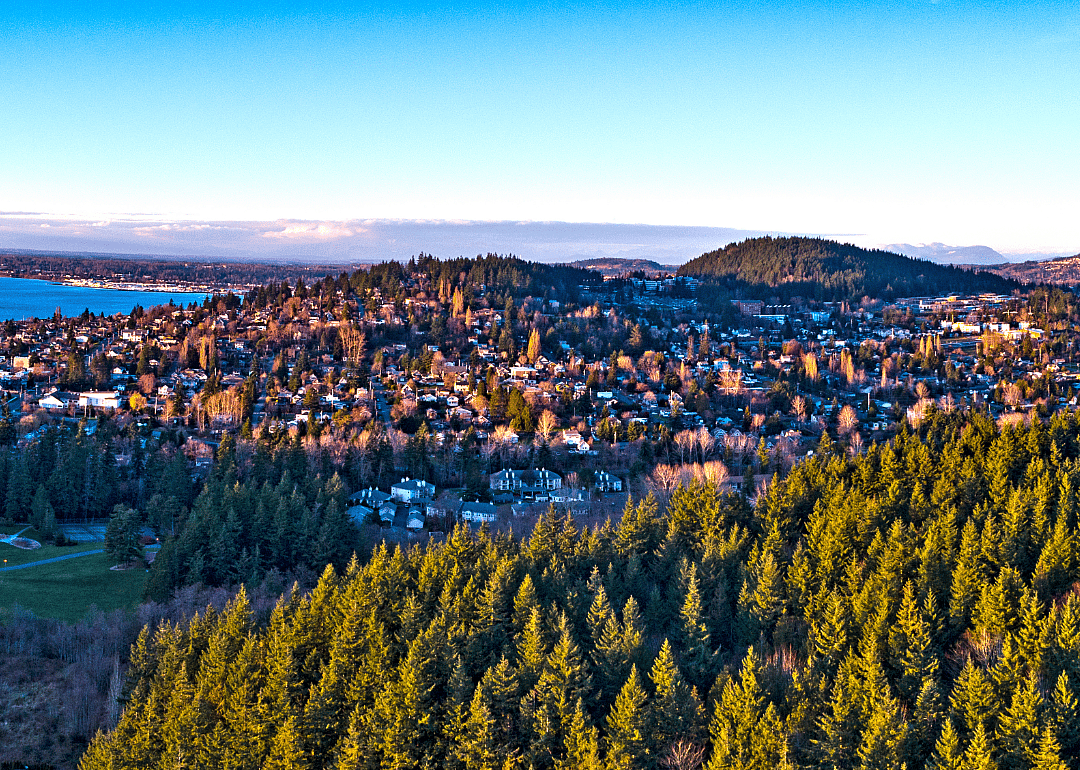
36 / 39- Total small business establishments: 6,987 (30.8 per 1,000 residents)
- Share of establishments that are small: 99.9%
- 2021 population: 226,718

kan_khampanya // Shutterstock
37 / 39- Total small business establishments: 70,492 (31.3 per 1,000 residents)
- Share of establishments that are small: 99.6%
- 2021 population: 2,253,038
Canva
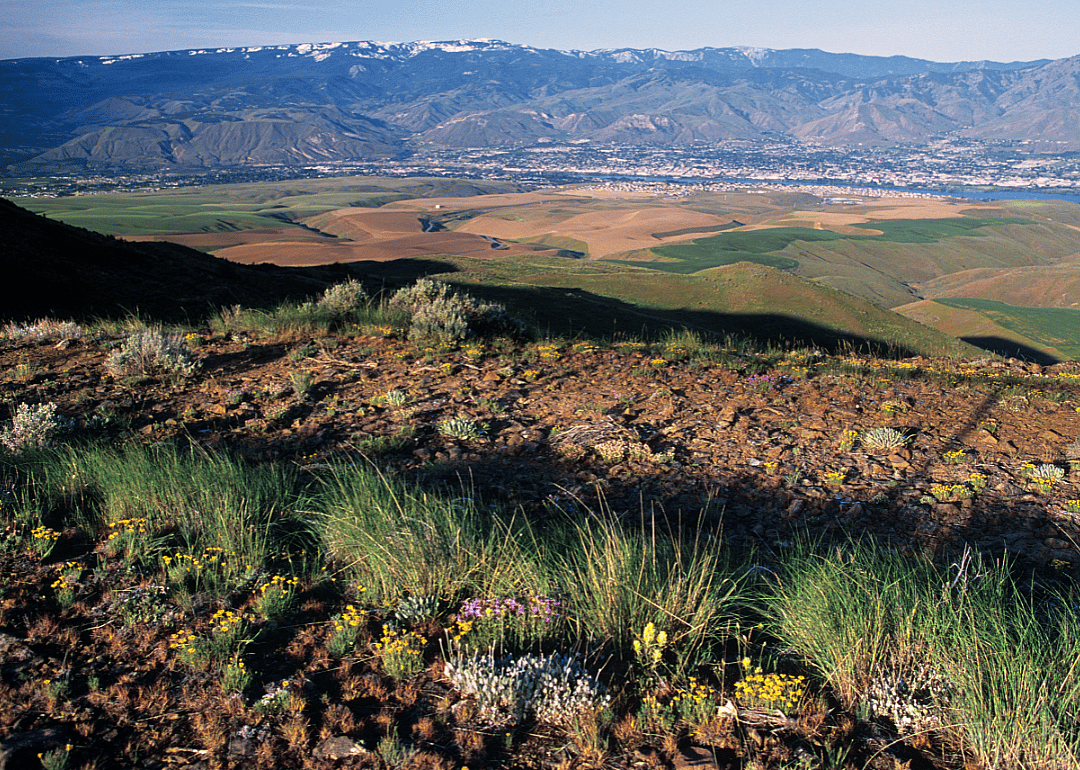
38 / 39- Total small business establishments: 2,671 (33.5 per 1,000 residents)
- Share of establishments that are small: 99.7%
- 2021 population: 79,775

Canva
39 / 39- Total small business establishments: 1,024 (55.0 per 1,000 residents)
- Share of establishments that are small: 99.9%
- 2021 population: 18,615



