Real Window Creative // Shutterstock
1 / 51#51. Delaware
- Annual average property damage: $70,204
- Annual property damage per 100K people: $6,893.6
- Most damaging disaster type: Thunderstorm winds ($39,200 in annual damage)

Summer weather brings the sun, more daylight, and rumbling midday thunderstorms, but occasionally, the scales tip toward the extreme.
As climate change warms the planet, the dog days of summer increasingly bring extreme weather conditions. Climate change exacerbates weirder-than-normal weather, interfering with ocean currents, lending extra heat to tornadoes, extending droughts, and intensifying floods.
A number of these extreme events took place throughout the United States during the summer of 2024, causing devastating loss of life and millions of dollars in damages. Wildfires scorched southern New Mexico from June through July, and Hurricane Beryl wreaked havoc on Texas's Gulf Coast in early July, leading to unseasonable tornado activity in the Midwest. According to the National Weather Service's Climate Prediction Center, the summer of 2025 will likely bring even more unusual weather, with average temperatures expected to soar well above historical averages across the U.S.
Severe summer weather will affect us all, but certain parts of the United States typically bear the brunt of these changes. Miami's summer heat and humidity are particularly intense: The city ranks among the top 10 cities most likely to be hit by a tropical storm or a hurricane. Meteorologists also recommend avoiding New Orleans; Dallas; Mobile, Alabama; and Corpus Christi, Texas, during the summer months.
Stacker ranked each state—in addition to the District of Columbia—by the total property damage due to summer weather occurrences from 2013 to 2022, using the National Oceanic and Atmospheric Administration's Storm Events Database. A weather event was classified as having occurred in the summer if it happened in June, July, or August.
Read on to find out which states are right in the eye of the storm.
You may also like: Does climate change spell the end of 'sweater weather?'
Real Window Creative // Shutterstock
1 / 51- Annual average property damage: $70,204
- Annual property damage per 100K people: $6,893.6
- Most damaging disaster type: Thunderstorm winds ($39,200 in annual damage)

Sean Pavone // Shutterstock
2 / 51- Annual average property damage: $371,150
- Annual property damage per 100K people: $8,753.3
- Most damaging disaster type: Wildfires ($230,000 in annual damage)

George Wirt // Shutterstock
3 / 51- Annual average property damage: $289,200
- Annual property damage per 100K people: $26,441.5
- Most damaging disaster type: Tropical storms ($185,210 in annual damage)

Kevin Ruck // Shutterstock
4 / 51- Annual average property damage: $1.4 million
- Annual property damage per 100K people: $27,048.9
- Most damaging disaster type: Flash floods ($420,500 in annual damage)

f11photo // Shutterstock
5 / 51- Annual average property damage: $191,250
- Annual property damage per 100K people: $28,468.2
- Most damaging disaster type: Thunderstorm winds ($101,250 in annual damage)
You may also like: Mango farms where? Climate change is scrambling where the world's food is grown.

f11photo // Shutterstock
6 / 51- Annual average property damage: $2.1 million
- Annual property damage per 100K people: $40,252.0
- Most damaging disaster type: Thunderstorm winds ($708,187 in annual damage)

Mihai_Andritoiu // Shutterstock
7 / 51- Annual average property damage: $4.5 million
- Annual property damage per 100K people: $49,080.3
- Most damaging disaster type: Thunderstorm winds ($3.5 million in annual damage)

Canva
8 / 51- Annual average property damage: $6.1 million
- Annual property damage per 100K people: $55,683.0
- Most damaging disaster type: Hails ($2.7 million in annual damage)
Joseph Sohm // Shutterstock
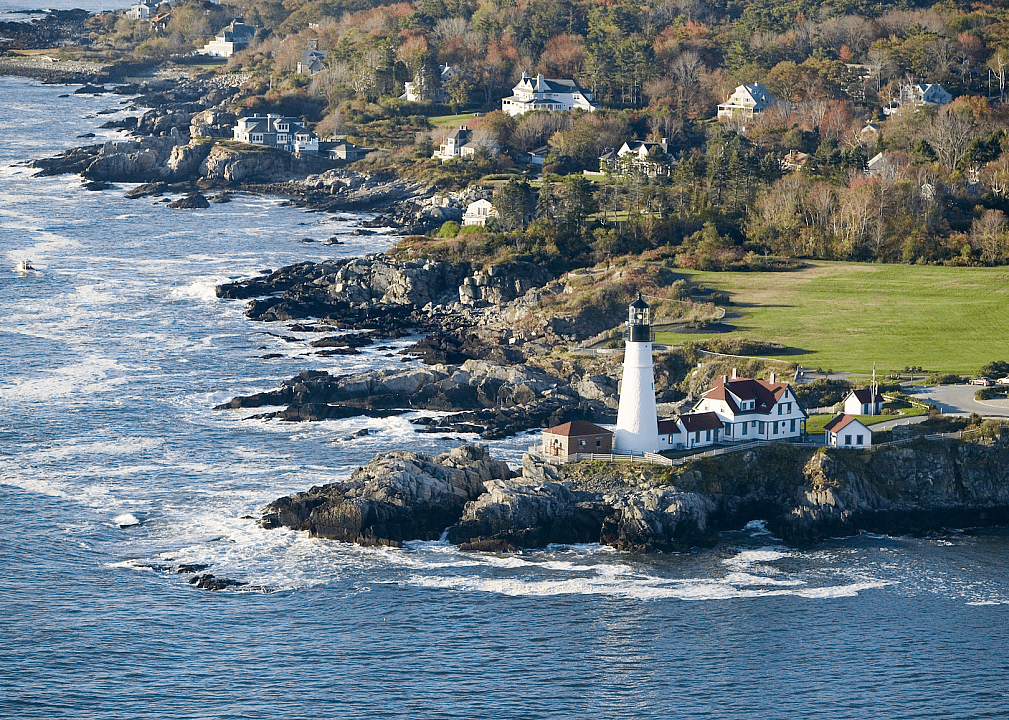
9 / 51- Annual average property damage: $775,300
- Annual property damage per 100K people: $55,964.6
- Most damaging disaster type: Flash floods ($421,400 in annual damage)

Mia2you // Shutterstock
10 / 51- Annual average property damage: $13.3 million
- Annual property damage per 100K people: $59,718.6
- Most damaging disaster type: Floods ($8.8 million in annual damage)
You may also like: What summer was like the year you were born

Canva
11 / 51- Annual average property damage: $874,600
- Annual property damage per 100K people: $60,727.8
- Most damaging disaster type: Flash floods ($860,000 in annual damage)

Sean Pavone // Shutterstock
12 / 51- Annual average property damage: $5.1 million
- Annual property damage per 100K people: $83,333.1
- Most damaging disaster type: Flash floods ($2.9 million in annual damage)

ESB Professional // Shutterstock
13 / 51- Annual average property damage: $12 million
- Annual property damage per 100K people: $92,460.0
- Most damaging disaster type: Flash floods ($5.4 million in annual damage)

Sean Pavone // Shutterstock
14 / 51- Annual average property damage: $6.7 million
- Annual property damage per 100K people: $96,208.8
- Most damaging disaster type: Flash floods ($3.2 million in annual damage)

Wangkun Jia // Shutterstock
15 / 51- Annual average property damage: $25.3 million
- Annual property damage per 100K people: $128,352.4
- Most damaging disaster type: Flash floods ($15.8 million in annual damage)
You may also like: The rural Americans too poor for federal flood protections

Rotorhead 30A Productions // Shutterstock
16 / 51- Annual average property damage: $6 million
- Annual property damage per 100K people: $132,199.7
- Most damaging disaster type: Flash floods ($3.1 million in annual damage)

Sean Pavone // Shutterstock
17 / 51- Annual average property damage: $9.7 million
- Annual property damage per 100K people: $141,505.3
- Most damaging disaster type: Flash floods ($6.8 million in annual damage)

Canva
18 / 51- Annual average property damage: $4.6 million
- Annual property damage per 100K people: $152,112.0
- Most damaging disaster type: Thunderstorm winds ($1.8 million in annual damage)

Sean Pavone // Shutterstock
19 / 51- Annual average property damage: $14.2 million
- Annual property damage per 100K people: $164,081.9
- Most damaging disaster type: Thunderstorm winds ($7.6 million in annual damage)

Sean Pavone // Shutterstock
20 / 51- Annual average property damage: $6.9 million
- Annual property damage per 100K people: $190,426.6
- Most damaging disaster type: Tropical storms ($5.4 million in annual damage)
You may also like: Fast fashion is haunting L.A.'s wildfire relief efforts

Charles Knowles // Shutterstock
21 / 51- Annual average property damage: $3.8 million
- Annual property damage per 100K people: $197,785.7
- Most damaging disaster type: Wildfires ($2.1 million in annual damage)

Canva
22 / 51- Annual average property damage: $23.4 million
- Annual property damage per 100K people: $199,169.4
- Most damaging disaster type: Flash floods ($11.7 million in annual damage)

Sean Pavone // Shutterstock
23 / 51- Annual average property damage: $8.1 million
- Annual property damage per 100K people: $201,365.0
- Most damaging disaster type: Tornados ($5.1 million in annual damage)

Mihai_Andritoiu // Shutterstock
24 / 51- Annual average property damage: $2.3 million
- Annual property damage per 100K people: $205,161.9
- Most damaging disaster type: Thunderstorm winds ($990,770 in annual damage)

Jacob Boomsma // Shutterstock
25 / 51- Annual average property damage: $6.2 million
- Annual property damage per 100K people: $211,971.5
- Most damaging disaster type: Tornados ($2.9 million in annual damage)
You may also like: Food is a huge source of methane emissions. Fixing that is no easy feat.

Canva
26 / 51- Annual average property damage: $7.1 million
- Annual property damage per 100K people: $241,593.8
- Most damaging disaster type: Flash floods ($3.2 million in annual damage)

Sean Pavone // Shutterstock
27 / 51- Annual average property damage: $3.4 million
- Annual property damage per 100K people: $242,909.6
- Most damaging disaster type: Flash floods ($3.3 million in annual damage)

randy andy // Shutterstock
28 / 51- Annual average property damage: $7.8 million
- Annual property damage per 100K people: $246,272.5
- Most damaging disaster type: Hails ($5 million in annual damage)

Sean Pavone // Shutterstock
29 / 51- Annual average property damage: $18.4 million
- Annual property damage per 100K people: $249,683.1
- Most damaging disaster type: Flash floods ($11 million in annual damage)

Canva
30 / 51- Annual average property damage: $16.7 million
- Annual property damage per 100K people: $291,812.0
- Most damaging disaster type: Floods ($4.5 million in annual damage)
You may also like: How do hurricanes affect baby names?
Sharkshock // Shutterstock
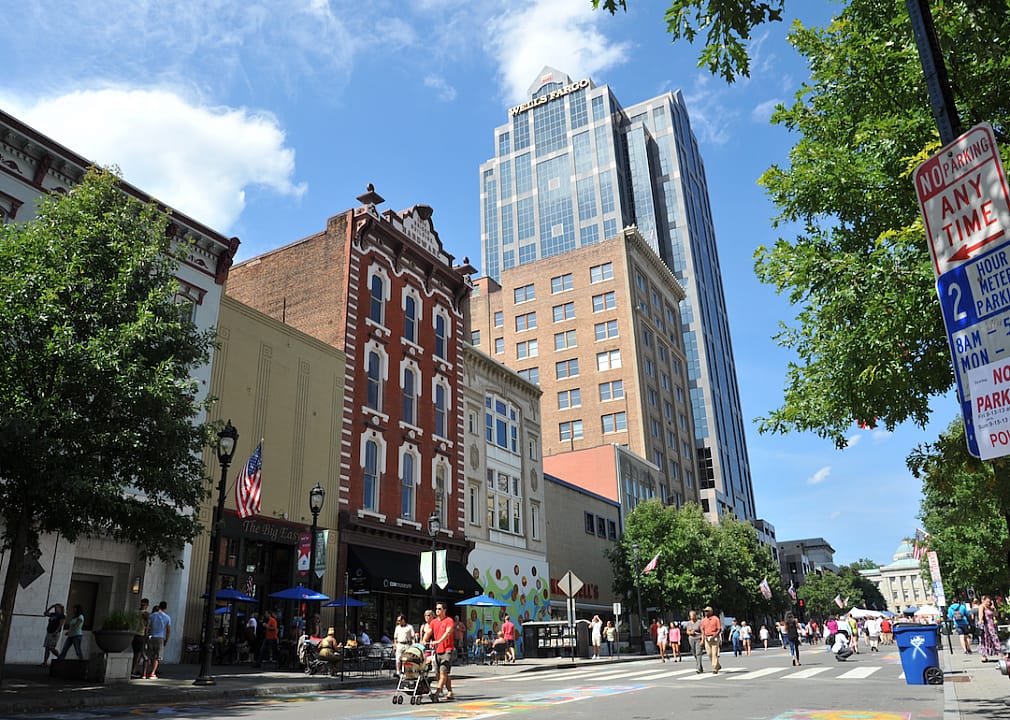
31 / 51- Annual average property damage: $31.3 million
- Annual property damage per 100K people: $292,280.7
- Most damaging disaster type: Flash floods ($23.5 million in annual damage)

Sean Pavone // Shutterstock
32 / 51- Annual average property damage: $38.7 million
- Annual property damage per 100K people: $307,761.7
- Most damaging disaster type: Flash floods ($25.6 million in annual damage)

Sean Pavone // Shutterstock
33 / 51- Annual average property damage: $6.6 million
- Annual property damage per 100K people: $310,509.1
- Most damaging disaster type: Flash floods ($3.5 million in annual damage)

Sean Pavone // Shutterstock
34 / 51- Annual average property damage: $11.7 million
- Annual property damage per 100K people: $345,543.5
- Most damaging disaster type: Wildfires ($6.2 million in annual damage)

Kevin Ruck // Shutterstock
35 / 51- Annual average property damage: $25.6 million
- Annual property damage per 100K people: $362,508.4
- Most damaging disaster type: Flash floods ($24 million in annual damage)
You may also like: What hurricane season was like the year you were born

TommyBrison // Shutterstock
36 / 51- Annual average property damage: $22.6 million
- Annual property damage per 100K people: $365,684.4
- Most damaging disaster type: Flash floods ($19.6 million in annual damage)

Canva
37 / 51- Annual average property damage: $2.9 million
- Annual property damage per 100K people: $392,017.5
- Most damaging disaster type: Flash floods ($1.6 million in annual damage)

Marek Masik // Shutterstock
38 / 51- Annual average property damage: $184.4 million
- Annual property damage per 100K people: $472,492.5
- Most damaging disaster type: Wildfires ($164.5 million in annual damage)

Albert Pego // Shutterstock
39 / 51- Annual average property damage: $3.1 million
- Annual property damage per 100K people: $479,434.8
- Most damaging disaster type: Flash floods ($2.2 million in annual damage)

Agnieszka Gaul // Shutterstock
40 / 51- Annual average property damage: $43.7 million
- Annual property damage per 100K people: $561,205.0
- Most damaging disaster type: Wildfires ($41.8 million in annual damage)
You may also like: Climate change is messing with city sewers—and the solutions are even messier

Mihai_Andritoiu // Shutterstock
41 / 51- Annual average property damage: $42.9 million
- Annual property damage per 100K people: $727,551.5
- Most damaging disaster type: Flash floods ($14.5 million in annual damage)

LBill45 // Shutterstock
42 / 51- Annual average property damage: $4.7 million
- Annual property damage per 100K people: $801,438.0
- Most damaging disaster type: Floods ($2.7 million in annual damage)

Sean Pavone // Shutterstock
43 / 51- Annual average property damage: $21.7 million
- Annual property damage per 100K people: $1,223,132.8
- Most damaging disaster type: Flash floods ($11.6 million in annual damage)

JohnDSmith // Shutterstock
44 / 51- Annual average property damage: $11.2 million
- Annual property damage per 100K people: $1,233,768.3
- Most damaging disaster type: Hails ($7.3 million in annual damage)

Jacob Boomsma // Shutterstock
45 / 51- Annual average property damage: $49.5 million
- Annual property damage per 100K people: $1,546,090.2
- Most damaging disaster type: Tornados ($33.8 million in annual damage)
You may also like: Most extreme temperatures in the history of every state
Katherine Welles // Shutterstock
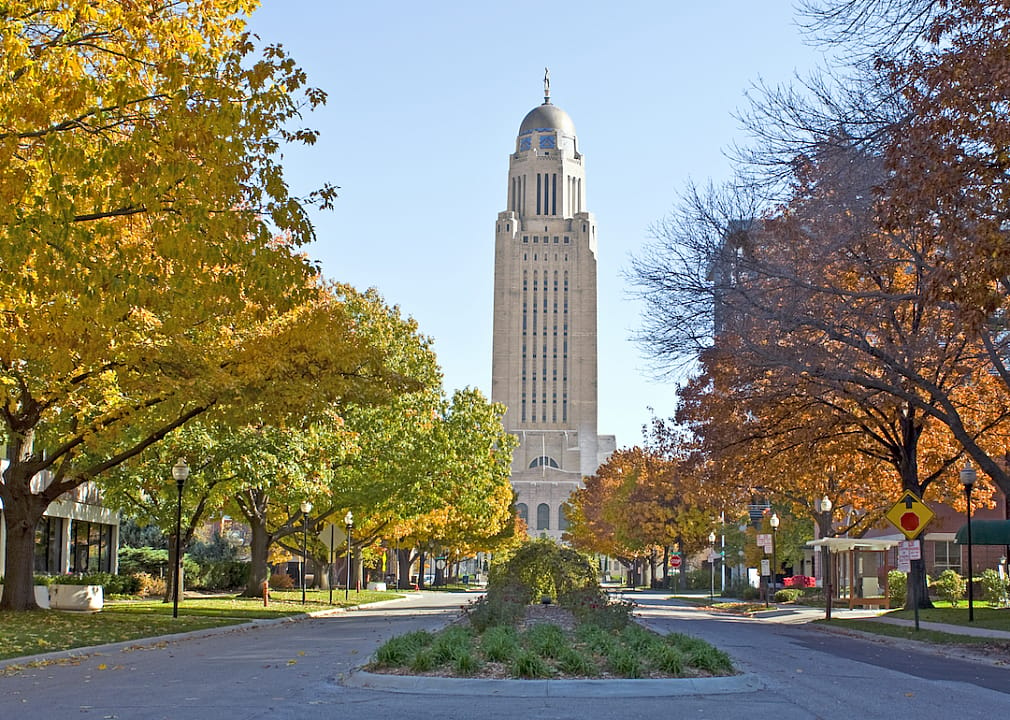
46 / 51- Annual average property damage: $32.2 million
- Annual property damage per 100K people: $1,636,407.8
- Most damaging disaster type: Thunderstorm winds ($12.7 million in annual damage)
Canva
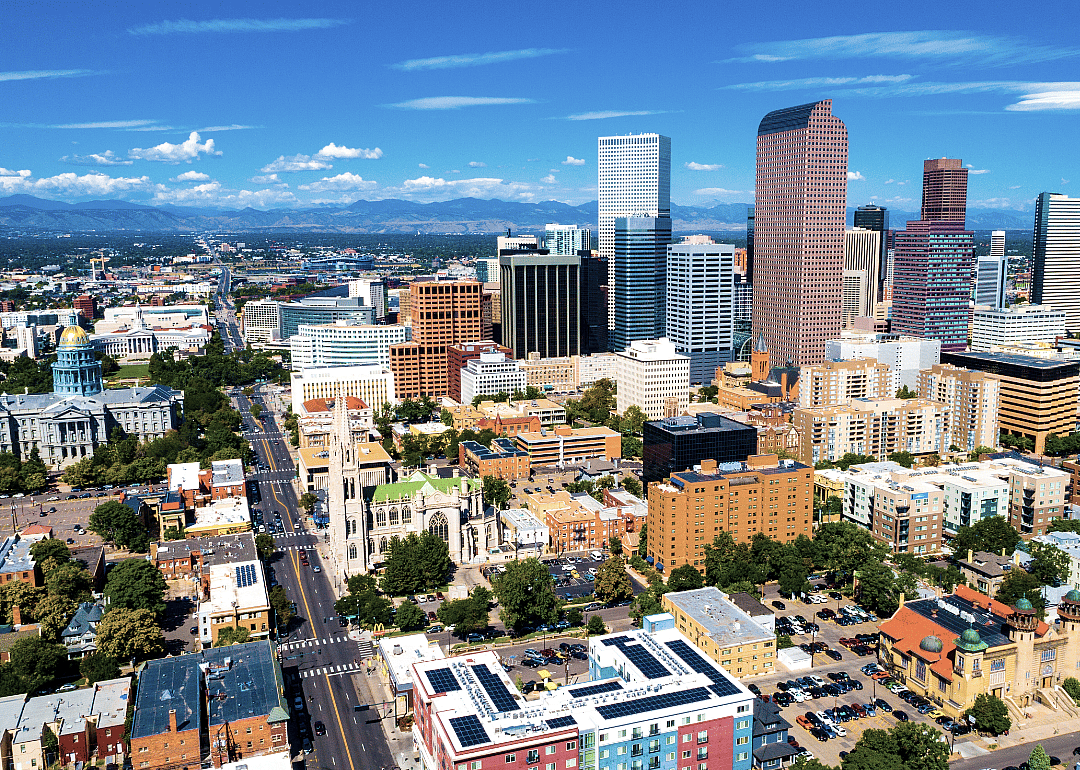
47 / 51- Annual average property damage: $113.3 million
- Annual property damage per 100K people: $1,940,924.7
- Most damaging disaster type: Hails ($61.8 million in annual damage)

Jacob Boomsma // Shutterstock
48 / 51- Annual average property damage: $15.4 million
- Annual property damage per 100K people: $1,976,917.9
- Most damaging disaster type: Hails ($8.7 million in annual damage)

Sean Pavone // Shutterstock
49 / 51- Annual average property damage: $246.1 million
- Annual property damage per 100K people: $2,452,509.6
- Most damaging disaster type: Flash floods ($218.3 million in annual damage)

Sean Pavone // Shutterstock
50 / 51- Annual average property damage: $5.6 billion
- Annual property damage per 100K people: $18,564,520.8
- Most damaging disaster type: Flash floods ($4.5 billion in annual damage)
You may also like: Oh, great: Rat populations are surging as cities heat up

Sean Pavone // Shutterstock
51 / 51- Annual average property damage: $3.2 billion
- Annual property damage per 100K people: $69,646,412.5
- Most damaging disaster type: Hurricanes ($1.9 billion in annual damage)
Data reporting by Emma Rubin. Story editing by Brian Budzynski. Copy editing by Paris Close.