Several factors contribute to cancer rates, from personal habits and genetics to air pollution or groundwater quality in a given area. People experiencing social, economic, or environmental disadvantages are disproportionately affected by high cancer rates in certain regions—including access or barriers to early screening and care.
Cancer rates also fluctuate by jobs: Higher rates of cancer can be found among meat industry and rubber manufacturing workers, and farmers.
Stacker compiled the counties with the highest cancer rates in West Virginia using data from the CDC. Keep reading to see where in your state cancer cases are the most common.
You may also like: See the most extreme temperatures in West Virginia history
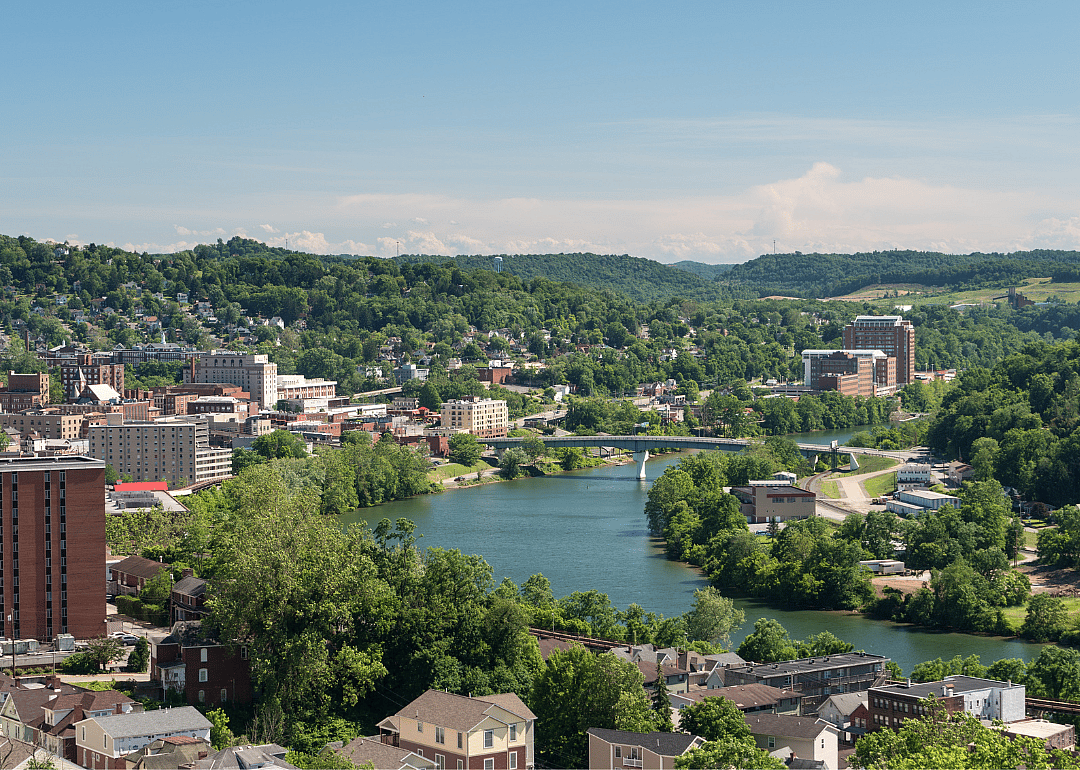
#55. Monongalia County
- Cancer rate per 100,000, 2016-2020: 442.4
- Age-adjusted rate per 100,000, 2016-2020: 449.1
Nicole Glass Photography // Shutterstock
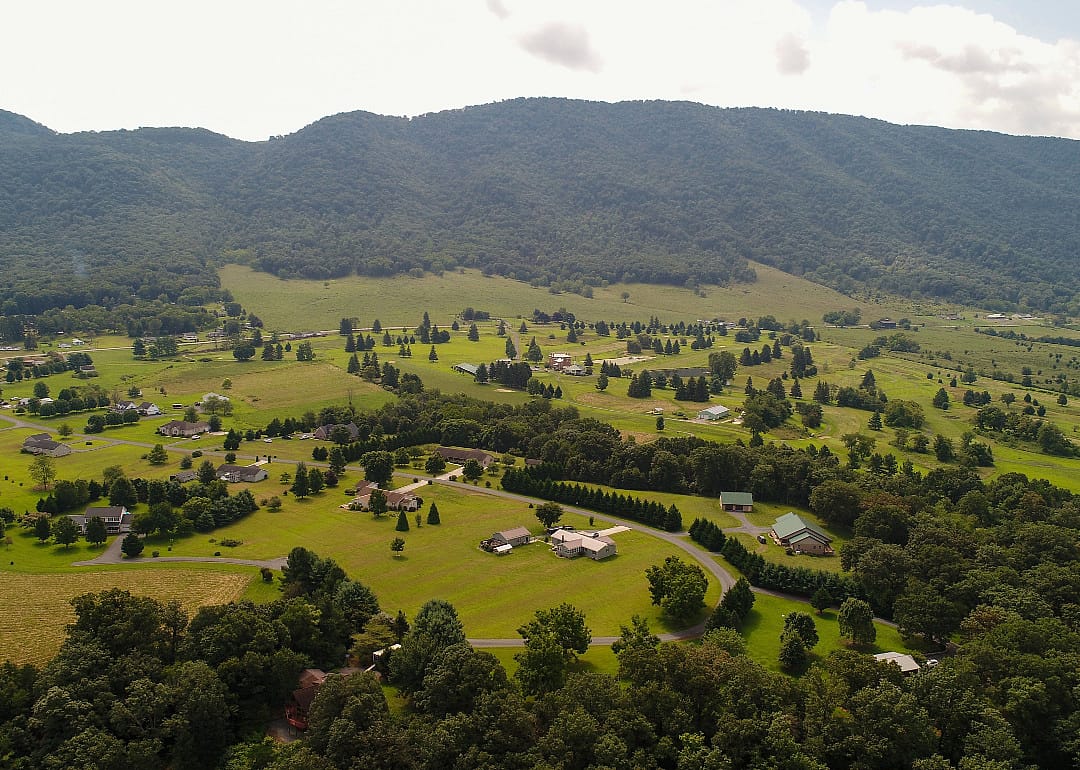
2 / 55#54. Hardy County
- Cancer rate per 100,000, 2016-2020: 538.1
- Age-adjusted rate per 100,000, 2016-2020: 384.2
Byron Key // Shutterstock
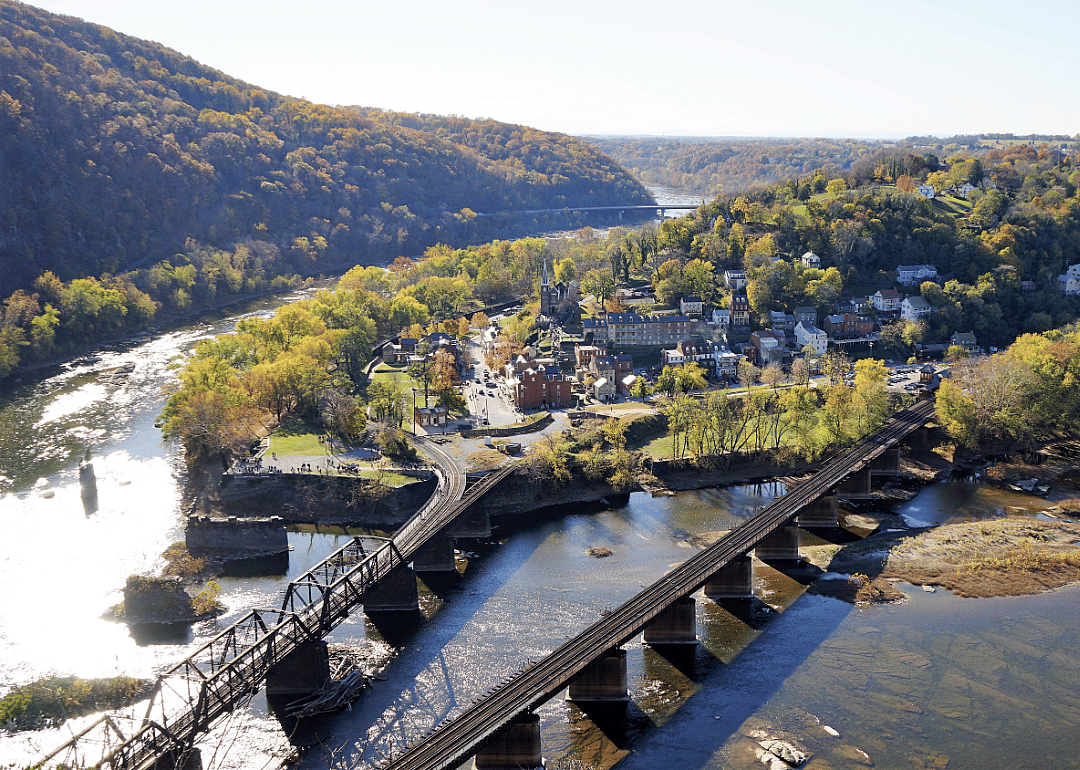
3 / 55#53. Berkeley County
- Cancer rate per 100,000, 2016-2020: 542.8
- Age-adjusted rate per 100,000, 2016-2020: 463.6
Malachi Jacobs // Shutterstock
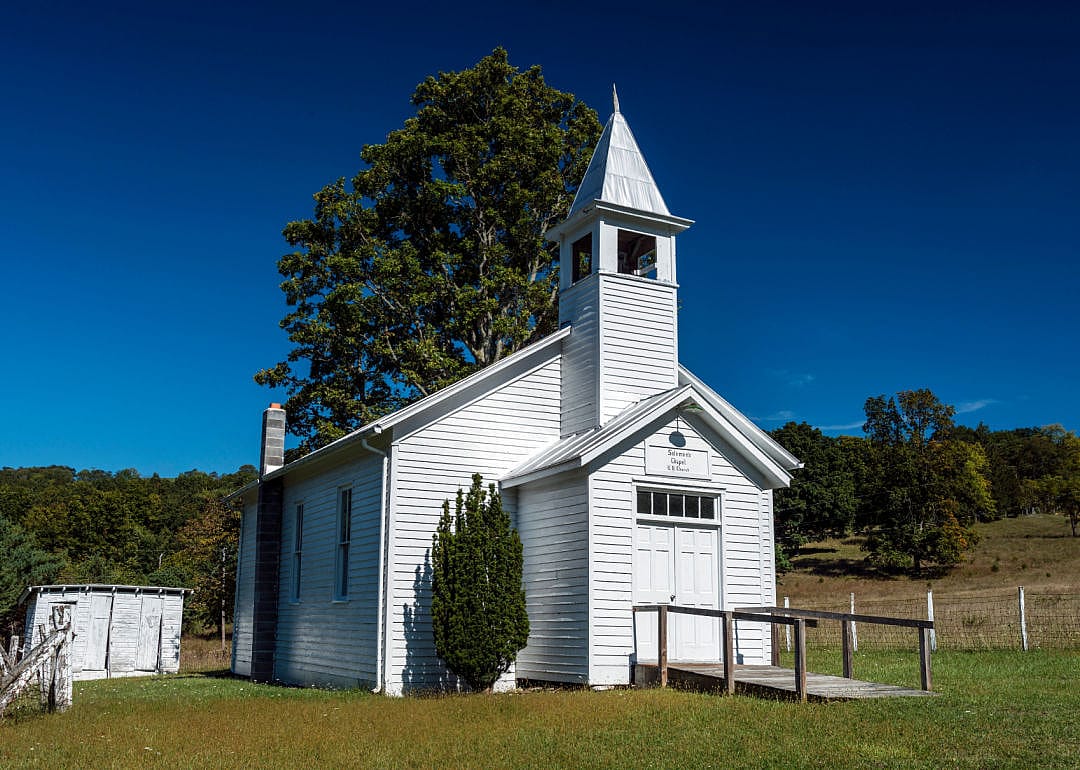
4 / 55#52. Pendleton County
- Cancer rate per 100,000, 2016-2020: 562.6
- Age-adjusted rate per 100,000, 2016-2020: 307.3
mzglass96 // Shutterstock
6 / 55#50. Grant County
- Cancer rate per 100,000, 2016-2020: 598.4
- Age-adjusted rate per 100,000, 2016-2020: 387.4
Kenneth Keifer // Shutterstock
7 / 55#49. Doddridge County
- Cancer rate per 100,000, 2016-2020: 602.4
- Age-adjusted rate per 100,000, 2016-2020: 402.4
The Old Major // Shutterstock
8 / 55#48. Gilmer County
- Cancer rate per 100,000, 2016-2020: 614.8
- Age-adjusted rate per 100,000, 2016-2020: 490.8
Bob Couperthwaite // Shutterstock
9 / 55#47. Hampshire County
- Cancer rate per 100,000, 2016-2020: 632.5
- Age-adjusted rate per 100,000, 2016-2020: 413.1
Dennis Ray Dennison II // Shutterstock
10 / 55#45. Calhoun County
- Cancer rate per 100,000, 2016-2020: 643.0
- Age-adjusted rate per 100,000, 2016-2020: 390.6
#44. Preston County
- Cancer rate per 100,000, 2016-2020: 651.0
- Age-adjusted rate per 100,000, 2016-2020: 457.5
#43. Barbour County
- Cancer rate per 100,000, 2016-2020: 651.6
- Age-adjusted rate per 100,000, 2016-2020: 483.8
#42. Wirt County
- Cancer rate per 100,000, 2016-2020: 659.2
- Age-adjusted rate per 100,000, 2016-2020: 446.0
Angel Cochran // Shutterstock
15 / 55Dee Browning // Shutterstock
16 / 55#40. Cabell County
- Cancer rate per 100,000, 2016-2020: 664.5
- Age-adjusted rate per 100,000, 2016-2020: 507.5
#39. Marion County
- Cancer rate per 100,000, 2016-2020: 670.1
- Age-adjusted rate per 100,000, 2016-2020: 504.6
#38. Ritchie County
- Cancer rate per 100,000, 2016-2020: 671.0
- Age-adjusted rate per 100,000, 2016-2020: 429.9
Malachi Jacobs // Shutterstock
19 / 55#37. Braxton County
- Cancer rate per 100,000, 2016-2020: 675.6
- Age-adjusted rate per 100,000, 2016-2020: 450.0
The American Explorer // Shutterstock
20 / 55#35. Marshall County
- Cancer rate per 100,000, 2016-2020: 687.4
- Age-adjusted rate per 100,000, 2016-2020: 452.4
Malachi Jacobs // Shutterstock
22 / 55#34. Raleigh County
- Cancer rate per 100,000, 2016-2020: 687.7
- Age-adjusted rate per 100,000, 2016-2020: 485.3
#33. Wood County
- Cancer rate per 100,000, 2016-2020: 691.8
- Age-adjusted rate per 100,000, 2016-2020: 481.4
JNix // Shutterstock
24 / 55#32. Jackson County
- Cancer rate per 100,000, 2016-2020: 693.2
- Age-adjusted rate per 100,000, 2016-2020: 473.9
Claire Salvail Photos // Shutterstock
25 / 55#30. Harrison County
- Cancer rate per 100,000, 2016-2020: 701.6
- Age-adjusted rate per 100,000, 2016-2020: 504.8
Steve Heap // Shutterstock
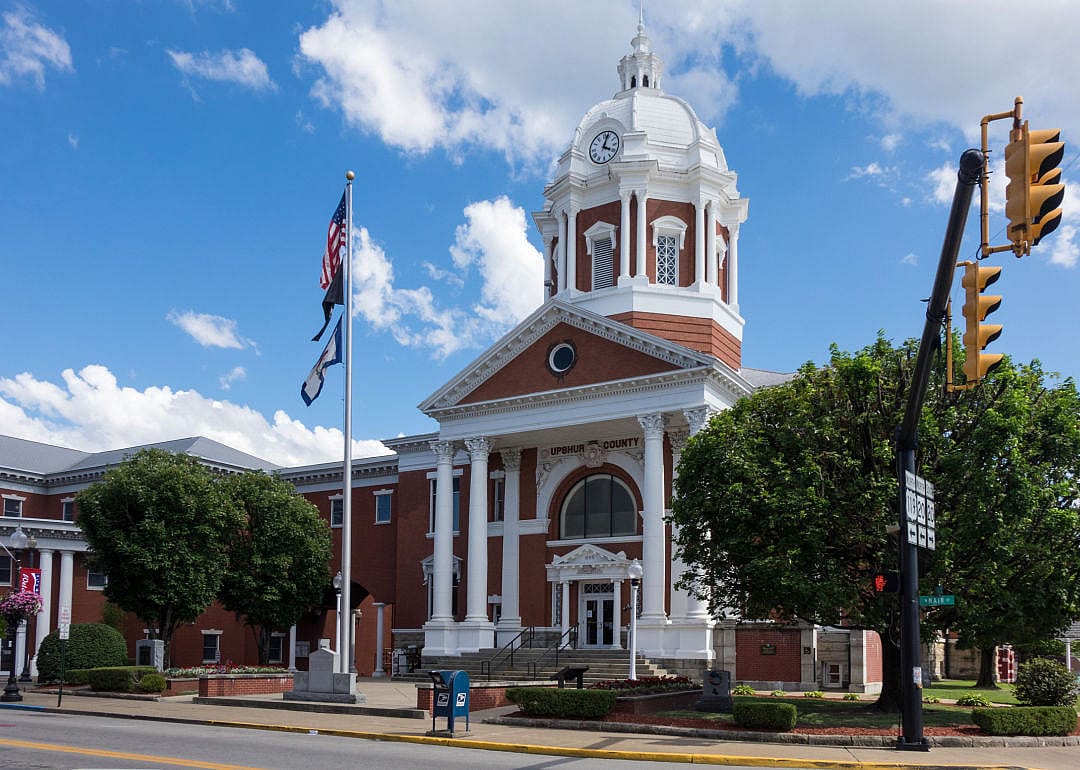
27 / 55#29. Upshur County
- Cancer rate per 100,000, 2016-2020: 702.6
- Age-adjusted rate per 100,000, 2016-2020: 497.8
Steve Heap // Shutterstock
28 / 55#28. Taylor County
- Cancer rate per 100,000, 2016-2020: 707.6
- Age-adjusted rate per 100,000, 2016-2020: 499.7
#27. Ohio County
- Cancer rate per 100,000, 2016-2020: 712.1
- Age-adjusted rate per 100,000, 2016-2020: 492.5
#25. Summers County
- Cancer rate per 100,000, 2016-2020: 714.4
- Age-adjusted rate per 100,000, 2016-2020: 447.3
Malachi Jacobs // Shutterstock
32 / 55#24. Nicholas County
- Cancer rate per 100,000, 2016-2020: 714.5
- Age-adjusted rate per 100,000, 2016-2020: 474.8
#23. Kanawha County
- Cancer rate per 100,000, 2016-2020: 717.4
- Age-adjusted rate per 100,000, 2016-2020: 503.9
Joseph Sohm // Shutterstock
34 / 55#22. Greenbrier County
- Cancer rate per 100,000, 2016-2020: 718.8
- Age-adjusted rate per 100,000, 2016-2020: 471.8
Rosemarie Mosteller // Shutterstock
36 / 55#20. Mason County
- Cancer rate per 100,000, 2016-2020: 722.1
- Age-adjusted rate per 100,000, 2016-2020: 487.4
#19. Fayette County
- Cancer rate per 100,000, 2016-2020: 725.1
- Age-adjusted rate per 100,000, 2016-2020: 504.8
Matt Levi Media // Shutterstock
38 / 55#18. Morgan County
- Cancer rate per 100,000, 2016-2020: 725.8
- Age-adjusted rate per 100,000, 2016-2020: 452.8
#17. Wyoming County
- Cancer rate per 100,000, 2016-2020: 729.5
- Age-adjusted rate per 100,000, 2016-2020: 503.6
#15. McDowell County
- Cancer rate per 100,000, 2016-2020: 738.8
- Age-adjusted rate per 100,000, 2016-2020: 488.1
Gage Goulding // Shutterstock
42 / 55#14. Brooke County
- Cancer rate per 100,000, 2016-2020: 741.8
- Age-adjusted rate per 100,000, 2016-2020: 469.9
Malachi Jacobs // Shutterstock
43 / 55#13. Clay County
- Cancer rate per 100,000, 2016-2020: 744.2
- Age-adjusted rate per 100,000, 2016-2020: 499.8
#12. Lincoln County
- Cancer rate per 100,000, 2016-2020: 746.0
- Age-adjusted rate per 100,000, 2016-2020: 537.2
#10. Wayne County
- Cancer rate per 100,000, 2016-2020: 752.4
- Age-adjusted rate per 100,000, 2016-2020: 522.5
Jerry Sharp // Shutterstock
47 / 55#9. Hancock County
- Cancer rate per 100,000, 2016-2020: 755.5
- Age-adjusted rate per 100,000, 2016-2020: 481.4
Kenneth Keifer // Shutterstock
48 / 55#8. Wetzel County
- Cancer rate per 100,000, 2016-2020: 767.8
- Age-adjusted rate per 100,000, 2016-2020: 506.9
#7. Tyler County
- Cancer rate per 100,000, 2016-2020: 769.2
- Age-adjusted rate per 100,000, 2016-2020: 493.1
#5. Roane County
- Cancer rate per 100,000, 2016-2020: 788.1
- Age-adjusted rate per 100,000, 2016-2020: 530.5
#4. Tucker County
- Cancer rate per 100,000, 2016-2020: 797.9
- Age-adjusted rate per 100,000, 2016-2020: 464.2
Malachi Jacobs // Shutterstock
53 / 55#3. Lewis County
- Cancer rate per 100,000, 2016-2020: 806.3
- Age-adjusted rate per 100,000, 2016-2020: 560.2
Malachi Jacobs // Shutterstock
54 / 55#2. Webster County
- Cancer rate per 100,000, 2016-2020: 820.4
- Age-adjusted rate per 100,000, 2016-2020: 537.1
Jay Wiberg // Shutterstock
55 / 55