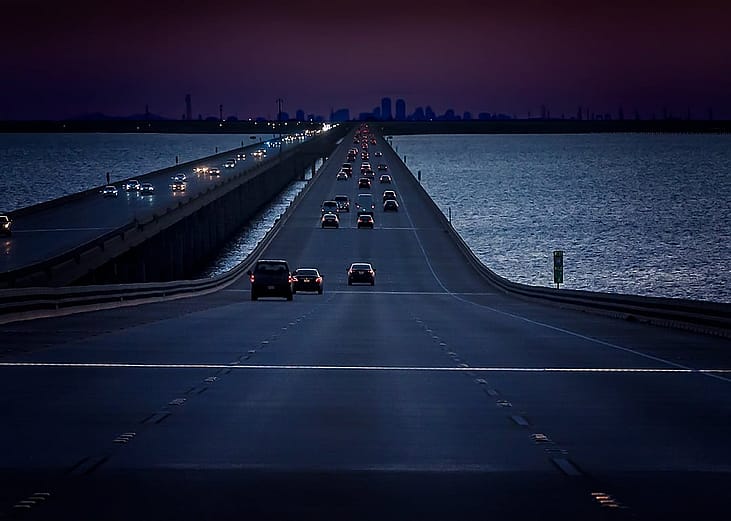
Few things are more frustrating than sitting in bumper-to-bumper traffic. You're late, you're stuck, and you're wasting time and gas. The average U.S. driver lost 42 hours to traffic delays in 2023, according to Inrix's latest Global Traffic Scorecard. While that's more than the average 40-hour workweek, it's a marked improvement from recent years. It's 18% lower than the 51 hours lost on average in 2022 and less than half of the 99 hours lost before the COVID-19 pandemic in 2019.
Still, trends across the country after the pandemic continue to contribute to congestion. Remote work has led to a longer stretch of high-traffic hours instead of the usual pre-9 a.m. and post-5 p.m. rush hour surges—and less predictable peaks at that. "On any given day, everybody might be going into the office and no one is expecting it," David Schrank, a senior research scientist at Texas A&M Transportation Institute, told The Hill in June 2024. "What if next Monday everybody gets called in? Then boom—it's gridlock." On top of that, truck-related congestion has increased with the continued rise of e-commerce and home delivery, with one truck equaling two to three cars on the road.
City planning plays a major role in managing traffic. Some have explored using tolls to unclog roadways. The famously congested arteries of New York City worsened post-pandemic with less space due to increased bike lanes and the rise of rideshare and outdoor dining. A $9 toll for daytime drivers heading into a portion of Manhattan went into effect on Jan. 5, 2025, aimed to reduce traffic by 80,000 cars. However, the plan could still see several legal challenges amid competing political pressures to improve the city's mass transit system and air quality. The notoriously congested Los Angeles is also considering congestion pricing, projecting to put a plan into practice by 2028. Though the City of Angels has a new mass transit system and is increasing bicycle lanes, its roads remain swollen.
To see where congestion is the biggest problem nationwide, Stacker ranked the 25 cities in the U.S. with the most time lost per driver due to congestion, according to data from Inrix. Stacker's analysis includes how much delays cost drivers based on median hourly wages in each metro area, per the Bureau of Labor Statistics, and comparisons to pre-COVID-19 pandemic hours lost, measured in 2019. Inrix calculated commute times by looking exclusively at the time it takes to get to and from major employment centers based on anonymized GPS data. Downtown speed is the speed at which a commuter should expect to travel 1 mile into the city's downtown or central business area during peak morning hours, and the first quarter of 2024 versus the first quarter of 2023 metric is the change in travel times during those two periods.
Read on to find out which city topped 100 hours lost on average per driver and how traffic patterns have started to take shape in 2024.
You may also like: Protect your vehicle from catalytic converter theft
#25. San Antonio
- Time lost per driver due to congestion, 2023: 35 hours
--- Change from pre-COVID: +17%
--- Change from Q1 2023 to Q1 2024: +1%
- 2023 cost per driver: $607
- 2023 city-wide cost: $625 million
- Average downtown speed: 19 mph
GagliardiPhotography // Shutterstock
2 / 25#24. New Orleans
- Time lost per driver due to congestion, 2023: 37 hours
--- Change from pre-COVID: +9%
--- Change from Q1 2023 to Q1 2024: -2%
- 2023 cost per driver: $641
- 2023 city-wide cost: $329 million
- Average downtown speed: 14 mph
Khairil Azhar Junos // Shutterstock
3 / 25#23. King of Prussia, Pennsylvania
- Time lost per driver due to congestion, 2023: 53 hours
--- Change from pre-COVID: -18%
--- Change from Q1 2023 to Q1 2024: -5%
- 2023 cost per driver: $918
- 2023 city-wide cost: $9 million
- Average downtown speed: 22 mph
Sean Xu // Shutterstock
4 / 25#22. Denver
- Time lost per driver due to congestion, 2023: 37 hours
--- Change from pre-COVID: -11%
--- Change from Q1 2023 to Q1 2024: -4%
- 2023 cost per driver: $640
- 2023 city-wide cost: $831 million
- Average downtown speed: 14 mph
GagliardiPhotography // Shutterstock
5 / 25arbsimages // Shutterstock
6 / 25#20. Stamford, Connecticut
- Time lost per driver due to congestion, 2023: 41 hours
--- Change from pre-COVID: +12%
--- Change from Q1 2023 to Q1 2024: -8%
- 2023 cost per driver: $706
- 2023 city-wide cost: $265 million
- Average downtown speed: 13 mph
Hrach Hovhannisyan // Shutterstock
7 / 25#19. Portland, Oregon
- Time lost per driver due to congestion, 2023: 39 hours
--- Change from pre-COVID: -8%
--- Change from Q1 2023 to Q1 2024: -2%
- 2023 cost per driver: $679
- 2023 city-wide cost: $665 million
- Average downtown speed: 15 mph
Theodore Trimmer // Shutterstock
8 / 25#18. Honolulu
- Time lost per driver due to congestion, 2023: 42 hours
--- Change from pre-COVID: -3%
--- Change from Q1 2023 to Q1 2024: -1%
- 2023 cost per driver: $739
- 2023 city-wide cost: $270 million
- Average downtown speed: 17 mph
travelview // Shutterstock
9 / 25#17. Dallas
- Time lost per driver due to congestion, 2023: 38 hours
--- Change from pre-COVID: +12%
--- Change from Q1 2023 to Q1 2024: -3%
- 2023 cost per driver: $658
- 2023 city-wide cost: $2.2 billion
- Average downtown speed: 16 mph
Grindstone Media Group // Shutterstock
10 / 25#16. Charlotte, North Carolina
- Time lost per driver due to congestion, 2023: 41 hours
--- Change from pre-COVID: -10%
--- Change from Q1 2023 to Q1 2024: -2%
- 2023 cost per driver: $711
- 2023 city-wide cost: $794 million
- Average downtown speed: 17 mph
You may also like: What you need to know about keyless ignition systems
4kclips // Shutterstock
11 / 25#15. Pittsburgh
- Time lost per driver due to congestion, 2023: 43 hours
--- Change from pre-COVID: -14%
--- Change from Q1 2023 to Q1 2024: -9%
- 2023 cost per driver: $749
- 2023 city-wide cost: $724 million
- Average downtown speed: 20 mph
Sean Pavone // Shutterstock
12 / 25#14. Baltimore
- Time lost per driver due to congestion, 2023: 44 hours
--- Change from pre-COVID: -24%
--- Change from Q1 2023 to Q1 2024: -7%
- 2023 cost per driver: $762
- 2023 city-wide cost: $905 million
- Average downtown speed: 13 mph
seand67 // Shutterstock
13 / 25#13. San Francisco
- Time lost per driver due to congestion, 2023: 45 hours
--- Change from pre-COVID: -6%
--- Change from Q1 2023 to Q1 2024: -6%
- 2023 cost per driver: $787
- 2023 city-wide cost: $1.3 billion
- Average downtown speed: 12 mph
Marcus E Jones // Shutterstock
14 / 25#12. Nashville, Tennessee
- Time lost per driver due to congestion, 2023: 56 hours
--- Change from pre-COVID: -8%
--- Change from Q1 2023 to Q1 2024: +1%
- 2023 cost per driver: $985
- 2023 city-wide cost: $852 million
- Average downtown speed: 20 mph
Nina Henry // Shutterstock
15 / 25#11. San Juan, Puerto Rico
- Time lost per driver due to congestion, 2023: 57 hours
--- Change from pre-COVID: +14%
--- Change from Q1 2023 to Q1 2024: -2%
- 2023 cost per driver: $994
- 2023 city-wide cost: $802 million
- Average downtown speed: 20 mph
You may also like: Everything you need to know about charging a Tesla
meunierd // Shutterstock
16 / 25#10. Seattle
- Time lost per driver due to congestion, 2023: 58 hours
--- Change from pre-COVID: -11%
--- Change from Q1 2023 to Q1 2024: -1%
- 2023 cost per driver: $1,010
- 2023 city-wide cost: $1.6 billion
- Average downtown speed: 17 mph
Sean Pavone // Shutterstock
17 / 25#9. Atlanta
- Time lost per driver due to congestion, 2023: 61 hours
--- Change from pre-COVID: -3%
--- Change from Q1 2023 to Q1 2024: -4%
- 2023 cost per driver: $1,066
- 2023 city-wide cost: $2.6 billion
- Average downtown speed: 16 mph
Sean Pavone // Shutterstock
18 / 25#8. Houston
- Time lost per driver due to congestion, 2023: 62 hours
--- Change from pre-COVID: +1%
--- Change from Q1 2023 to Q1 2024: -1%
- 2023 cost per driver: $1,082
- 2023 city-wide cost: $3.2 billion
- Average downtown speed: 17 mph
Sean Pavone // Shutterstock
19 / 25#7. Washington DC
- Time lost per driver due to congestion, 2023: 63 hours
--- Change from pre-COVID: -9%
--- Change from Q1 2023 to Q1 2024: -4%
- 2023 cost per driver: $1,095
- 2023 city-wide cost: $2.7 billion
- Average downtown speed: 11 mph
f11photo // Shutterstock
20 / 25#6. Philadelphia
- Time lost per driver due to congestion, 2023: 69 hours
--- Change from pre-COVID: +2%
--- Change from Q1 2023 to Q1 2024: -9%
- 2023 cost per driver: $1,209
- 2023 city-wide cost: $2.9 billion
- Average downtown speed: 11 mph
You may also like: Divided we drive: America's EV adoption gap
Bilanol // Shutterstock
21 / 25#5. Miami
- Time lost per driver due to congestion, 2023: 70 hours
--- Change from pre-COVID: +18%
--- Change from Q1 2023 to Q1 2024: -1%
- 2023 cost per driver: $1,219
- 2023 city-wide cost: $3.1 billion
- Average downtown speed: 14 mph
f11photo // Shutterstock
22 / 25#4. Boston
- Time lost per driver due to congestion, 2023: 88 hours
--- Change from pre-COVID: -1%
--- Change from Q1 2023 to Q1 2024: -10%
- 2023 cost per driver: $1,543
- 2023 city-wide cost: $2.9 billion
- Average downtown speed: 10 mph
JW.photography31 // Shutterstock
23 / 25#3. Los Angeles
- Time lost per driver due to congestion, 2023: 89 hours
--- Change from pre-COVID: -4%
--- Change from Q1 2023 to Q1 2024: -5%
- 2023 cost per driver: $1,545
- 2023 city-wide cost: $8.3 billion
- Average downtown speed: 19 mph
Dennis MacDonald // Shutterstock
24 / 25#2. Chicago
- Time lost per driver due to congestion, 2023: 96 hours
--- Change from pre-COVID: +18%
--- Change from Q1 2023 to Q1 2024: -8%
- 2023 cost per driver: $1,672
- 2023 city-wide cost: $6.1 billion
- Average downtown speed: 11 mph
Volodymyr TVERDOKHLIB // Shutterstock
25 / 25#1. New York City
- Time lost per driver due to congestion, 2023: 101 hours
--- Change from pre-COVID: +11%
--- Change from Q1 2023 to Q1 2024: -11%
- 2023 cost per driver: $1,762
- 2023 city-wide cost: $9.1 billion
- Average downtown speed: 11 mph
Story editing by Jaimie Etkin. Copy editing by Paris Close. Photo selection by Ania Antecka.
You may also like: The states with the most new car dealerships may surprise you