During the past winter, parts of California experienced massive amounts of rain and snow. Though it momentarily eased the frequent drought periods that had been affecting the state, the surge in rainfall flooded roads, knocked out power, and broke levees. Fueled by multiple converging atmospheric rivers, the state's infrastructure was not able to capture all of the excess water, meaning water shortages could again return during future dry spells.
Climate change can both intensify rainfall and also extend droughts. Warmer temperatures increase rates of evaporation, pulling more water from the ocean and causing more precipitation overall. Data indicates single-day precipitation extremes are happening more frequently. Conversely, more evaporation also dries out surface water and soil, leaving less fresh water available. Even as the moist air from oceans and other sources returns to land as rain, sleet, or snow, inconsistent wind patterns and currents mean it isn't distributed evenly. That's why even as some counties experienced their wettest year on record, others experienced their driest.
Nationwide, 43% of counties reported precipitation over the past year greater than their long-term average. A 1,000-year event dumped 25 inches of rainfall over 24 hours in Fort Lauderdale on April 13. Nevada desert regions experienced thunderstorms and heavy rain in June. Severe weather through the mid-Atlantic in August brought tennis ball-sized hail to West Virginia and softball-sized hail and flash flooding in Maryland.
Using data from the National Centers for Environmental Information, Stacker identified counties in Oklahoma that received the most precipitation from September 2022 to August 2023 compared to their average annual precipitation from 1901 to 2000. In the case of a tie, the amount of precipitation over the past year served as a tiebreaker.
Read on to see which counties reported more precipitation over the past year than usual.
You may also like: Counties in Oklahoma with the most car repair shops
#40. Kiowa County
- Precipitation over the past year: 27.7 inches
- Comparison to 1901-2000 average: 0.2 inches above average (#58 rainiest September-August period since 1895)
- Comparison to state's precipitation over past year: 6.3 inches below statewide average
#39. Woodward County
- Precipitation over the past year: 25.3 inches
- Comparison to 1901-2000 average: 0.3 inches above average (#59 rainiest September-August period since 1895)
- Comparison to state's precipitation over past year: 8.7 inches below statewide average
#38. Hughes County
- Precipitation over the past year: 41.4 inches
- Comparison to 1901-2000 average: 0.3 inches above average (#59 rainiest September-August period since 1895)
- Comparison to state's precipitation over past year: 7.5 inches above statewide average
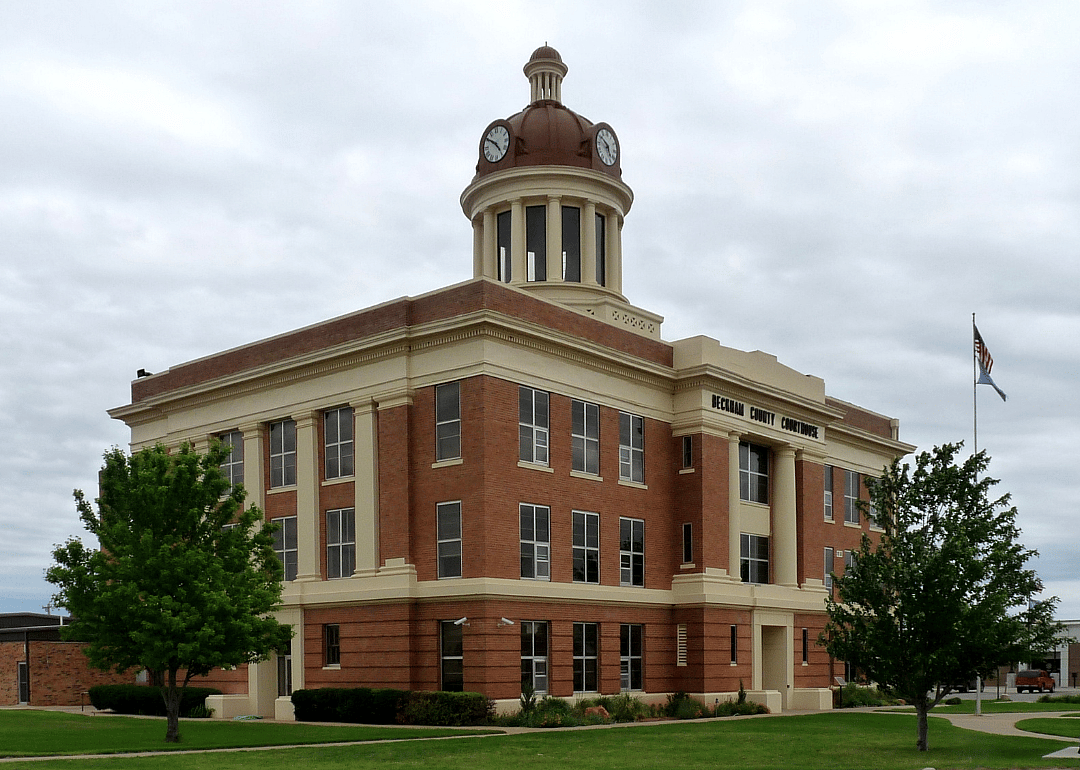
#37. Beckham County
- Precipitation over the past year: 25.0 inches
- Comparison to 1901-2000 average: 0.4 inches above average (#56 rainiest September-August period since 1895)
- Comparison to state's precipitation over past year: 9.0 inches below statewide average
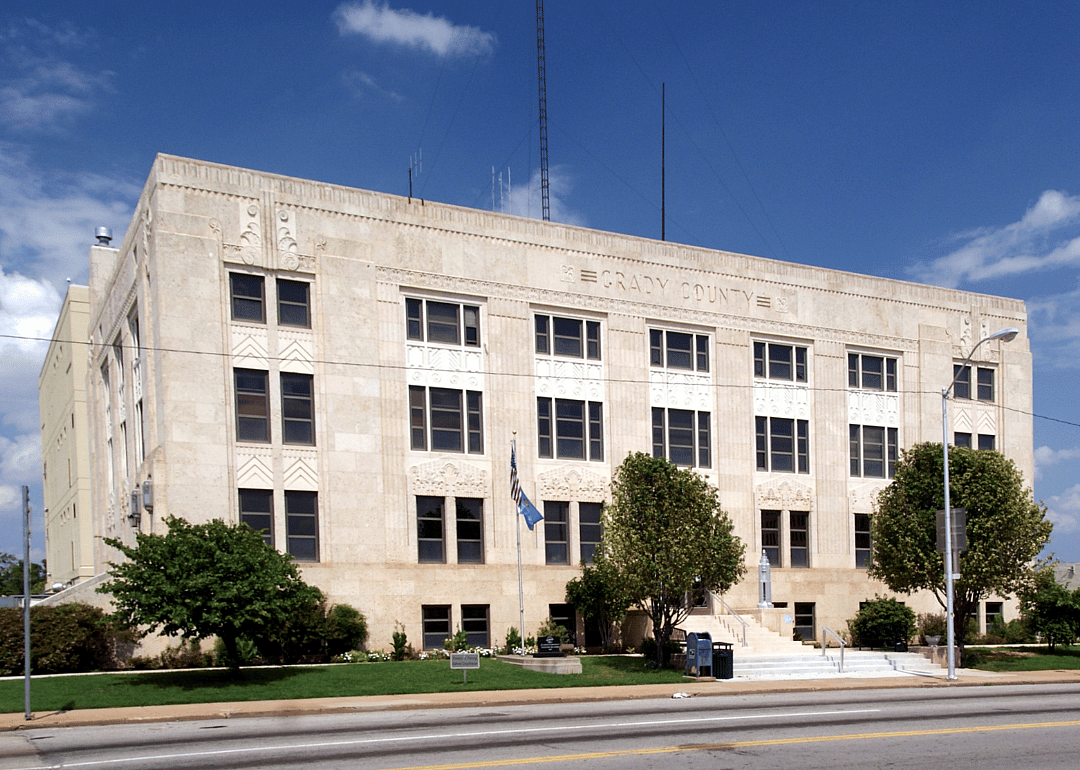
#36. Grady County
- Precipitation over the past year: 32.9 inches
- Comparison to 1901-2000 average: 0.5 inches above average (#59 rainiest September-August period since 1895)
- Comparison to state's precipitation over past year: 1.0 inches below statewide average
You may also like: Counties with the most pre-war homes in Oklahoma
#35. Cimarron County
- Precipitation over the past year: 17.1 inches
- Comparison to 1901-2000 average: 0.5 inches above average (#56 rainiest September-August period since 1895)
- Comparison to state's precipitation over past year: 16.9 inches below statewide average
#34. Creek County
- Precipitation over the past year: 38.1 inches
- Comparison to 1901-2000 average: 0.5 inches above average (#58 rainiest September-August period since 1895)
- Comparison to state's precipitation over past year: 4.1 inches above statewide average
#33. Pushmataha County
- Precipitation over the past year: 49.1 inches
- Comparison to 1901-2000 average: 0.6 inches above average (#56 rainiest September-August period since 1895)
- Comparison to state's precipitation over past year: 15.1 inches above statewide average
Kit Leong // Shutterstock
9 / 40#32. Woods County
- Precipitation over the past year: 26.4 inches
- Comparison to 1901-2000 average: 0.6 inches above average (#63 rainiest September-August period since 1895)
- Comparison to state's precipitation over past year: 7.6 inches below statewide average
Mohammad Fuad Anshori // Shutterstock
10 / 40#31. Stephens County
- Precipitation over the past year: 33.8 inches
- Comparison to 1901-2000 average: 0.8 inches above average (#58 rainiest September-August period since 1895)
- Comparison to state's precipitation over past year: 0.1 inches below statewide average
You may also like: Highest-rated breweries in Oklahoma
#30. Dewey County
- Precipitation over the past year: 27.3 inches
- Comparison to 1901-2000 average: 0.9 inches above average (#53 rainiest September-August period since 1895)
- Comparison to state's precipitation over past year: 6.7 inches below statewide average
#29. Garvin County
- Precipitation over the past year: 36.7 inches
- Comparison to 1901-2000 average: 0.9 inches above average (#59 rainiest September-August period since 1895)
- Comparison to state's precipitation over past year: 2.8 inches above statewide average
Sabrina Janelle Gordon // Shutterstock
13 / 40#28. Mayes County
- Precipitation over the past year: 42.9 inches
- Comparison to 1901-2000 average: 0.9 inches above average (#57 rainiest September-August period since 1895)
- Comparison to state's precipitation over past year: 9.0 inches above statewide average
#27. Roger Mills County
- Precipitation over the past year: 26.1 inches
- Comparison to 1901-2000 average: 1.5 inches above average (#42 rainiest September-August period since 1895)
- Comparison to state's precipitation over past year: 7.9 inches below statewide average
Holly Cates // Shutterstock
15 / 40#26. Seminole County
- Precipitation over the past year: 40.0 inches
- Comparison to 1901-2000 average: 1.8 inches above average (#50 rainiest September-August period since 1895)
- Comparison to state's precipitation over past year: 6.0 inches above statewide average
You may also like: Biggest exports from Oklahoma
#25. Texas County
- Precipitation over the past year: 20.0 inches
- Comparison to 1901-2000 average: 1.8 inches above average (#42 rainiest September-August period since 1895)
- Comparison to state's precipitation over past year: 14.0 inches below statewide average
#24. Cherokee County
- Precipitation over the past year: 45.5 inches
- Comparison to 1901-2000 average: 1.9 inches above average (#54 rainiest September-August period since 1895)
- Comparison to state's precipitation over past year: 11.5 inches above statewide average
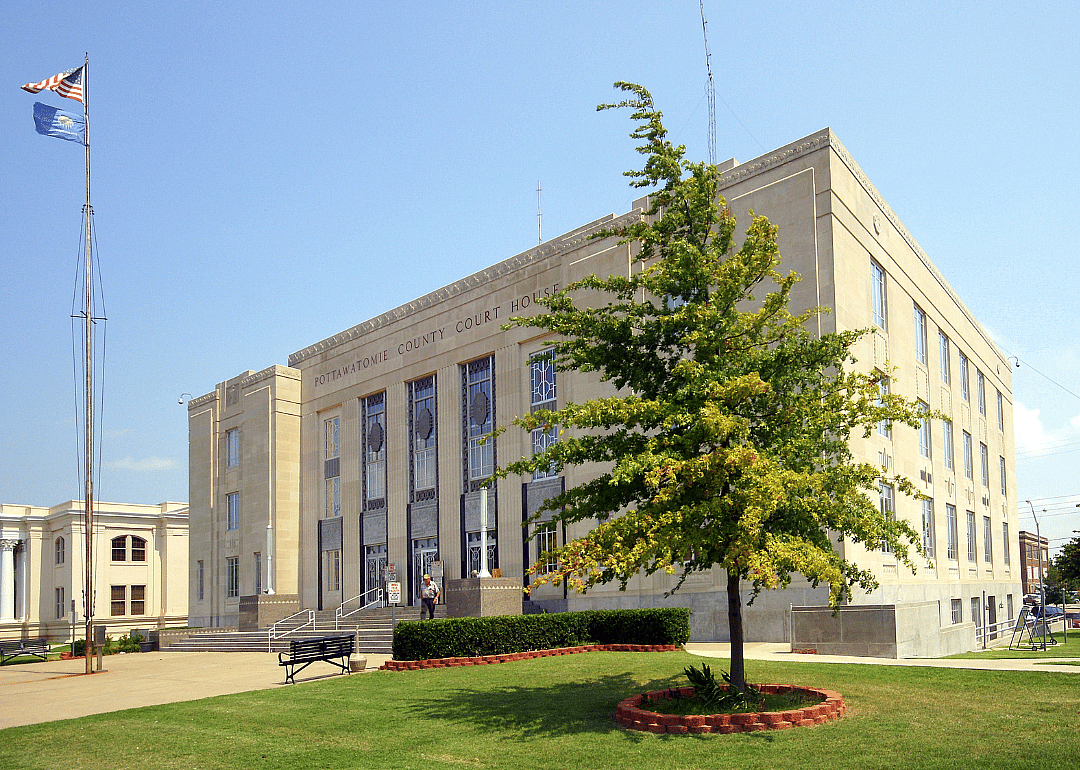
#23. Pottawatomie County
- Precipitation over the past year: 38.4 inches
- Comparison to 1901-2000 average: 1.9 inches above average (#51 rainiest September-August period since 1895)
- Comparison to state's precipitation over past year: 4.4 inches above statewide average
Vineyard Perspective // Shutterstock
19 / 40#22. Lincoln County
- Precipitation over the past year: 37.9 inches
- Comparison to 1901-2000 average: 2.1 inches above average (#46 rainiest September-August period since 1895)
- Comparison to state's precipitation over past year: 3.9 inches above statewide average
RaksyBH // Shutterstock
20 / 40#21. Choctaw County
- Precipitation over the past year: 47.4 inches
- Comparison to 1901-2000 average: 2.1 inches above average (#52 rainiest September-August period since 1895)
- Comparison to state's precipitation over past year: 13.4 inches above statewide average
You may also like: Best public colleges in Oklahoma
#20. Caddo County
- Precipitation over the past year: 32.4 inches
- Comparison to 1901-2000 average: 2.1 inches above average (#44 rainiest September-August period since 1895)
- Comparison to state's precipitation over past year: 1.5 inches below statewide average
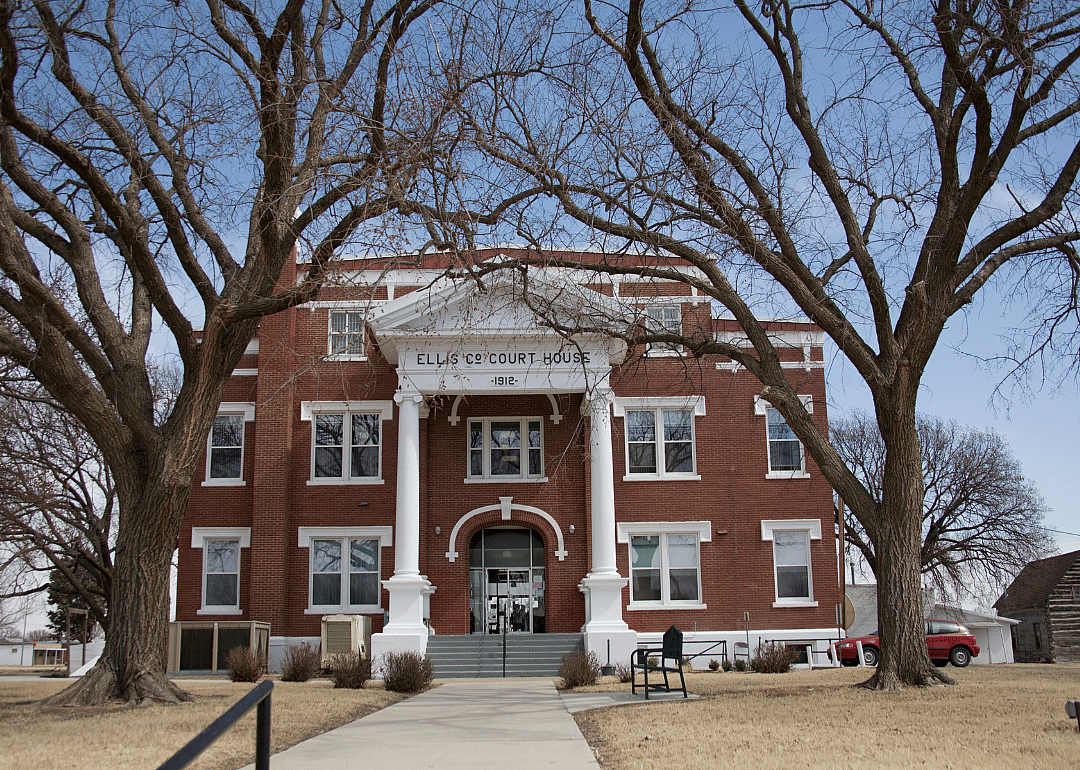
#19. Ellis County
- Precipitation over the past year: 25.8 inches
- Comparison to 1901-2000 average: 2.3 inches above average (#39 rainiest September-August period since 1895)
- Comparison to state's precipitation over past year: 8.2 inches below statewide average
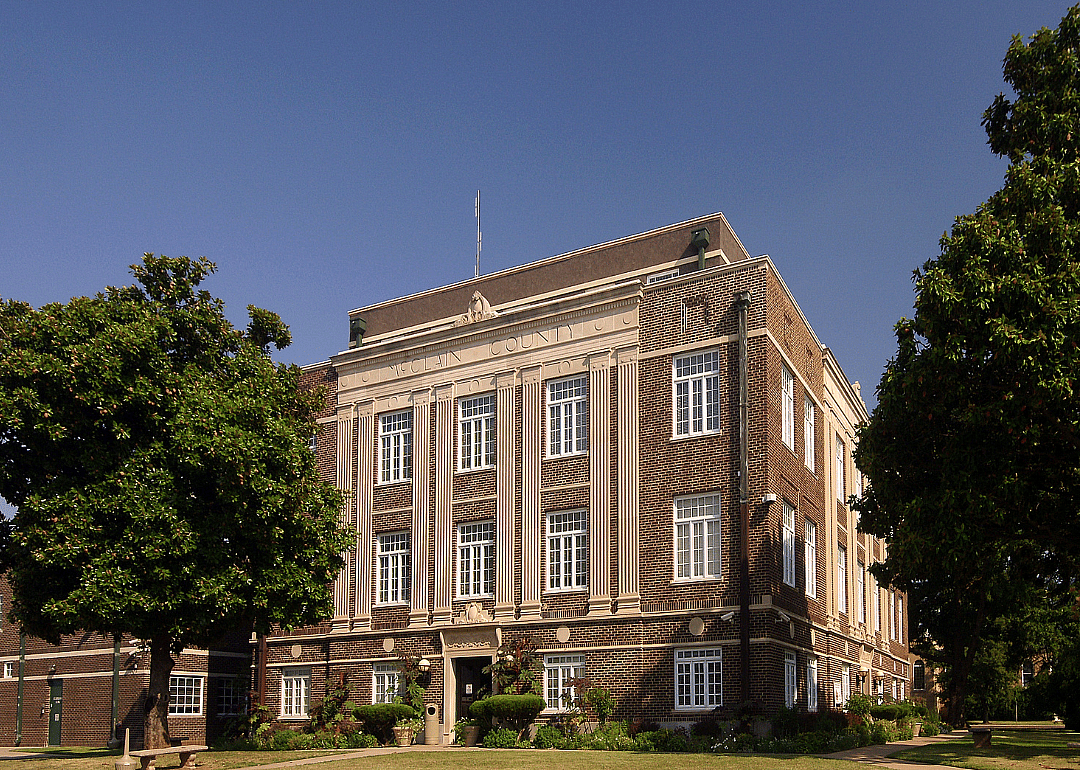
#18. McClain County
- Precipitation over the past year: 36.9 inches
- Comparison to 1901-2000 average: 2.4 inches above average (#46 rainiest September-August period since 1895)
- Comparison to state's precipitation over past year: 2.9 inches above statewide average
RaksyBH // Shutterstock
24 / 40#17. Harper County
- Precipitation over the past year: 26.0 inches
- Comparison to 1901-2000 average: 2.8 inches above average (#38 rainiest September-August period since 1895)
- Comparison to state's precipitation over past year: 8.0 inches below statewide average
#16. Haskell County
- Precipitation over the past year: 47.1 inches
- Comparison to 1901-2000 average: 2.8 inches above average (#48 rainiest September-August period since 1895)
- Comparison to state's precipitation over past year: 13.1 inches above statewide average
You may also like: Hottest Octobers in Oklahoma since 1895
Sabrina Janelle Gordon // Shutterstock
26 / 40#15. Kingfisher County
- Precipitation over the past year: 32.0 inches
- Comparison to 1901-2000 average: 2.8 inches above average (#42 rainiest September-August period since 1895)
- Comparison to state's precipitation over past year: 2.0 inches below statewide average
#14. Latimer County
- Precipitation over the past year: 49.5 inches
- Comparison to 1901-2000 average: 2.9 inches above average (#47 rainiest September-August period since 1895)
- Comparison to state's precipitation over past year: 15.6 inches above statewide average
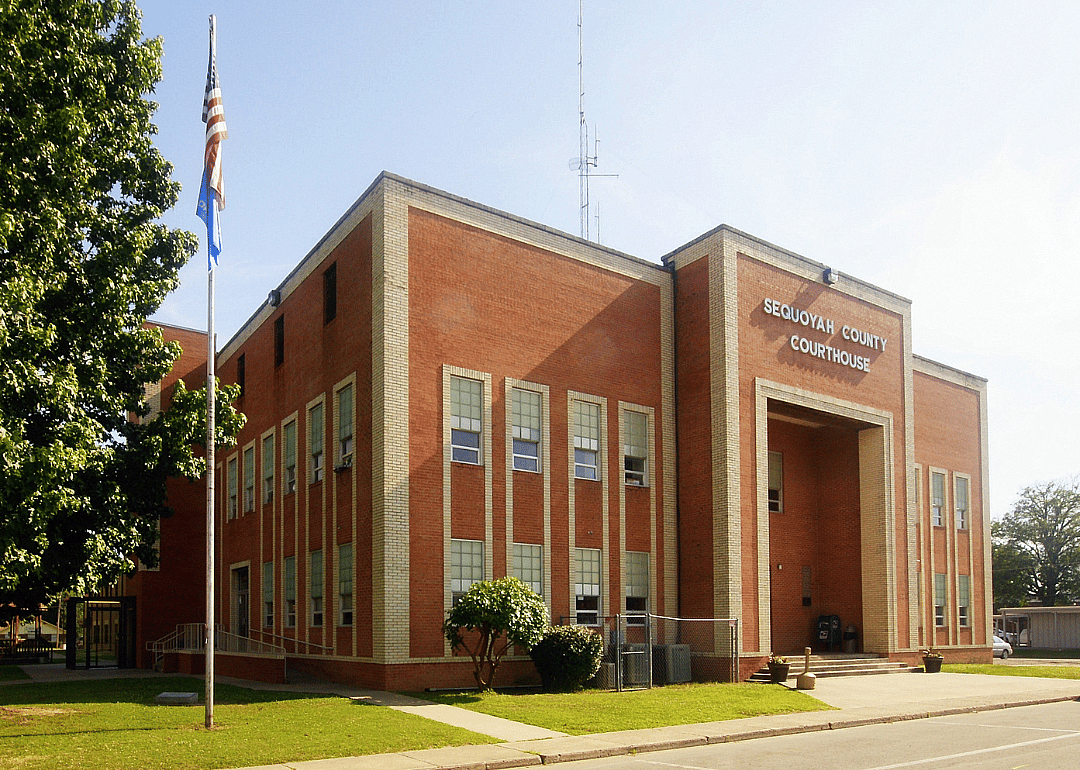
#13. Sequoyah County
- Precipitation over the past year: 47.8 inches
- Comparison to 1901-2000 average: 3.0 inches above average (#48 rainiest September-August period since 1895)
- Comparison to state's precipitation over past year: 13.9 inches above statewide average
#12. Cleveland County
- Precipitation over the past year: 37.7 inches
- Comparison to 1901-2000 average: 3.0 inches above average (#41 rainiest September-August period since 1895)
- Comparison to state's precipitation over past year: 3.8 inches above statewide average
Dee Browning // Shutterstock
31 / 40#10. Adair County
- Precipitation over the past year: 48.4 inches
- Comparison to 1901-2000 average: 3.3 inches above average (#51 rainiest September-August period since 1895)
- Comparison to state's precipitation over past year: 14.5 inches above statewide average
Richard G Smith // Shutterstock
32 / 40#9. Blaine County
- Precipitation over the past year: 31.9 inches
- Comparison to 1901-2000 average: 3.4 inches above average (#35 rainiest September-August period since 1895)
- Comparison to state's precipitation over past year: 2.1 inches below statewide average
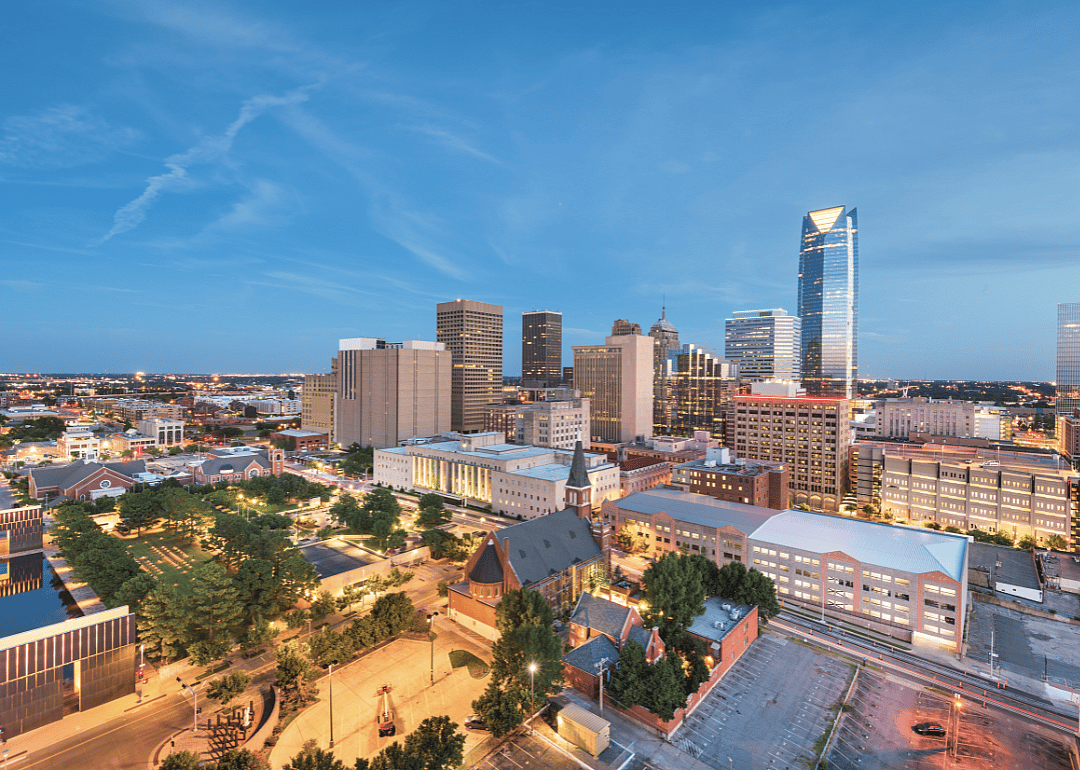
#8. Oklahoma County
- Precipitation over the past year: 36.5 inches
- Comparison to 1901-2000 average: 3.5 inches above average (#37 rainiest September-August period since 1895)
- Comparison to state's precipitation over past year: 2.5 inches above statewide average
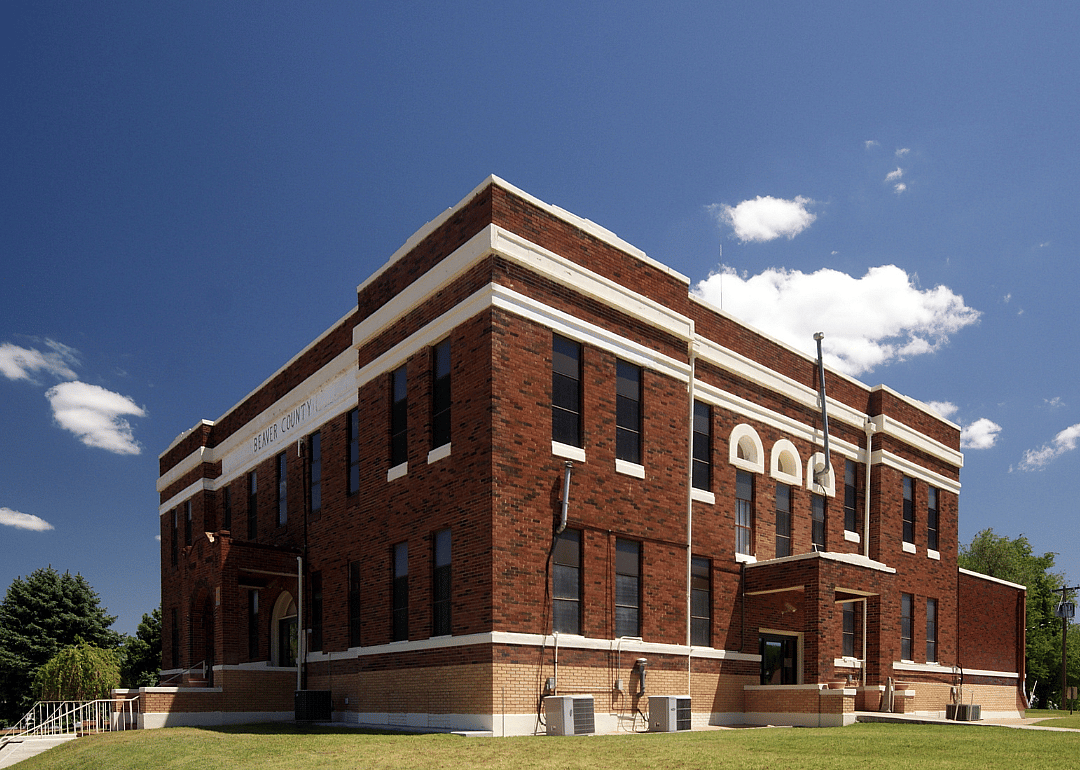
#7. Beaver County
- Precipitation over the past year: 24.6 inches
- Comparison to 1901-2000 average: 4.1 inches above average (#24 rainiest September-August period since 1895)
- Comparison to state's precipitation over past year: 9.4 inches below statewide average
#5. Okfuskee County
- Precipitation over the past year: 42.8 inches
- Comparison to 1901-2000 average: 4.2 inches above average (#43 rainiest September-August period since 1895)
- Comparison to state's precipitation over past year: 8.8 inches above statewide average
#4. McCurtain County
- Precipitation over the past year: 53.7 inches
- Comparison to 1901-2000 average: 4.2 inches above average (#42 rainiest September-August period since 1895)
- Comparison to state's precipitation over past year: 19.7 inches above statewide average
#3. Canadian County
- Precipitation over the past year: 35.2 inches
- Comparison to 1901-2000 average: 4.4 inches above average (#32 rainiest September-August period since 1895)
- Comparison to state's precipitation over past year: 1.2 inches above statewide average
#2. Le Flore County
- Precipitation over the past year: 53.3 inches
- Comparison to 1901-2000 average: 5.9 inches above average (#35 rainiest September-August period since 1895)
- Comparison to state's precipitation over past year: 19.3 inches above statewide average
Andrey Bayda // Shutterstock
40 / 40#1. Washita County
- Precipitation over the past year: 33.3 inches
- Comparison to 1901-2000 average: 6.3 inches above average (#21 rainiest September-August period since 1895)
- Comparison to state's precipitation over past year: 0.7 inches below statewide average
This story features data reporting and writing by Emma Rubin, and is part of a series utilizing data automation across 44 states.
You may also like: Cities with the most expensive homes in Oklahoma