The 38 greenest cities in North America

·Gabrielle Saulsbery

Wang An Qi // Shutterstock

Greening a city isn't just good press. According to the U.S. Federal Emergency Management Agency, a more climate-conscious city supports economic growth by creating jobs, increasing property values, and improving public health factors such as better disease outcomes. By committing to improving air and water quality, cities can reduce their residents' exposure to harmful pollutants. Designing more green spaces can welcome cooler summers, reduce the risk of heat-related illness; and bring forth additional recreation spaces to the community, increasing opportunities for both physical activity and social engagement.

In its June 2021 report on building resilient nature-based local communities, FEMA reported that Los Angeles added more than 2,000 jobs due to a $166 million investment in nature-based solutions from 2012 to 2014. Such greening investments have demonstrated immediate and long-term benefits to the environment and populace alike. Another notable example from Massachusetts showed that, rather than build a costly treatment facility for the Quabbin and Wachusett Reservoirs, the Massachusetts Water Resources Authority instead invested $130 million on nature-based solutions to protect the more than 20,000 acres of watershed that drain into the reservoirs. The move saved an estimated $4 million per year on maintenance costs for a treatment facility and kept local drinking water clean in the bargain.

Nature-based solutions are defined as sustainable planning, design, environmental management, and engineering practices that weave natural features or processes into the built environment. These solutions promote adaptation and resilience, enlist natural solutions to combat climate change, reduce flood risks, restore and protect wetlands, and more.

So which cities are prioritizing policies toward a healthier and more sustainable environment? Calgary.com compiled a list of the greenest cities in North America according to the Carbon Disclosure Project, an international nonprofit that tracks the environmental impact of companies and municipalities around the world. The cities in this list were part of the CDP's 2021 A List, an annual ranking of cities based on their climate initiatives. They include two districts (Washington, D.C. and the district of Saanich, British Columbia) and are listed in alphabetical order.

To make the list, each city must have a publicly available climate action plan, including emissions reduction and renewable energy targets. The cities were also required to complete climate risk and vulnerability assessments and show measured progress toward achieving their goals. More than 1,000 cities worldwide report to the CDP, 95 of which made the A List. The following are the greenest.

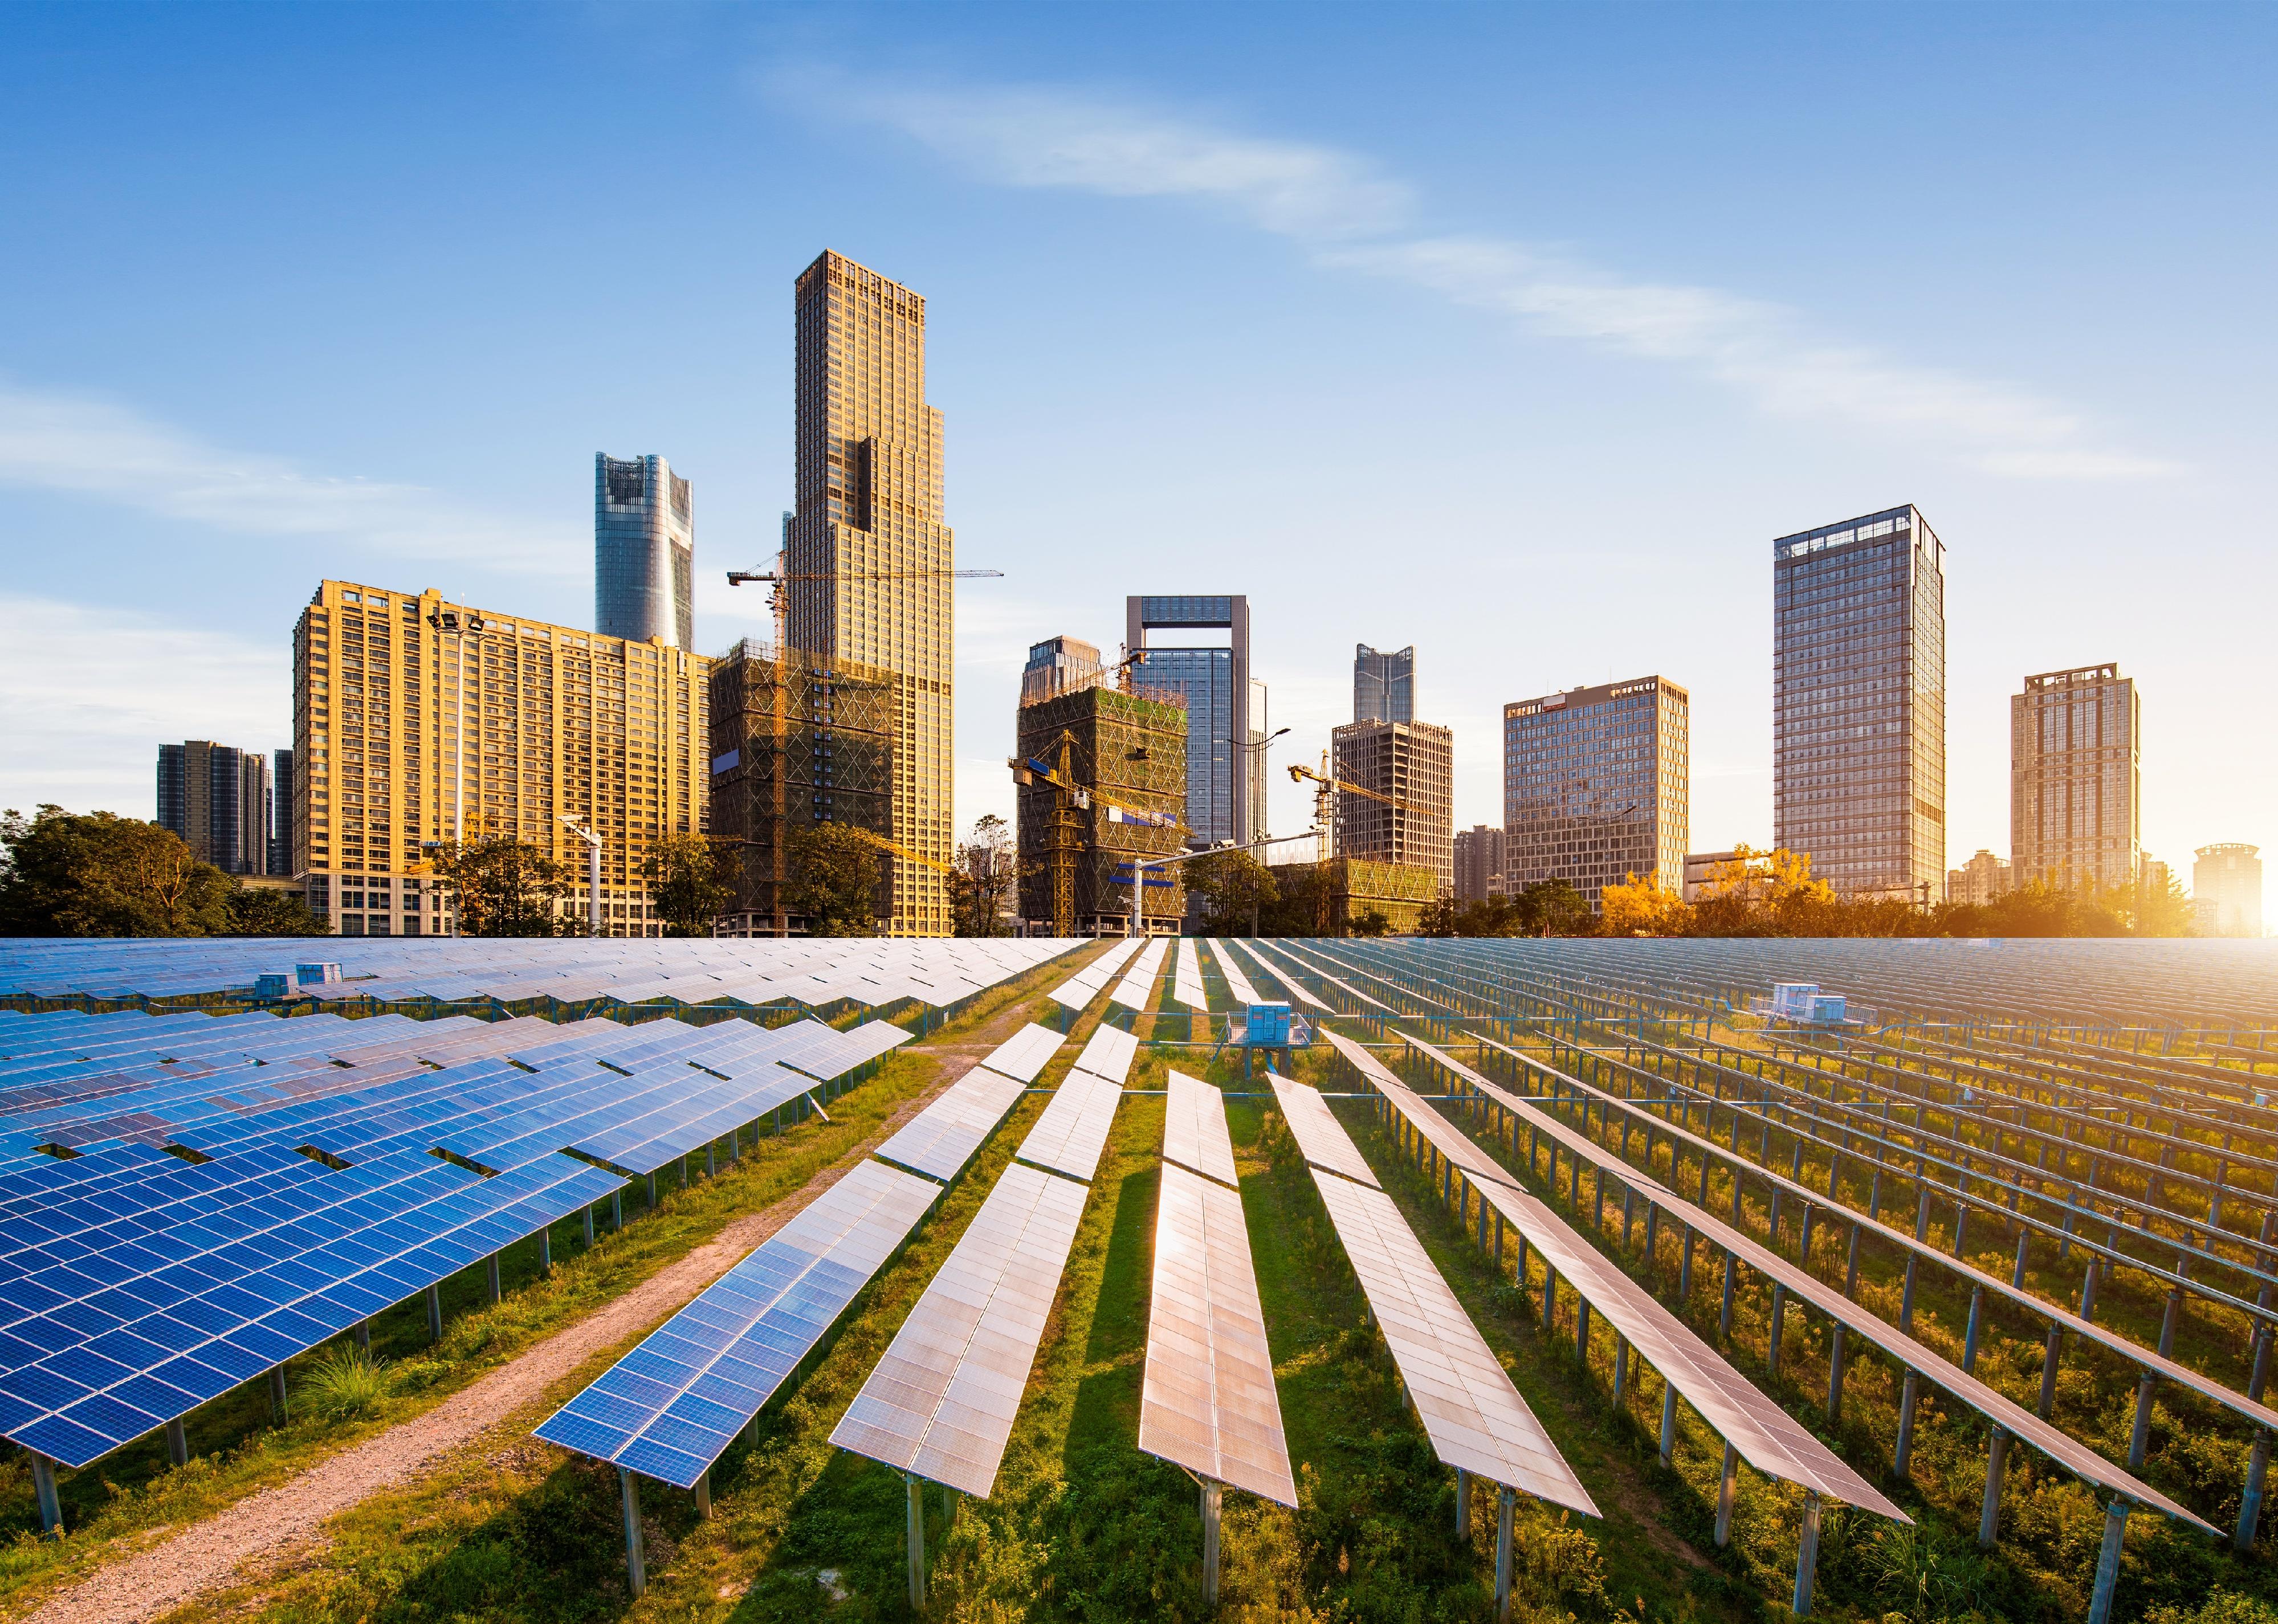
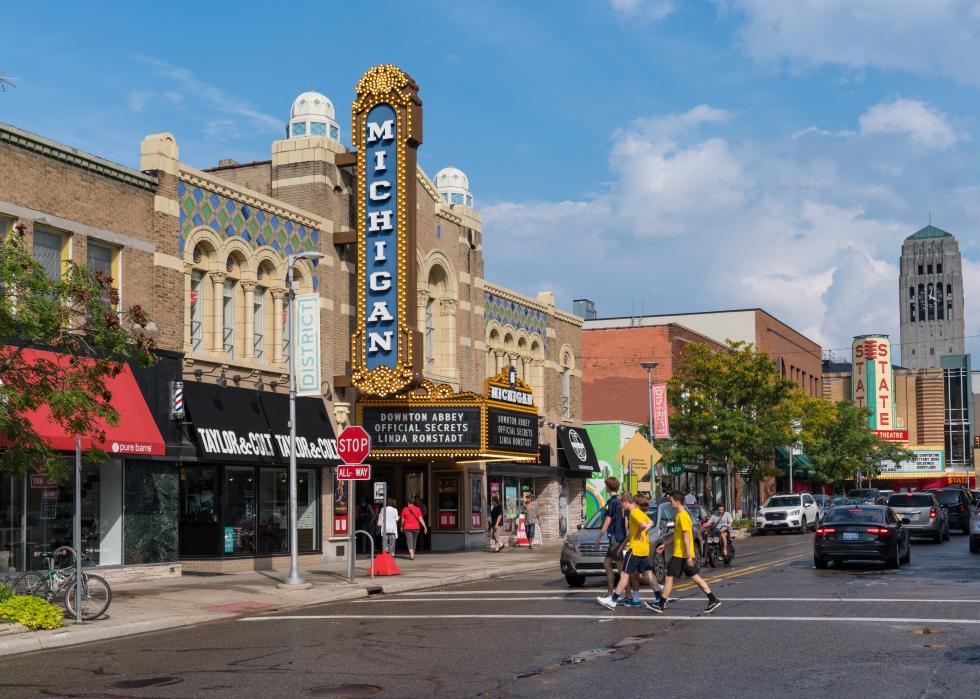
Historic Michigan Theater in Downtown, Ann Arbor

Paul Brady Photography // Shutterstock

1 / 38

Ann Arbor, Michigan

- Energy breakdown:
--- Coal: 49.7%
--- Gas: 17.2%
--- Oil: 0.3%
--- Nuclear: 21.1%
--- Hydro: 0.3%
--- Bioenergy (biomass and biofuels): 1.4%
--- Wind: 9.8%
--- Geothermal: 0.0%
--- Solar (photovoltaic and thermal): 0.0%
--- Waste to energy (excluding biomass component): 0.3%

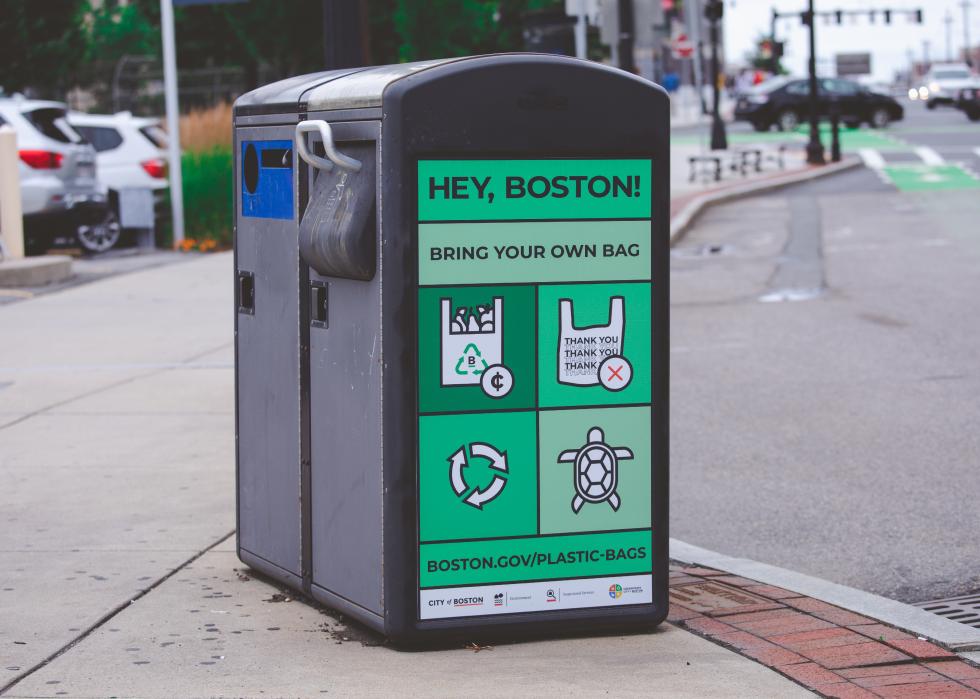
Recycling bins and trash can in Boston, Massachusetts

2p2play // Shutterstock

2 / 38

Boston, Massachusetts

- Energy breakdown:
--- Coal: 0.4%
--- Gas: 39.0%
--- Oil: 0.3%
--- Nuclear: 25.0%
--- Hydro: 7.0%
--- Bioenergy (biomass and biofuels): 6.0%
--- Wind: 3.0%
--- Geothermal: 0.0%
--- Solar (photovoltaic and thermal): 0.0%
--- Waste to energy (excluding biomass component): 0.0%

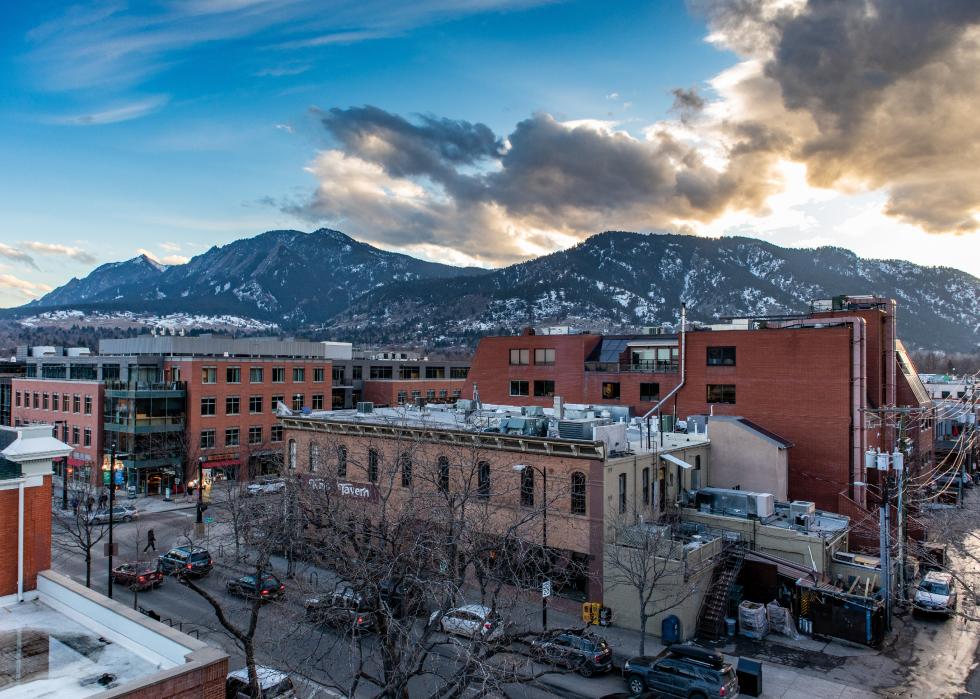
Aerial View Of Boulder, Colorado

MIRAJA DESIGN // Shutterstock

3 / 38

Boulder, Colorado

- Energy breakdown:
--- Coal: 33.0%
--- Gas: 37.0%
--- Oil: 0.0%
--- Nuclear: 0.0%
--- Hydro: 1.0%
--- Bioenergy (biomass and biofuels): 0.0%
--- Wind: 25.0%
--- Geothermal: 0.0%
--- Solar (photovoltaic and thermal): 0.0%
--- Waste to energy (excluding biomass component): 4.0%

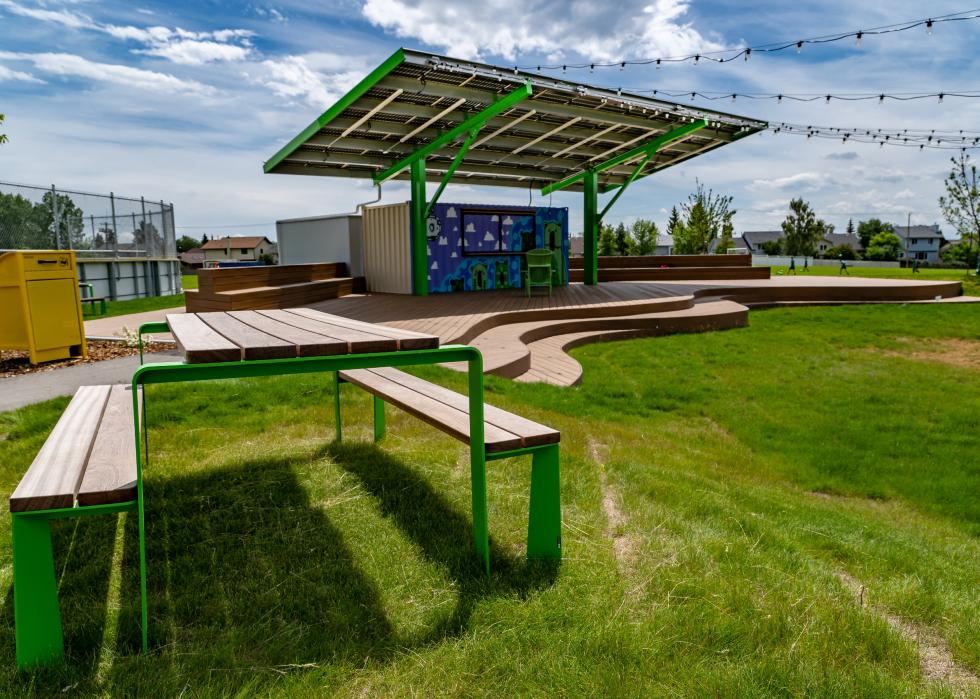
Solar rooftop amphitheater with composite decking and picnic tables at a public park

Ramon Cliff // Shutterstock

4 / 38

Calgary, Alberta

- Energy breakdown:
--- Coal: 36.0%
--- Gas: 48.0%
--- Oil: 0.0%
--- Nuclear: 0.0%
--- Hydro: 6.0%
--- Bioenergy (biomass and biofuels): 0.0%
--- Wind: 9.0%
--- Geothermal: 0.0%
--- Solar (photovoltaic and thermal): 0.0%
--- Waste to energy (excluding biomass component): 0.0%

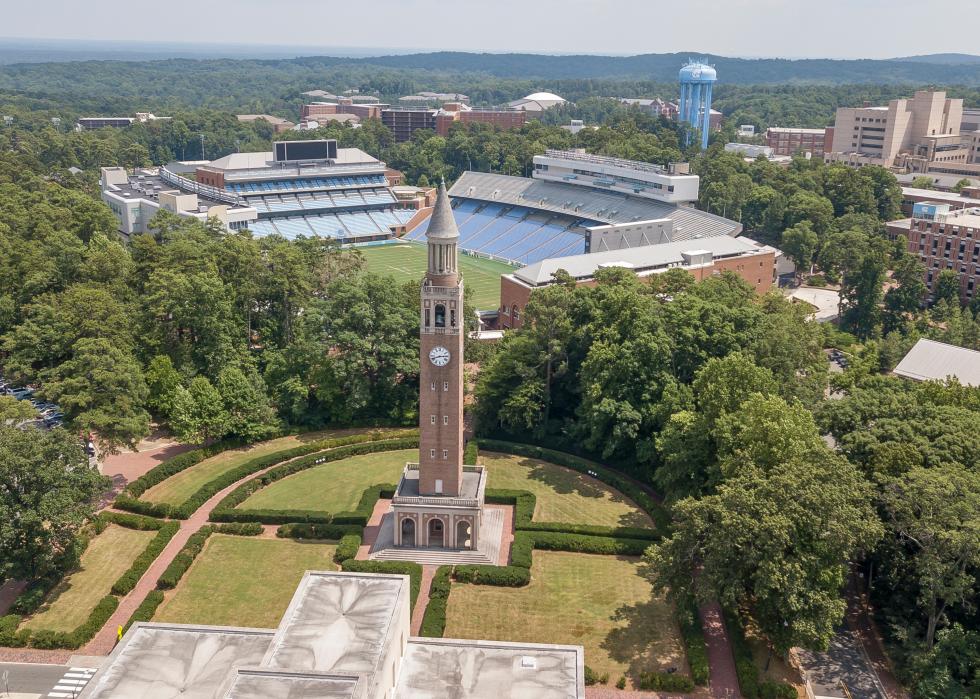
Kenan Memorial Stadium in Chapel Hill

Grindstone Media Group // Shutterstock

5 / 38

Chapel Hill, North Carolina

- Energy breakdown:
--- Coal: 22.0%
--- Gas: 39.0%
--- Oil: 0.0%
--- Nuclear: 37.0%
--- Hydro: 0.5%
--- Bioenergy (biomass and biofuels): 0.0%
--- Wind: 0.5%
--- Geothermal: 0.0%
--- Solar (photovoltaic and thermal): 0.0%
--- Waste to energy (excluding biomass component): 1.0%

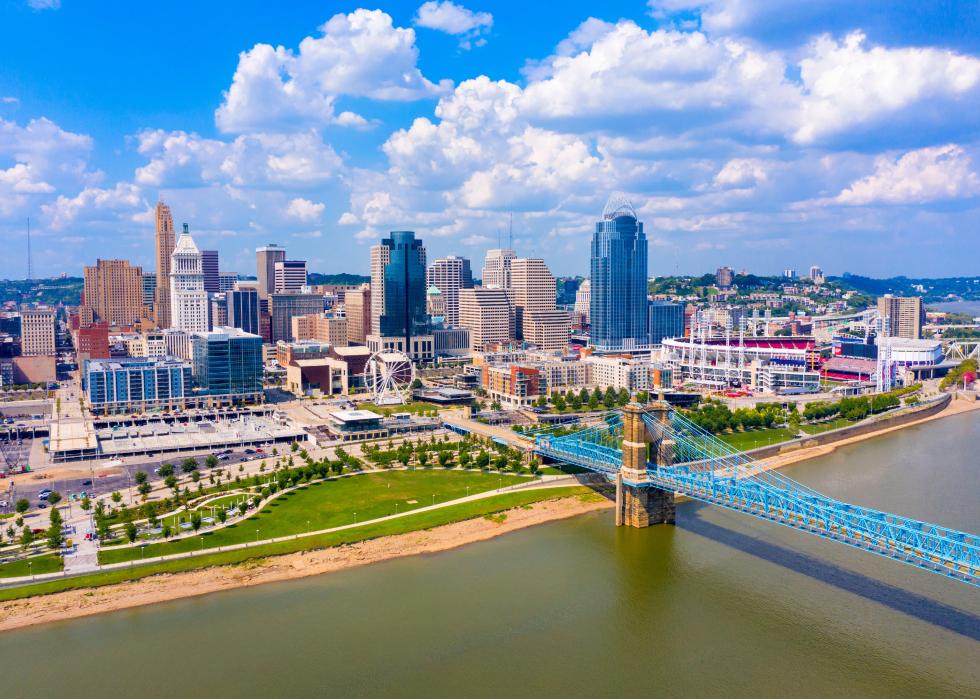
Cincinnati, Ohio skyline with John Roebling bridge

Agnieszka Gaul // Shutterstock

6 / 38

Cincinnati, Ohio

- Energy breakdown:
--- Coal: 49.8%
--- Gas: 16.7%
--- Oil: 0.4%
--- Nuclear: 27.6%
--- Hydro: 0.9%
--- Bioenergy (biomass and biofuels): 0.6%
--- Wind: 3.2%
--- Geothermal: 0.0%
--- Solar (photovoltaic and thermal): 0.0%
--- Waste to energy (excluding biomass component): 0.1%

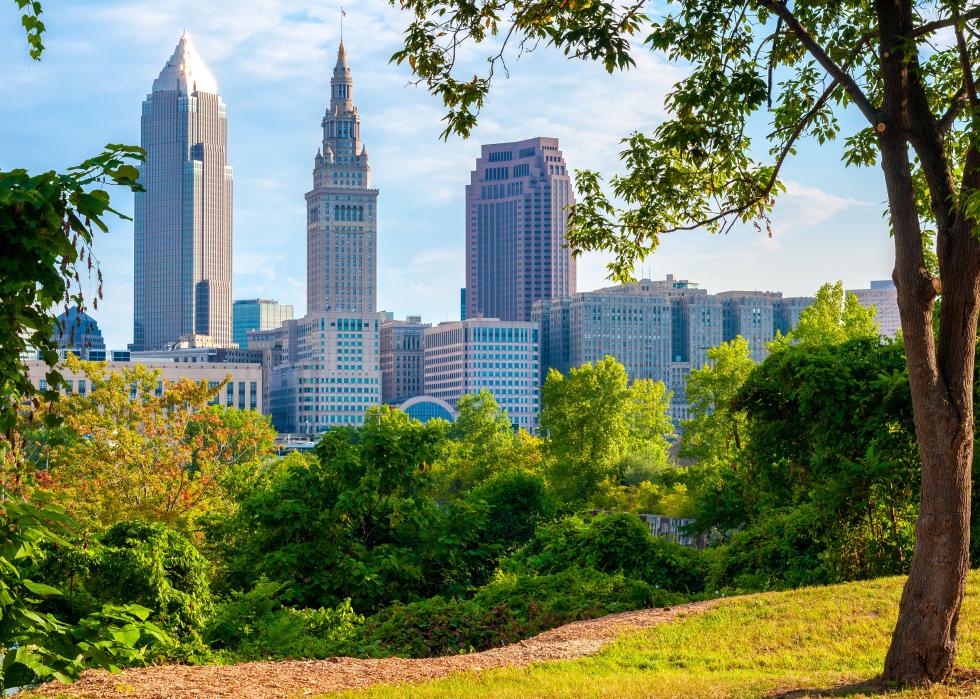
Cleveland, Ohio, in morning light framed by trees in a small park

Kenneth Sponsler // Shutterstock

7 / 38

Cleveland, Ohio

- Energy breakdown:
--- Coal: 34.9%
--- Gas: 25.3%
--- Oil: 0.0%
--- Nuclear: 30.5%
--- Hydro: 5.7%
--- Bioenergy (biomass and biofuels): 0.4%
--- Wind: 2.3%
--- Geothermal: 0.0%
--- Solar (photovoltaic and thermal): 0.0%
--- Waste to energy (excluding biomass component): 0.0%

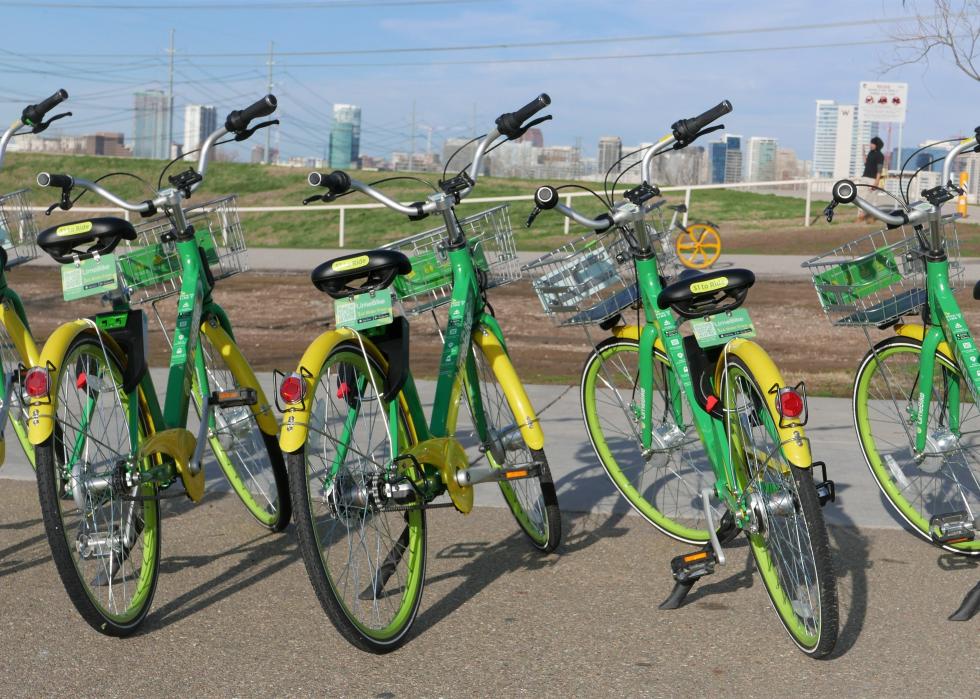
LimeBike parked in a row in Dallas

Dorti // Shutterstock

8 / 38

Dallas, Texas

- Energy breakdown:
--- Coal: 18.0%
--- Gas: 45.7%
--- Oil: 0.0%
--- Nuclear: 11.0%
--- Hydro: 0.2%
--- Bioenergy (biomass and biofuels): 0.1%
--- Wind: 23.0%
--- Geothermal: 0.0%
--- Solar (photovoltaic and thermal): 0.0%
--- Waste to energy (excluding biomass component): 2.0%

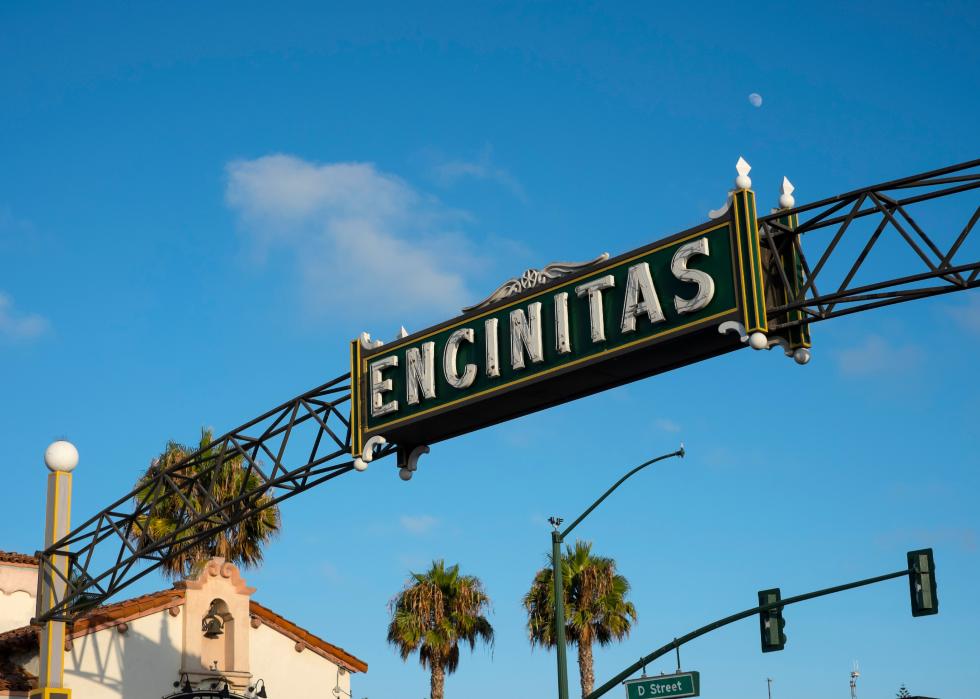
Encinitas sign and trees

DBSOCAL // Shutterstock

9 / 38

Encinitas, California

- Energy breakdown:
--- Coal: 0.0%
--- Gas: 54.0%
--- Oil: 0.0%
--- Nuclear: 0.0%
--- Hydro: 0.0%
--- Bioenergy (biomass and biofuels): 2.0%
--- Wind: 16.0%
--- Geothermal: 0.0%
--- Solar (photovoltaic and thermal): 0.0%
--- Waste to energy (excluding biomass component): 18.0%

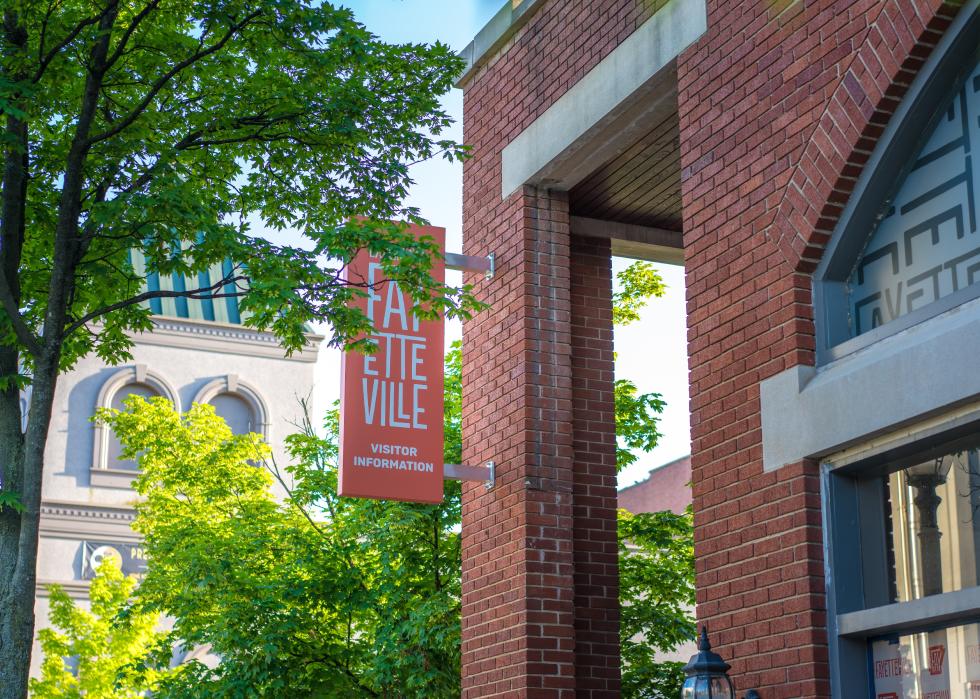
Fayetteville tourist visitor information center storefront view

shuttersv // Shutterstock

10 / 38

Fayetteville, Arkansas

- Energy breakdown:
--- Coal: 22.3%
--- Gas: 44.2%
--- Oil: 1.1%
--- Nuclear: 0.0%
--- Hydro: 5.0%
--- Bioenergy (biomass and biofuels): 1.5%
--- Wind: 25.1%
--- Geothermal: 0.0%
--- Solar (photovoltaic and thermal): 0.0%
--- Waste to energy (excluding biomass component): 0.4%

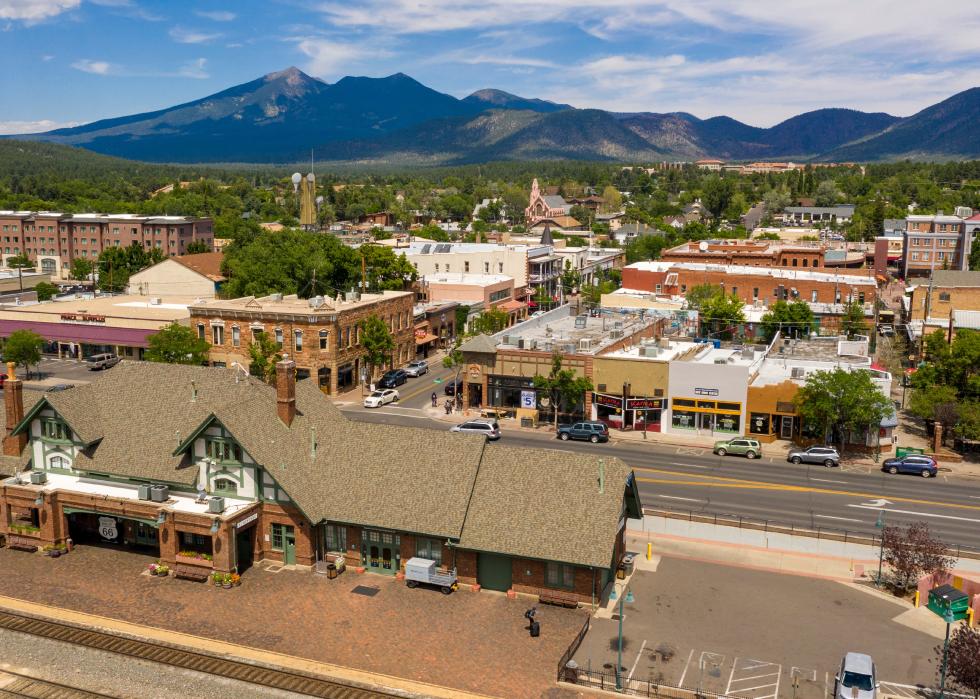
Traffic and the train station on Route 66 in Flagstaff, Arizona

Real Window Creative // Shutterstock

11 / 38

Flagstaff, Arizona

- Energy breakdown:
--- Coal: 20.8%
--- Gas: 35.0%
--- Oil: 0.0%
--- Nuclear: 29.2%
--- Hydro: 0.0%
--- Bioenergy (biomass and biofuels): 0.5%
--- Wind: 1.7%
--- Geothermal: 0.3%
--- Solar (photovoltaic and thermal): 0.3%
--- Waste to energy (excluding biomass component): 12.2%

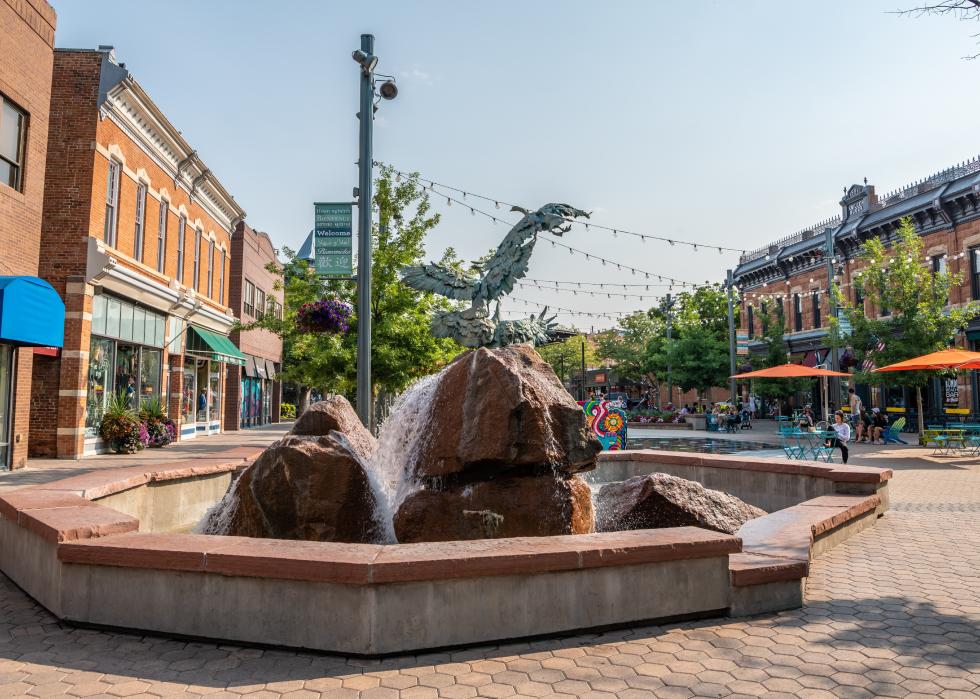
Eagle statue and fountain in Fort Collins

Page Light Studios // Shutterstock

12 / 38

Fort Collins, Colorado

- Energy breakdown:
--- Coal: 64.2%
--- Gas: 0.0%
--- Oil: 0.0%
--- Nuclear: 0.0%
--- Hydro: 19.3%
--- Bioenergy (biomass and biofuels): 0.0%
--- Wind: 11.8%
--- Geothermal: 0.0%
--- Solar (photovoltaic and thermal): 0.0%
--- Waste to energy (excluding biomass component): 0.6%

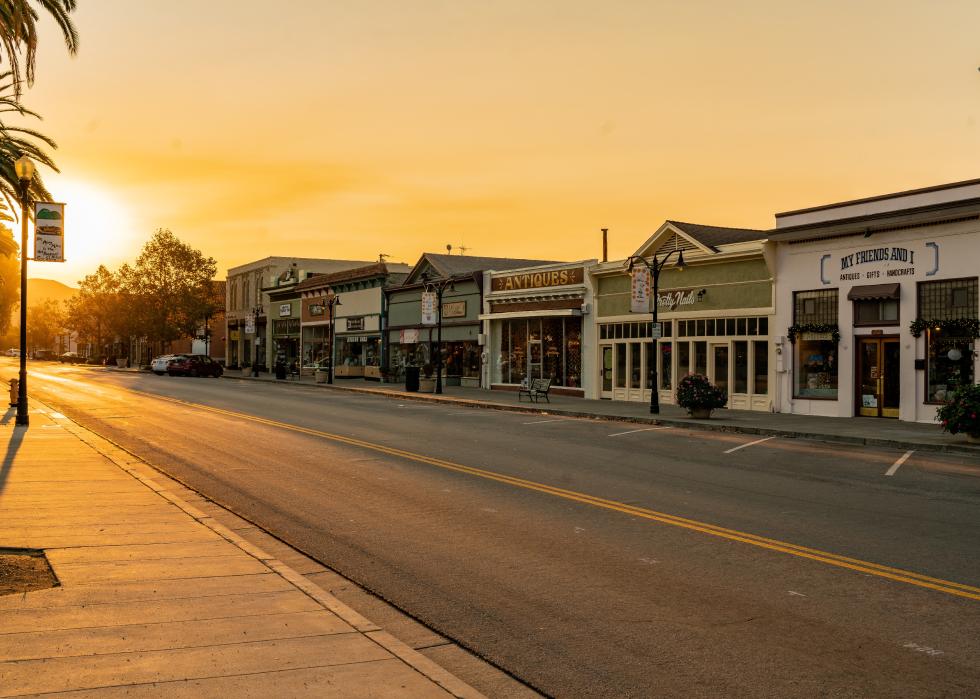
Sunset over an empty road and store fronts

John Roche // Shutterstock

13 / 38

Fremont, California

- Energy breakdown:
--- Coal: 0.0%
--- Gas: 0.0%
--- Oil: 0.0%
--- Nuclear: 1.0%
--- Hydro: 30.0%
--- Bioenergy (biomass and biofuels): 4.0%
--- Wind: 36.0%
--- Geothermal: 12.0%
--- Solar (photovoltaic and thermal): 12.0%
--- Waste to energy (excluding biomass component): 4.0%

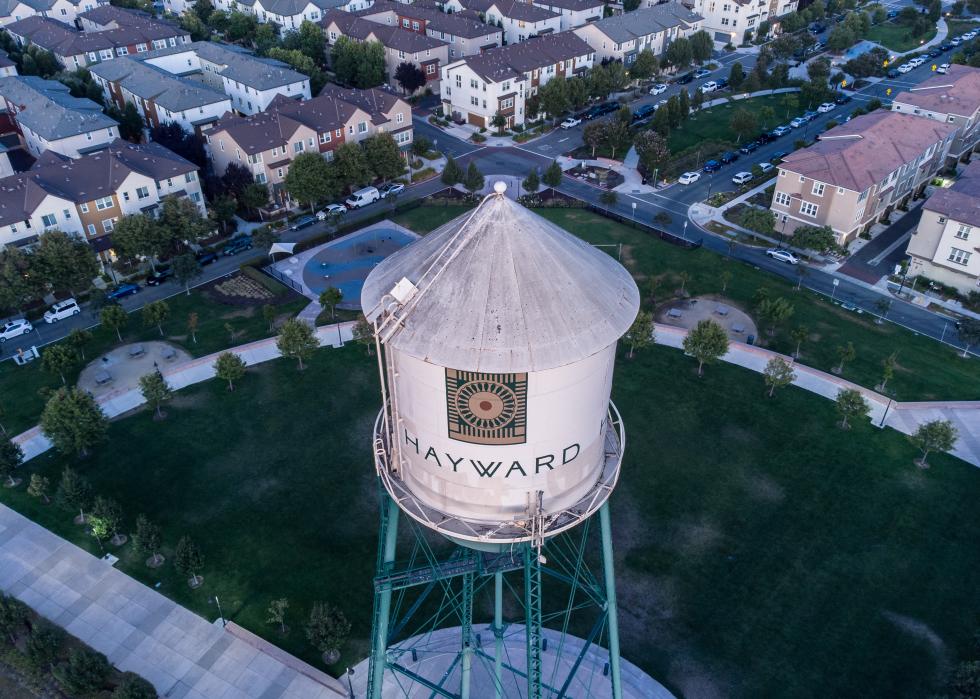
Hayward water tower in the evening from above

SnapASkyline // Shutterstock

14 / 38

Hayward, California

- Energy breakdown:
--- Coal: 0.0%
--- Gas: 0.0%
--- Oil: 0.0%
--- Nuclear: 0.0%
--- Hydro: 25.0%
--- Bioenergy (biomass and biofuels): 0.0%
--- Wind: 37.0%
--- Geothermal: 0.0%
--- Solar (photovoltaic and thermal): 0.0%
--- Waste to energy (excluding biomass component): 38.0%

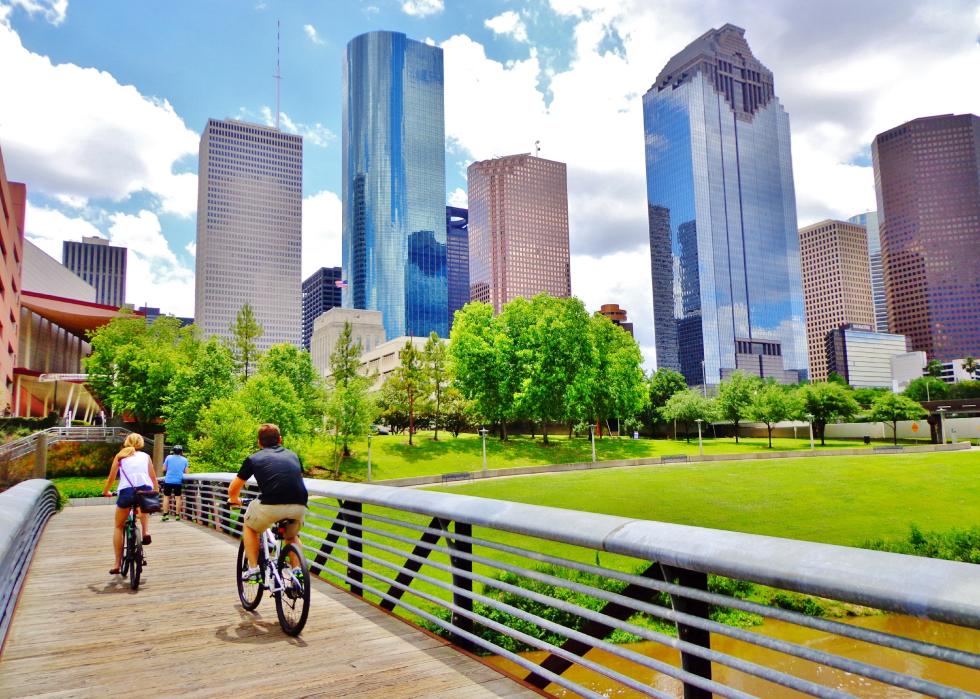
Bicyclists cross wooden bridge in Buffalo Bayou Park

Nate Hovee // Shutterstock

15 / 38

Houston, Texas

- Energy breakdown:
--- Coal: 18.6%
--- Gas: 51.1%
--- Oil: 0.0%
--- Nuclear: 9.9%
--- Hydro: 0.3%
--- Bioenergy (biomass and biofuels): 0.2%
--- Wind: 18.3%
--- Geothermal: 0.0%
--- Solar (photovoltaic and thermal): 0.0%
--- Waste to energy (excluding biomass component): 1.0%

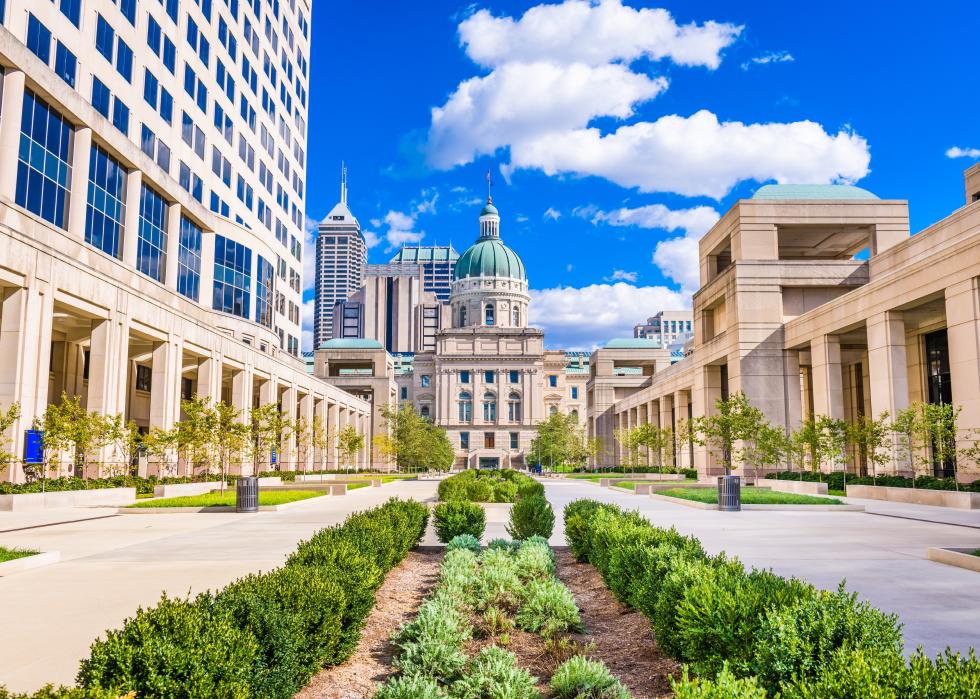
Indiana State Capitol Building in Indianapolis

Sean Pavone // Shutterstock

16 / 38

Indianapolis, Indiana

- Energy breakdown:
--- Coal: 43.0%
--- Gas: 45.0%
--- Oil: 2.0%
--- Nuclear: 0.0%
--- Hydro: 0.0%
--- Bioenergy (biomass and biofuels): 0.0%
--- Wind: 8.0%
--- Geothermal: 0.0%
--- Solar (photovoltaic and thermal): 0.0%
--- Waste to energy (excluding biomass component): 2.0%

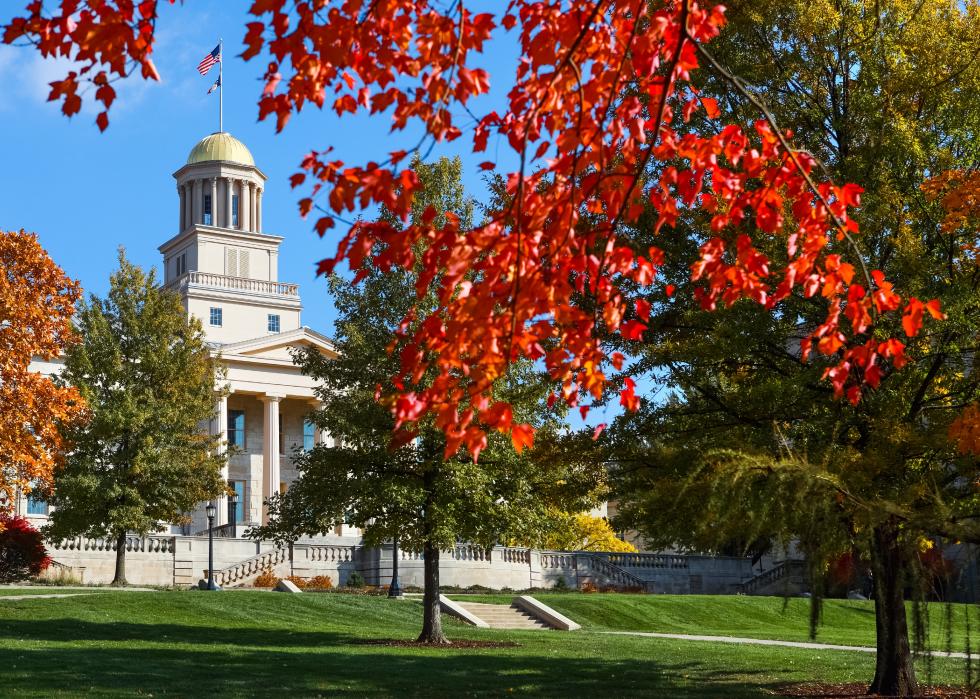
Old Capitol building downtown Iowa City

Suzanne Tucker // Shutterstock

17 / 38

Iowa City, Iowa

- Energy breakdown:
--- Coal: 45.3%
--- Gas: 2.1%
--- Oil: 0.0%
--- Nuclear: 13.0%
--- Hydro: 0.0%
--- Bioenergy (biomass and biofuels): 0.2%
--- Wind: 39.4%
--- Geothermal: 0.0%
--- Solar (photovoltaic and thermal): 0.0%
--- Waste to energy (excluding biomass component): 0.0%

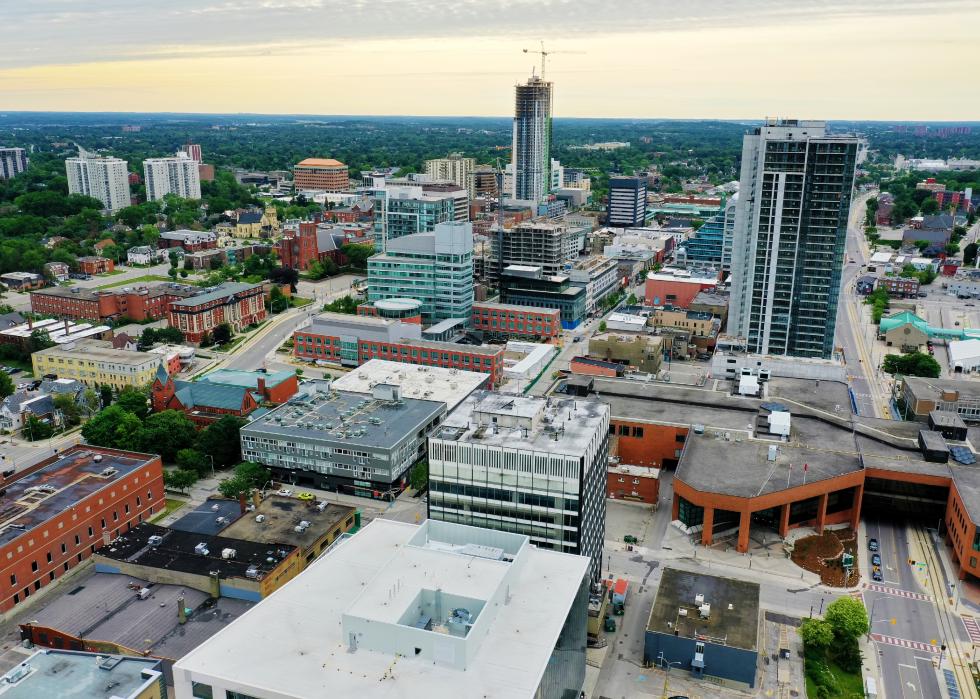
An aerial view of Kitchener, Ontario, Canada

Harold Stiver // Shutterstock

18 / 38

Kitchener, Ontario

- Energy breakdown:
--- Coal: 0.0%
--- Gas: 6.1%
--- Oil: 0.0%
--- Nuclear: 58.2%
--- Hydro: 24.0%
--- Bioenergy (biomass and biofuels): 0.5%
--- Wind: 8.2%
--- Geothermal: 0.0%
--- Solar (photovoltaic and thermal): 0.0%
--- Waste to energy (excluding biomass component): 2.4%

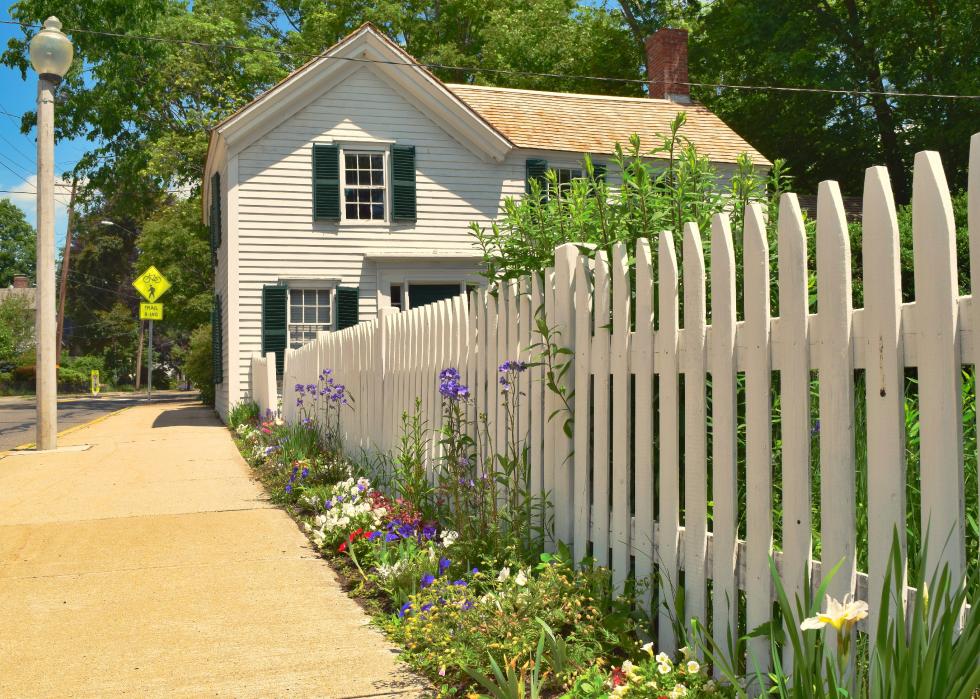
A white fence and colonial home in Lexington, MA

Keith J Finks // Shutterstock

19 / 38

Lexington, Massachusetts

- Energy breakdown:
--- Coal: 0.0%
--- Gas: 0.0%
--- Oil: 0.0%
--- Nuclear: 0.0%
--- Hydro: 0.0%
--- Bioenergy (biomass and biofuels): 0.0%
--- Wind: 94.6%
--- Geothermal: 0.0%
--- Solar (photovoltaic and thermal): 0.0%
--- Waste to energy (excluding biomass component): 5.4%

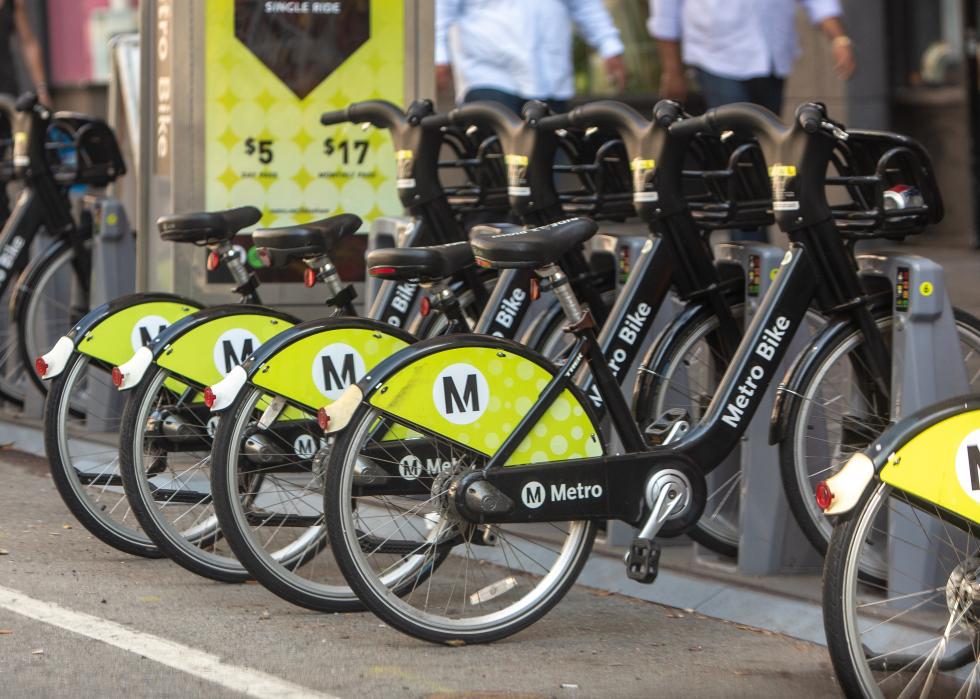
A Metro bike station in Los Angeles

Juan Llauro // Shutterstock

20 / 38

Los Angeles, California

- Energy breakdown:
--- Coal: 21.0%
--- Gas: 27.0%
--- Oil: 0.0%
--- Nuclear: 14.0%
--- Hydro: 6.0%
--- Bioenergy (biomass and biofuels): 0.0%
--- Wind: 10.0%
--- Geothermal: 9.0%
--- Solar (photovoltaic and thermal): 9.0%
--- Waste to energy (excluding biomass component): 12.0%

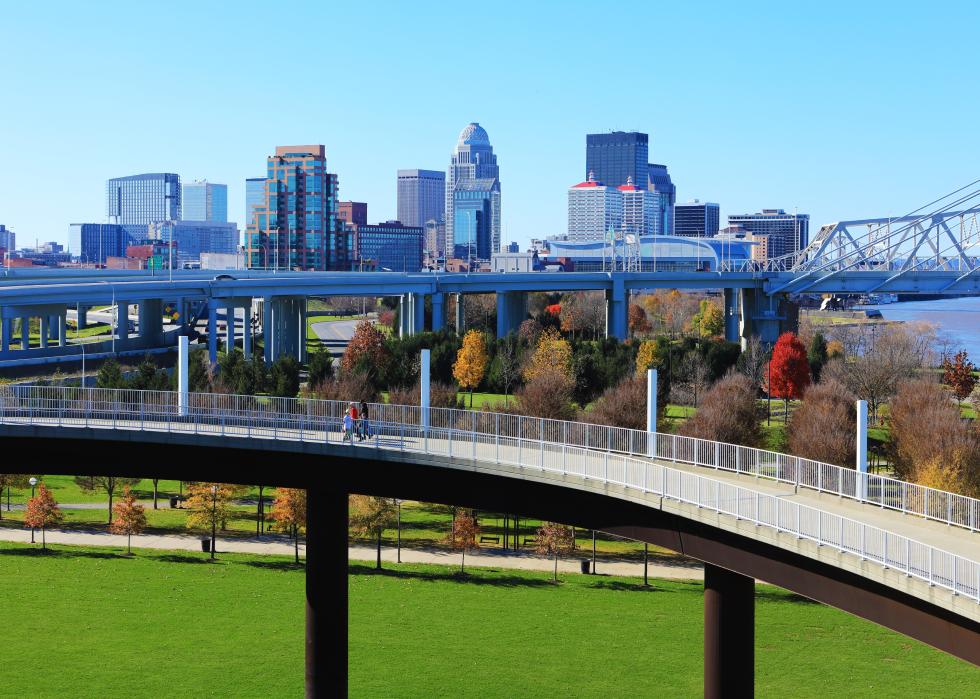
The Louisville, Kentucky skyline with pedestrian walkway in front

Harold Stiver // Shutterstock

21 / 38

Louisville, Kentucky

- Energy breakdown:
--- Coal: 60.0%
--- Gas: 37.0%
--- Oil: 0.0%
--- Nuclear: 0.0%
--- Hydro: 3.0%
--- Bioenergy (biomass and biofuels): 0.0%
--- Wind: 0.0%
--- Geothermal: 0.0%
--- Solar (photovoltaic and thermal): 0.0%
--- Waste to energy (excluding biomass component): 0.0%

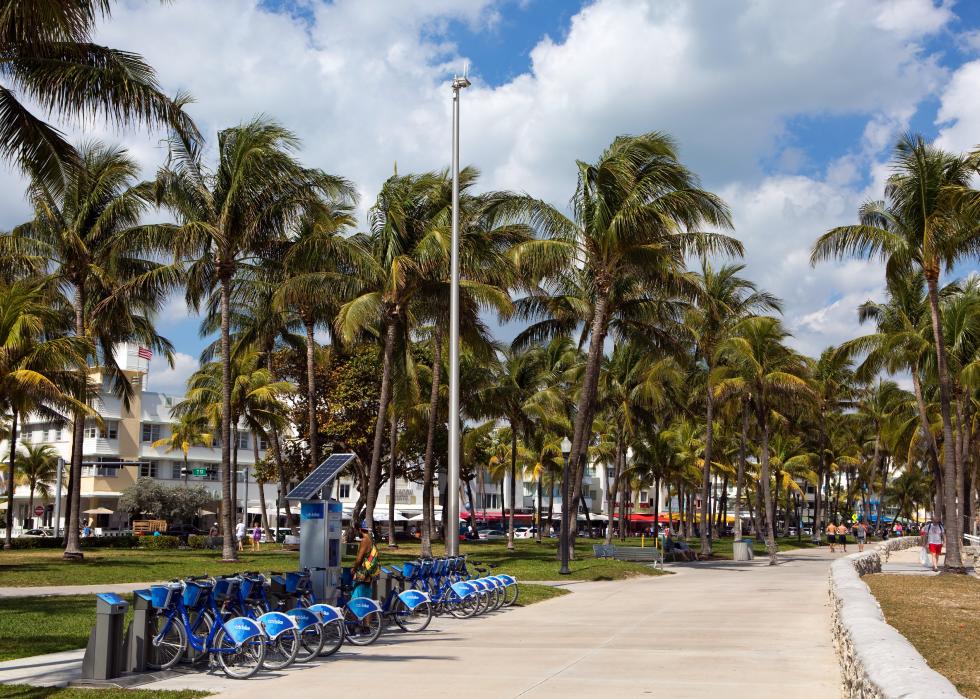
Man uses a self-service kiosk station to rent a bicycle on Ocean Drive in Miami Beach

Steven Frame // Shutterstock

22 / 38

Miami, Florida

- Energy breakdown:
--- Coal: 2.1%
--- Gas: 72.3%
--- Oil: 0.3%
--- Nuclear: 22.3%
--- Hydro: 0.0%
--- Bioenergy (biomass and biofuels): 0.0%
--- Wind: 0.0%
--- Geothermal: 0.0%
--- Solar (photovoltaic and thermal): 0.0%
--- Waste to energy (excluding biomass component): 1.5%

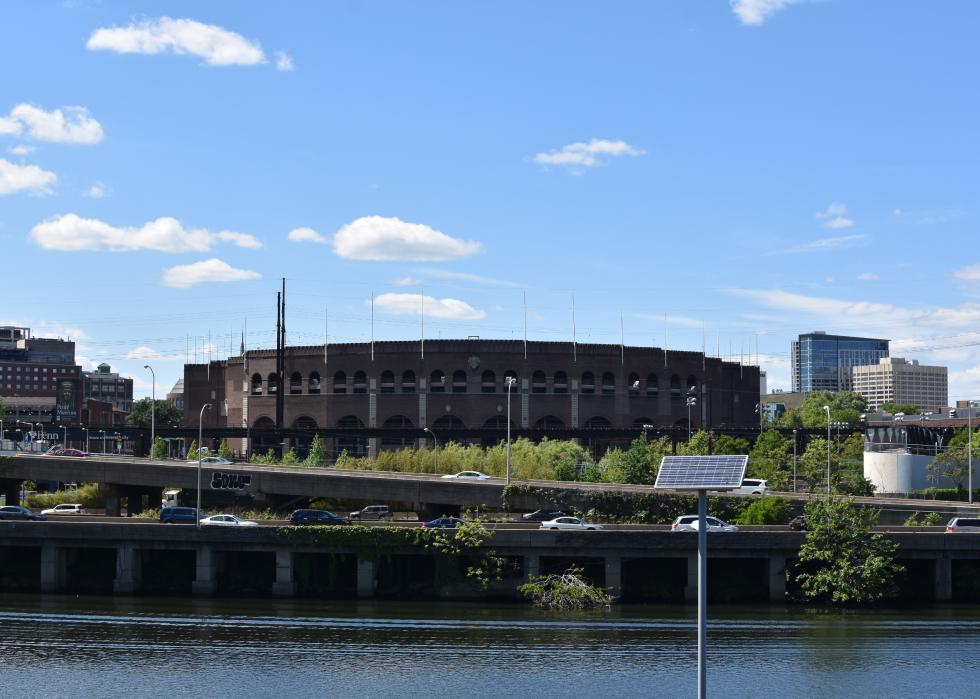
American coliseum in Philadelphia with solar panel

Robert Vincelli // Shutterstock

23 / 38

Philadelphia, Pennsylvania

- Energy breakdown:
--- Coal: 17.6%
--- Gas: 38.0%
--- Oil: 0.2%
--- Nuclear: 39.7%
--- Hydro: 0.9%
--- Bioenergy (biomass and biofuels): 1.9%
--- Wind: 1.0%
--- Geothermal: 0.0%
--- Solar (photovoltaic and thermal): 0.0%
--- Waste to energy (excluding biomass component): 0.4%

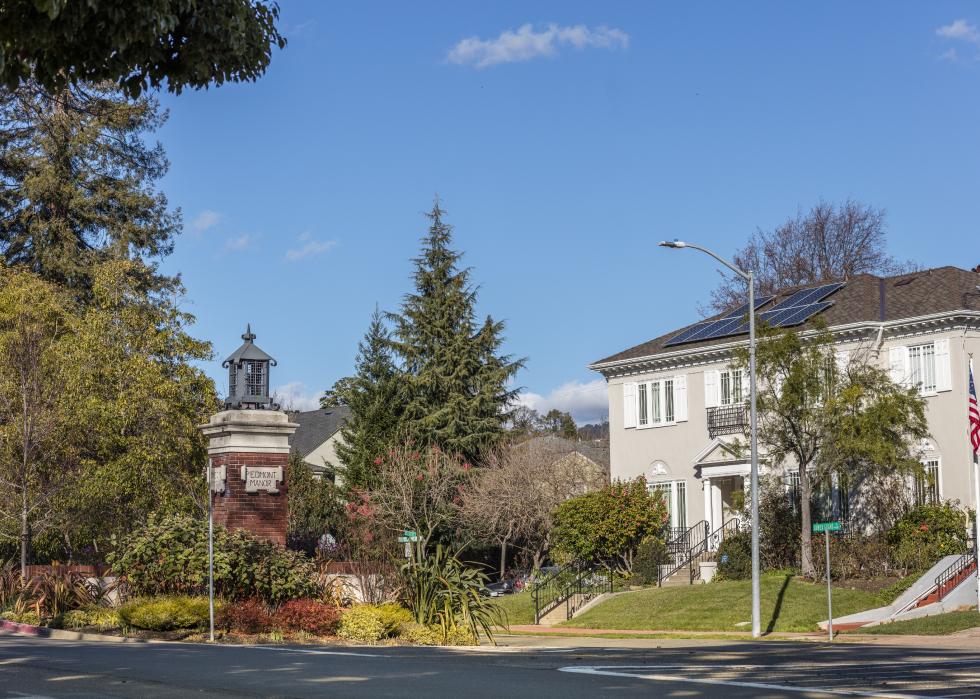
Piedmont neighborhood in California

BondRocketImages // Shutterstock

24 / 38

Piedmont, California

- Energy breakdown:
--- Coal: 0.0%
--- Gas: 0.0%
--- Oil: 0.0%
--- Nuclear: 0.0%
--- Hydro: 0.0%
--- Bioenergy (biomass and biofuels): 0.0%
--- Wind: 50.0%
--- Geothermal: 0.0%
--- Solar (photovoltaic and thermal): 0.0%
--- Waste to energy (excluding biomass component): 50.0%

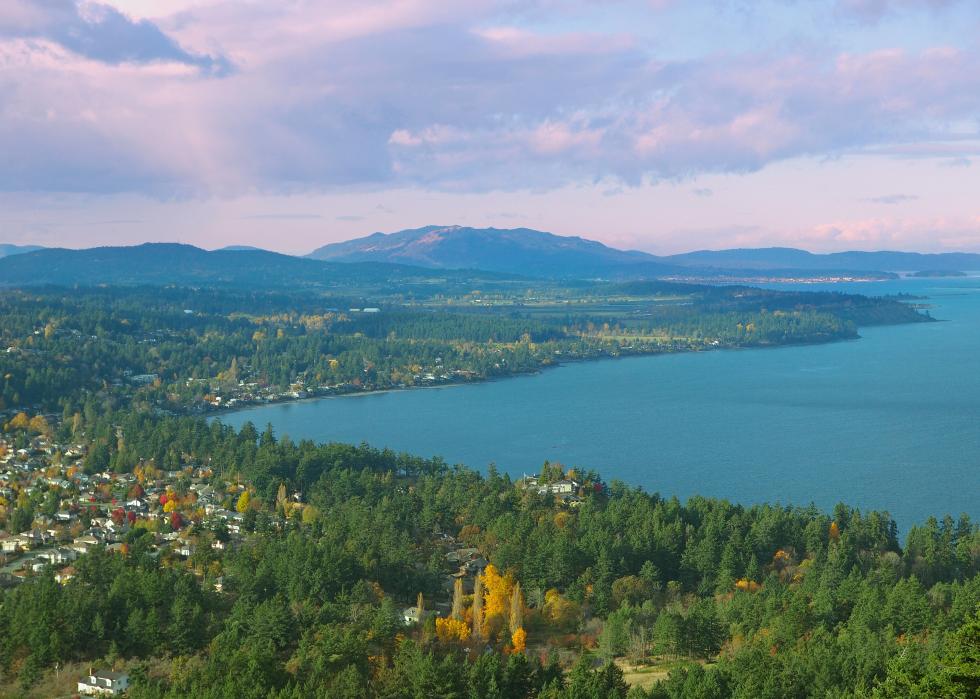
Saanich Peninsula and Cordova Bay on Vancouver Island

pr2is // Shutterstock

25 / 38

Saanich, British Columbia

- Energy breakdown:
--- Coal: 0.0%
--- Gas: 1.8%
--- Oil: 0.0%
--- Nuclear: 0.0%
--- Hydro: 95.6%
--- Bioenergy (biomass and biofuels): 0.0%
--- Wind: 0.0%
--- Geothermal: 0.0%
--- Solar (photovoltaic and thermal): 0.0%
--- Waste to energy (excluding biomass component): 0.0%

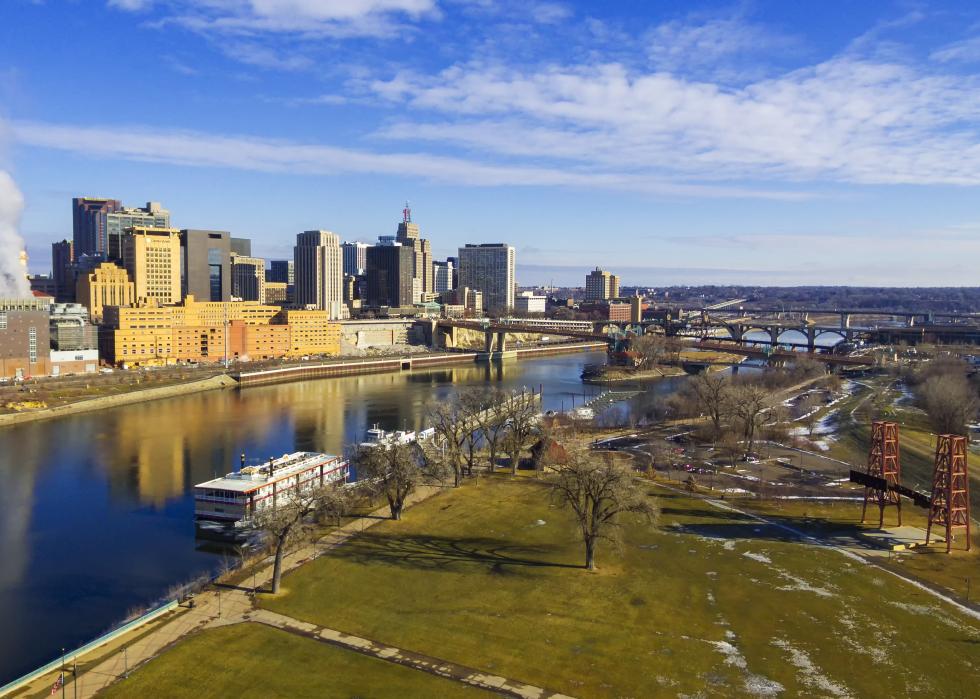
St. Paul skyline in Minnesota
LAM-Photography // Shutterstock

26 / 38

St. Paul, Minnesota
- Energy breakdown:
--- Coal: 23.0%
--- Gas: 23.0%
--- Oil: 0.0%
--- Nuclear: 28.0%
--- Hydro: 6.0%
--- Bioenergy (biomass and biofuels): 2.0%
--- Wind: 15.0%
--- Geothermal: 0.0%
--- Solar (photovoltaic and thermal): 0.0%
--- Waste to energy (excluding biomass component): 3.0%

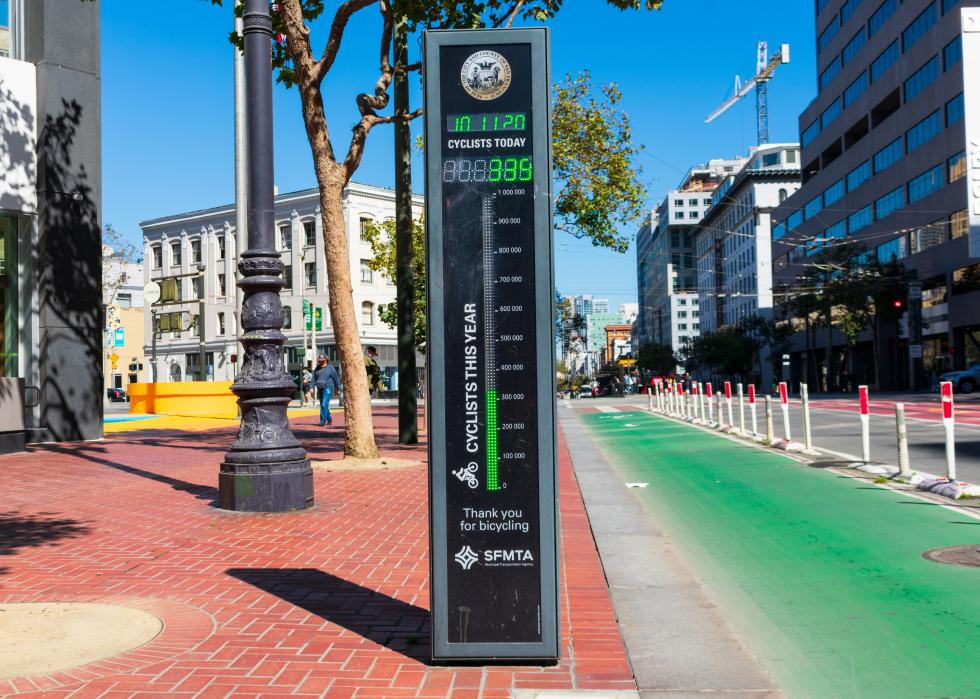
Automated bicycle counter with display showing the daily and annual total bike ridership

Michael Vi // Shutterstock

27 / 38

San Francisco, California

- Energy breakdown:
--- Coal: 0.0%
--- Gas: 1.0%
--- Oil: 0.0%
--- Nuclear: 10.0%
--- Hydro: 50.0%
--- Bioenergy (biomass and biofuels): 1.0%
--- Wind: 18.0%
--- Geothermal: 6.0%
--- Solar (photovoltaic and thermal): 6.0%
--- Waste to energy (excluding biomass component): 6.0%

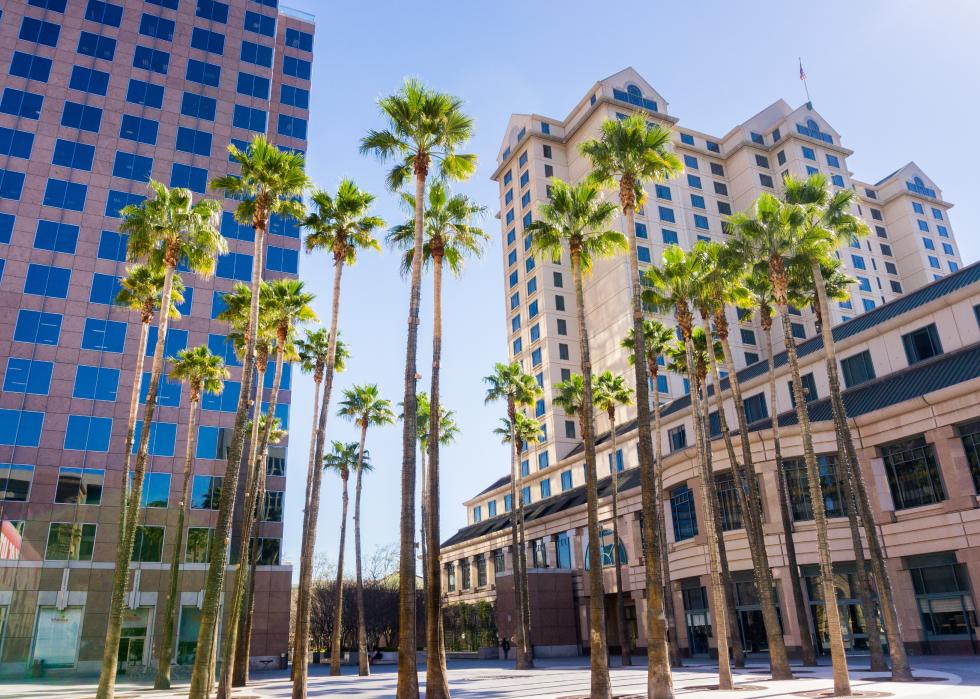
Urban landscape in downtown San Jose

Sundry Photography // Shutterstock

28 / 38

San Jose, California

- Energy breakdown:
--- Coal: 0.0%
--- Gas: 0.0%
--- Oil: 0.0%
--- Nuclear: 13.0%
--- Hydro: 31.0%
--- Bioenergy (biomass and biofuels): 2.0%
--- Wind: 24.0%
--- Geothermal: 3.0%
--- Solar (photovoltaic and thermal): 3.0%
--- Waste to energy (excluding biomass component): 17.0%

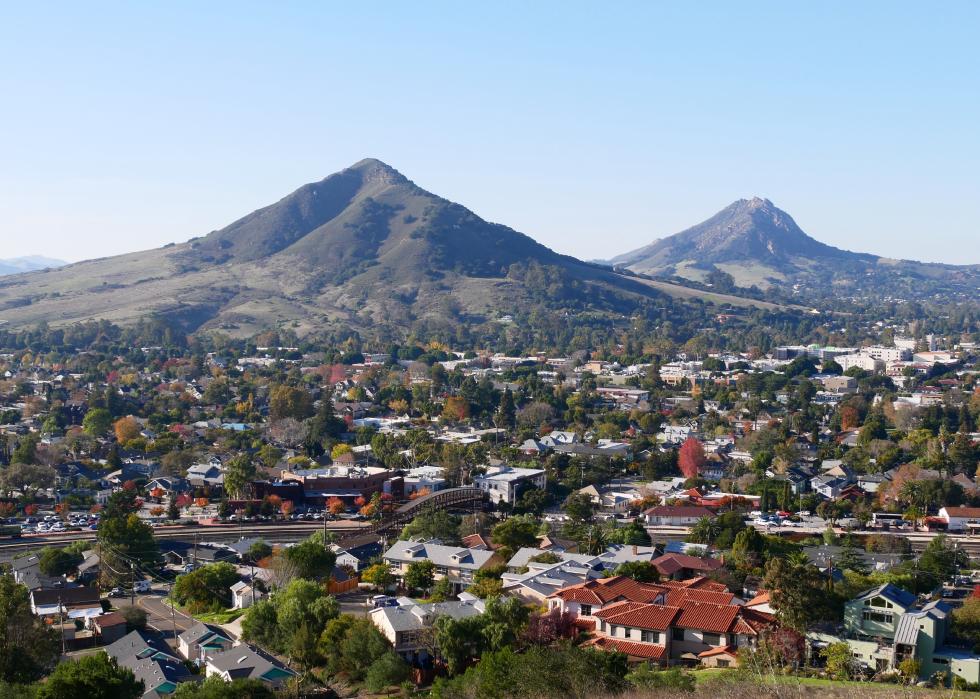
Aerial view of Bishop peak and Cerro San Luis Obispo

joojoob27 // Shutterstock

29 / 38

San Luis Obispo, California

- Energy breakdown:
--- Coal: 0.0%
--- Gas: 0.0%
--- Oil: 0.0%
--- Nuclear: 0.0%
--- Hydro: 66.0%
--- Bioenergy (biomass and biofuels): 0.0%
--- Wind: 11.0%
--- Geothermal: 12.0%
--- Solar (photovoltaic and thermal): 12.0%
--- Waste to energy (excluding biomass component): 11.0%

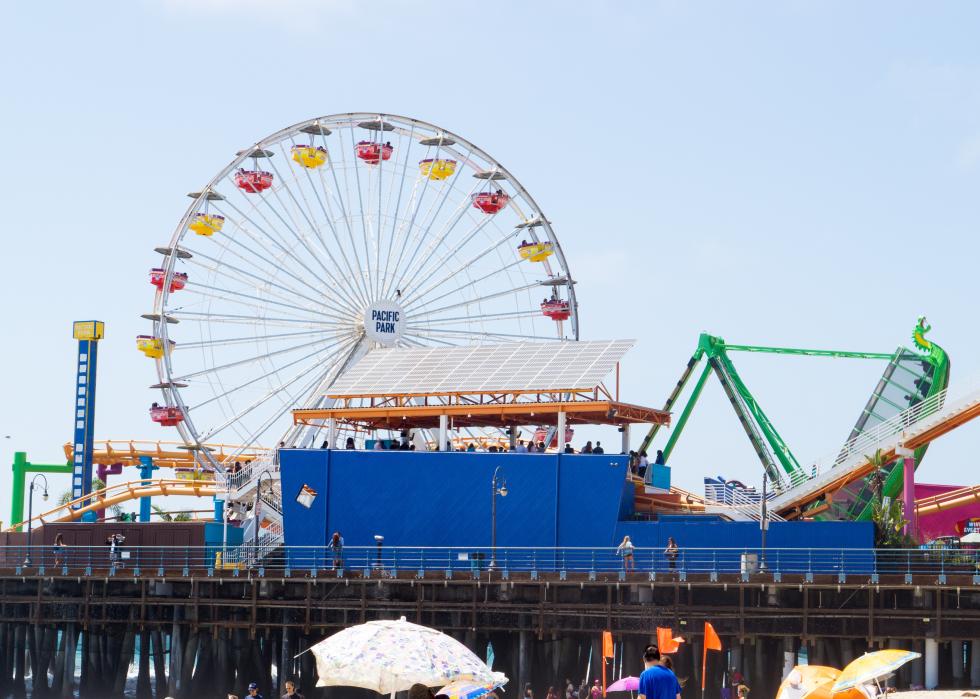
Santa Monica pier with solar panels

Tero Vesalainen // Shutterstock

30 / 38

Santa Monica, California

- Energy breakdown:
--- Coal: 1.0%
--- Gas: 10.9%
--- Oil: 0.0%
--- Nuclear: 2.9%
--- Hydro: 5.3%
--- Bioenergy (biomass and biofuels): 1.5%
--- Wind: 9.4%
--- Geothermal: 1.5%
--- Solar (photovoltaic and thermal): 1.5%
--- Waste to energy (excluding biomass component): 65.1%

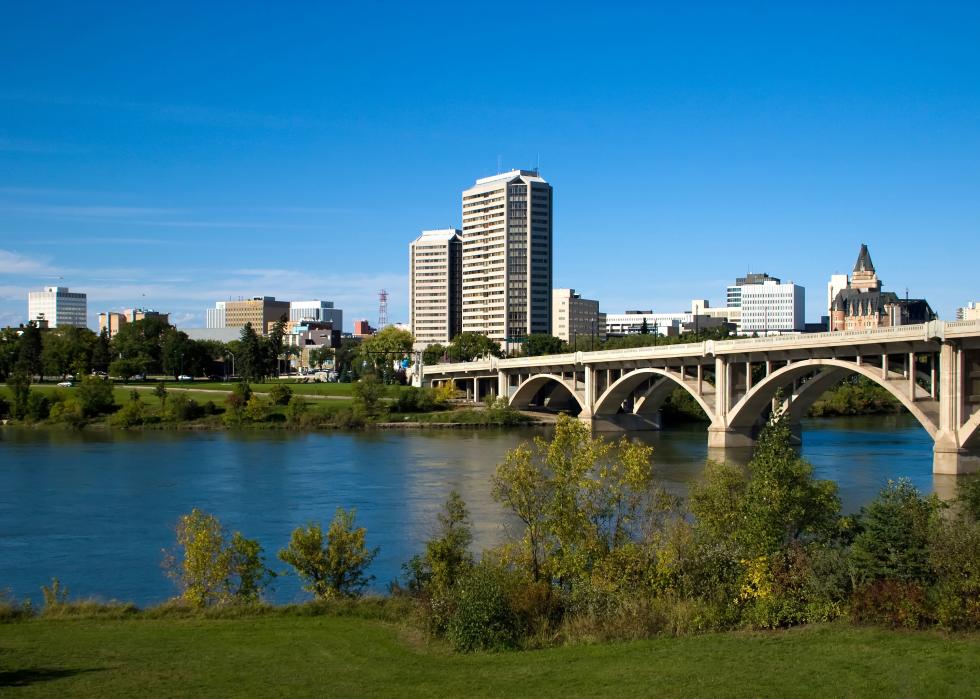
Saskatoon cityscape on sunny day

Scott Prokop // Shutterstock

31 / 38

Saskatoon, Saskatchewan

- Energy breakdown:
--- Coal: 31.0%
--- Gas: 45.0%
--- Oil: 0.0%
--- Nuclear: 0.0%
--- Hydro: 18.0%
--- Bioenergy (biomass and biofuels): 0.0%
--- Wind: 5.0%
--- Geothermal: 0.0%
--- Solar (photovoltaic and thermal): 0.0%
--- Waste to energy (excluding biomass component): 0.0%

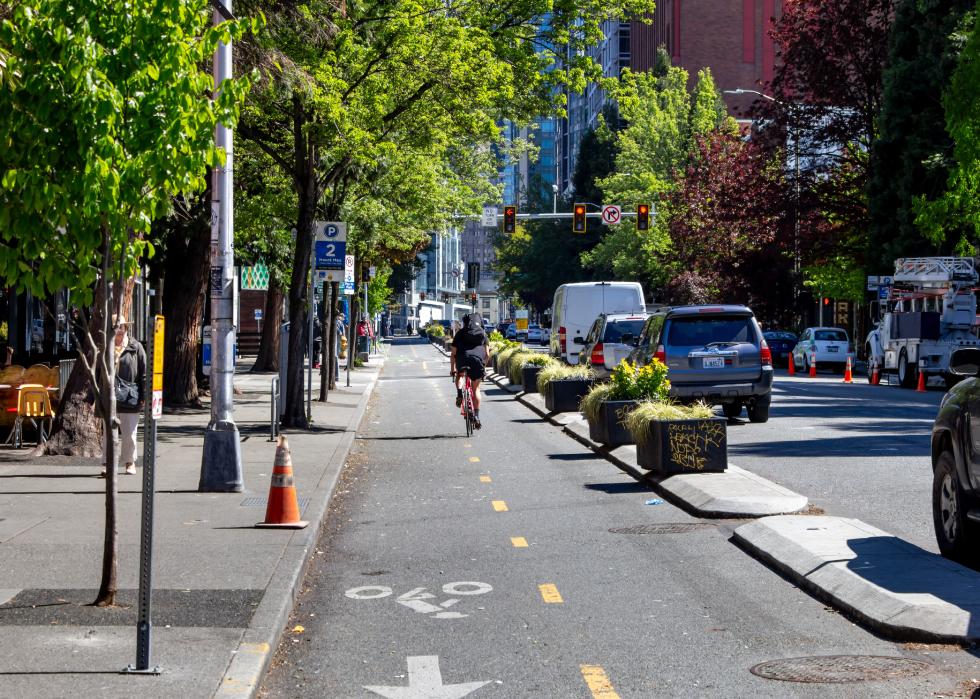
The bike lane of a street in downtown Seattle

The Image Party // Shutterstock

32 / 38

Seattle, Washington

- Energy breakdown:
--- Coal: 0.0%
--- Gas: 0.0%
--- Oil: 0.0%
--- Nuclear: 5.0%
--- Hydro: 84.0%
--- Bioenergy (biomass and biofuels): 1.0%
--- Wind: 4.0%
--- Geothermal: 0.0%
--- Solar (photovoltaic and thermal): 0.0%
--- Waste to energy (excluding biomass component): 0.0%

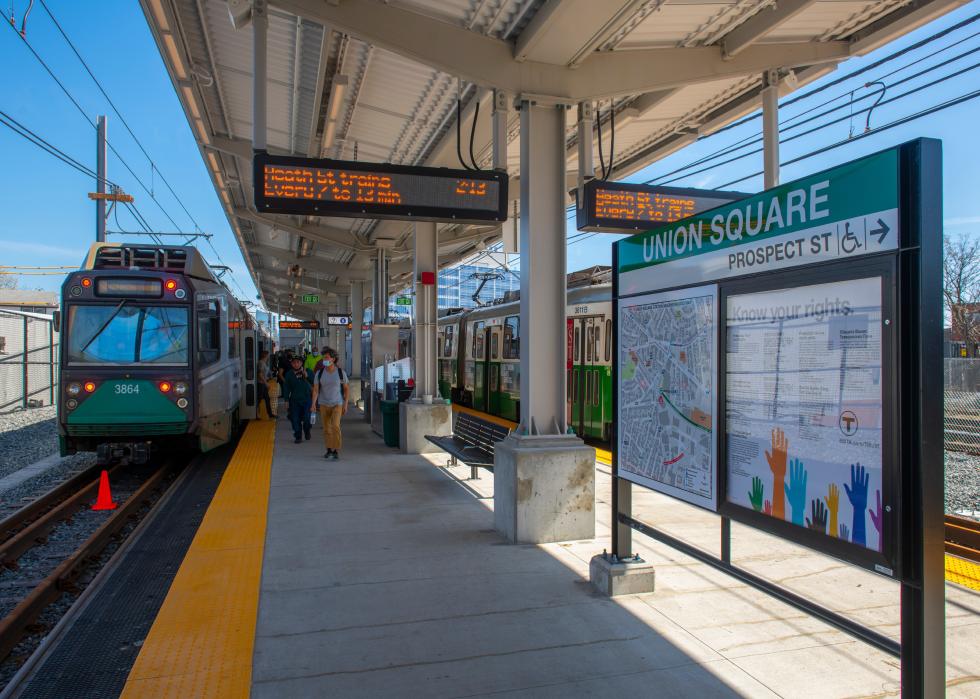
Union Square station at Union Square in city of Somerville, Massachusetts

Wangkun Jia // Shutterstock

33 / 38

Somerville, Massachusetts

- Energy breakdown:
--- Coal: 0.5%
--- Gas: 48.5%
--- Oil: 0.2%
--- Nuclear: 30.5%
--- Hydro: 8.9%
--- Bioenergy (biomass and biofuels): 2.5%
--- Wind: 3.6%
--- Geothermal: 0.0%
--- Solar (photovoltaic and thermal): 0.0%
--- Waste to energy (excluding biomass component): 1.7%

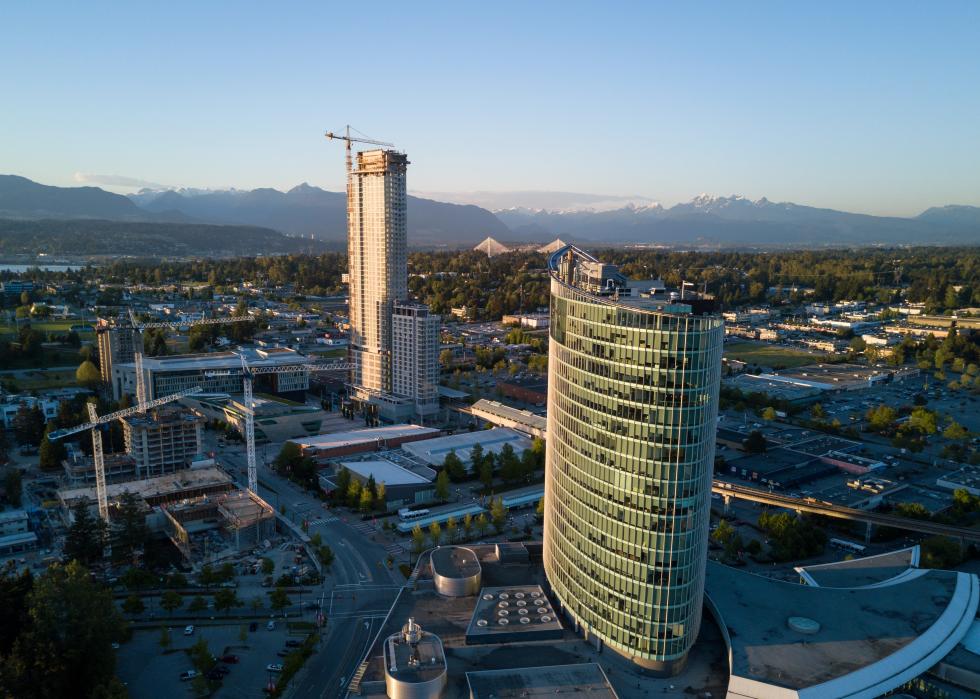
Aerial of Surrey City Centre in British Columbia

EB Adventure Photography // Shutterstock

34 / 38

Surrey, British Columbia

- Energy breakdown:
--- Coal: 0.0%
--- Gas: 2.0%
--- Oil: 1.0%
--- Nuclear: 0.0%
--- Hydro: 90.0%
--- Bioenergy (biomass and biofuels): 6.0%
--- Wind: 1.0%
--- Geothermal: 0.0%
--- Solar (photovoltaic and thermal): 0.0%
--- Waste to energy (excluding biomass component): 0.0%

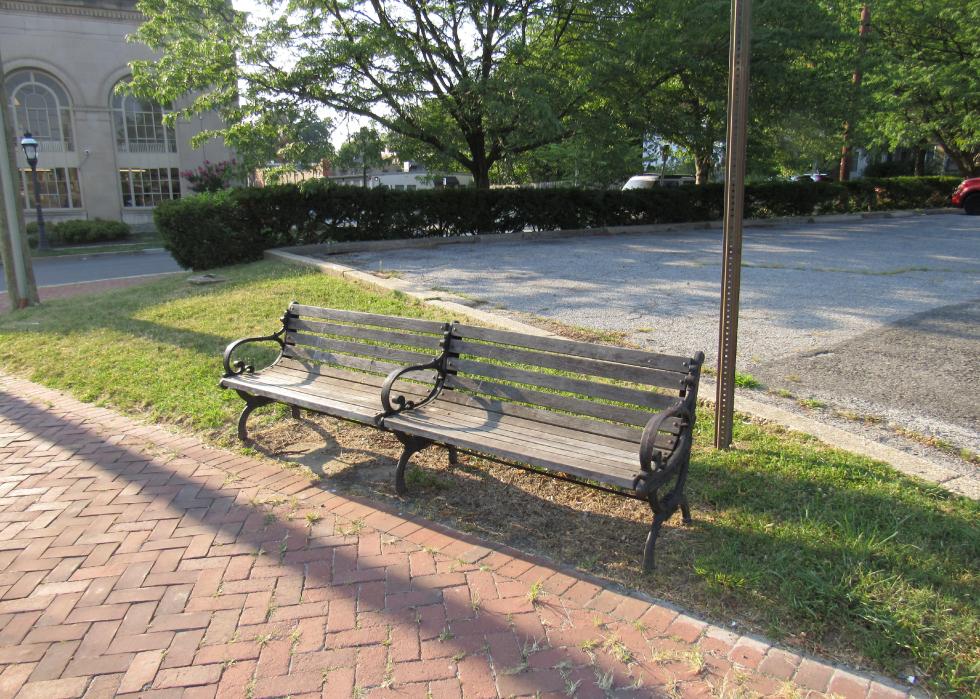
Park bench in Takoma Park, Maryland

SHTBCB // Shutterstock

35 / 38

Takoma Park, Maryland

- Energy breakdown:
--- Coal: 29.8%
--- Gas: 28.7%
--- Oil: 0.3%
--- Nuclear: 35.3%
--- Hydro: 1.4%
--- Bioenergy (biomass and biofuels): 0.3%
--- Wind: 3.1%
--- Geothermal: 0.0%
--- Solar (photovoltaic and thermal): 0.0%
--- Waste to energy (excluding biomass component): 0.3%

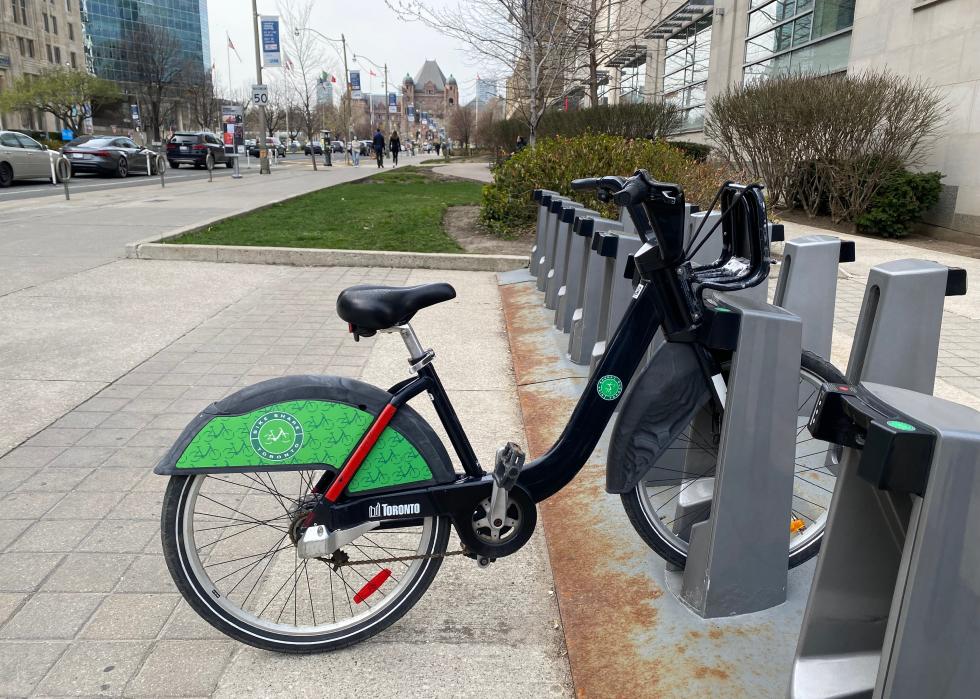
Bike share Toronto docking station with one bike

DoctorIce Photography // Shutterstock

36 / 38

Toronto, Ontario

- Energy breakdown:
--- Coal: 0.0%
--- Gas: 29.0%
--- Oil: 0.0%
--- Nuclear: 34.0%
--- Hydro: 23.0%
--- Bioenergy (biomass and biofuels): 1.0%
--- Wind: 12.0%
--- Geothermal: 0.0%
--- Solar (photovoltaic and thermal): 0.0%
--- Waste to energy (excluding biomass component): 1.0%

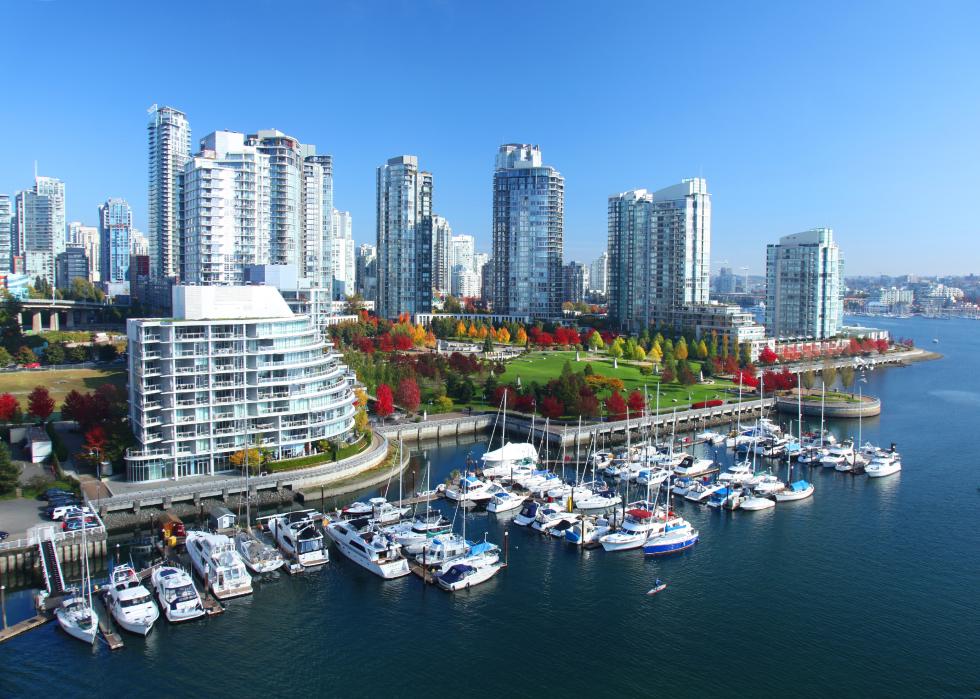
Vancouver in British Columbia, Canada

Dan Breckwoldt // Shutterstock

37 / 38

Vancouver, British Columbia

- Energy breakdown:
--- Coal: 0.0%
--- Gas: 2.0%
--- Oil: 0.0%
--- Nuclear: 0.0%
--- Hydro: 91.0%
--- Bioenergy (biomass and biofuels): 6.0%
--- Wind: 1.0%
--- Geothermal: 0.0%
--- Solar (photovoltaic and thermal): 0.0%
--- Waste to energy (excluding biomass component): 0.0%

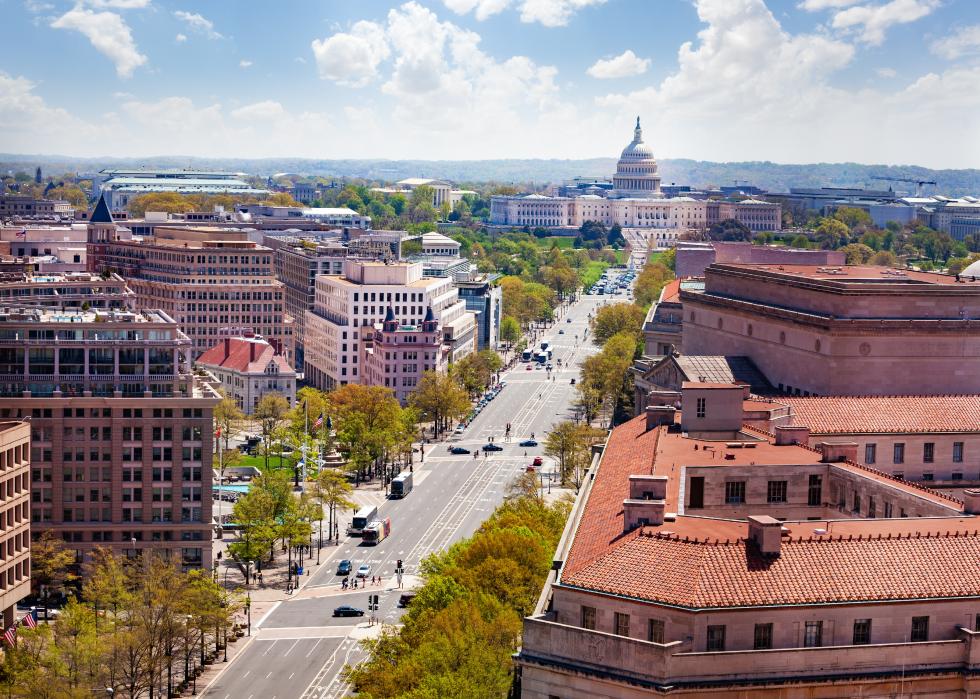
Panorama of Pennsylvania Avenue and United States Capitol Building

Sergey Novikov // Shutterstock

38 / 38

Washington D.C.

- Energy breakdown:
--- Coal: 12.3%
--- Gas: 45.7%
--- Oil: 0.1%
--- Nuclear: 36.9%
--- Hydro: 1.6%
--- Bioenergy (biomass and biofuels): 1.6%
--- Wind: 0.9%
--- Geothermal: 0.0%
--- Solar (photovoltaic and thermal): 0.0%
--- Waste to energy (excluding biomass component): 0.6%