stories
Social Issues

50 facts about poverty in America

·Aine Givens

Spencer Platt // Getty Images

Before the coronavirus pandemic exploded across the United States, the poverty rate was falling.

It was 10.5% in 2019, which was still 34 million poor people, but 4.2 million fewer than the year before, and the lowest rate recorded since estimates were first published in 1959, according to the Census Bureau.

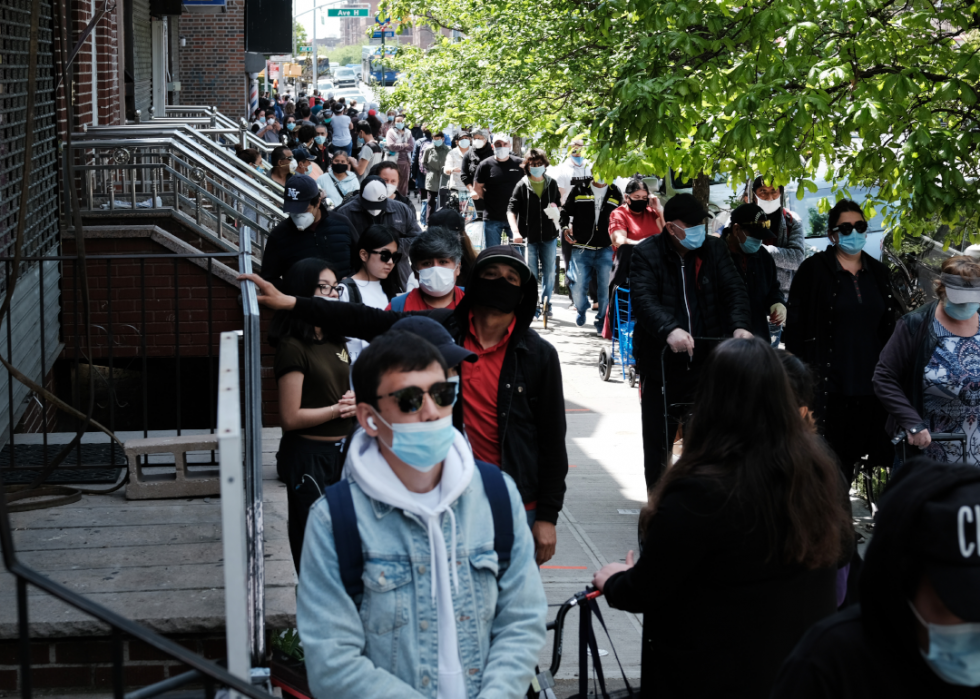
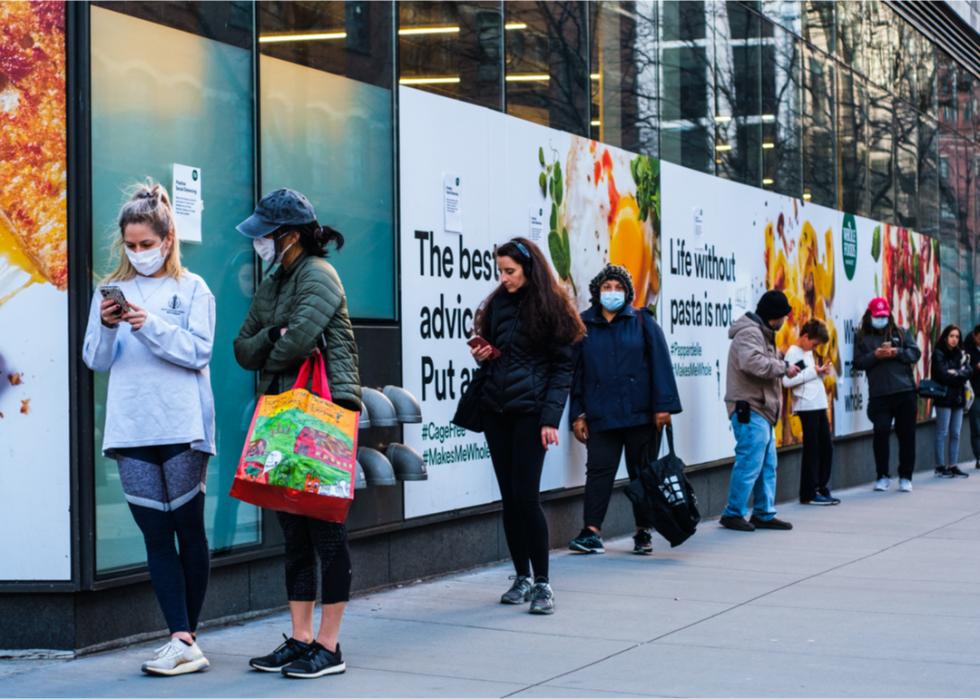
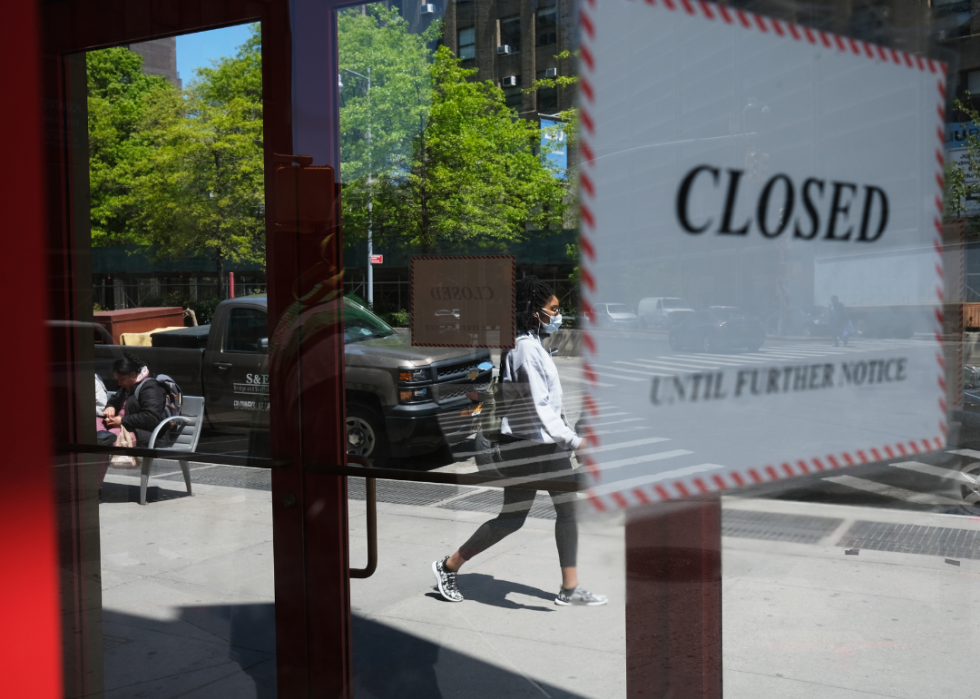
That changed as the pandemic upended the economy, forcing schools, businesses, restaurants, and shops to close, and throwing millions out of work. A study from Columbia University in New York City found that there were 8 million more poor people in October than in May as a result. Hardest hit have been Black and Latino Americans, the Urban Institute found, across the measures of lost income, food insufficiency, and concerns about paying rent or mortgages.

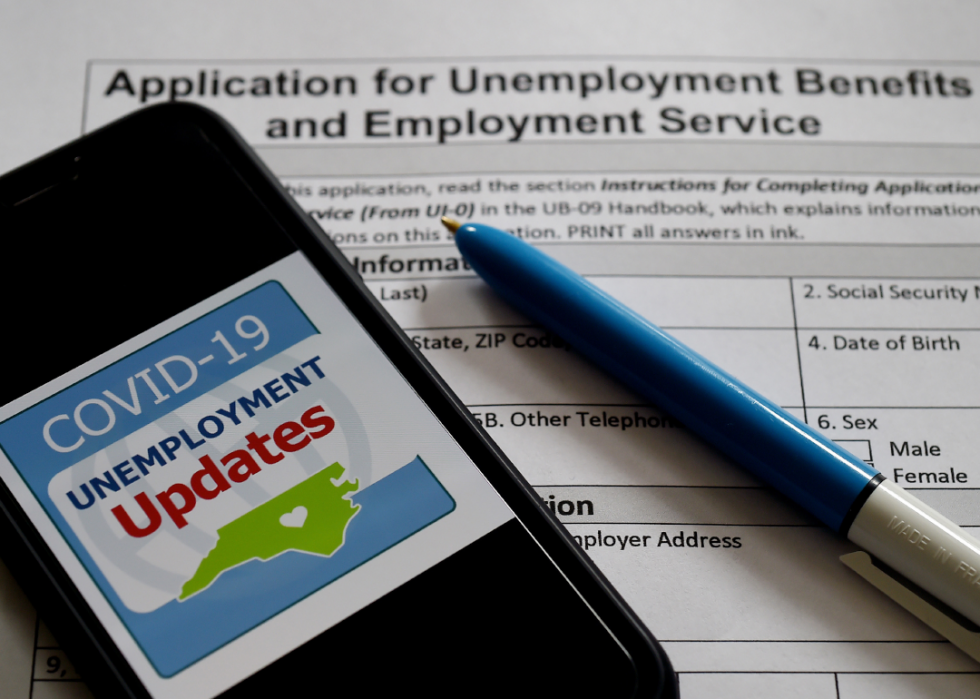
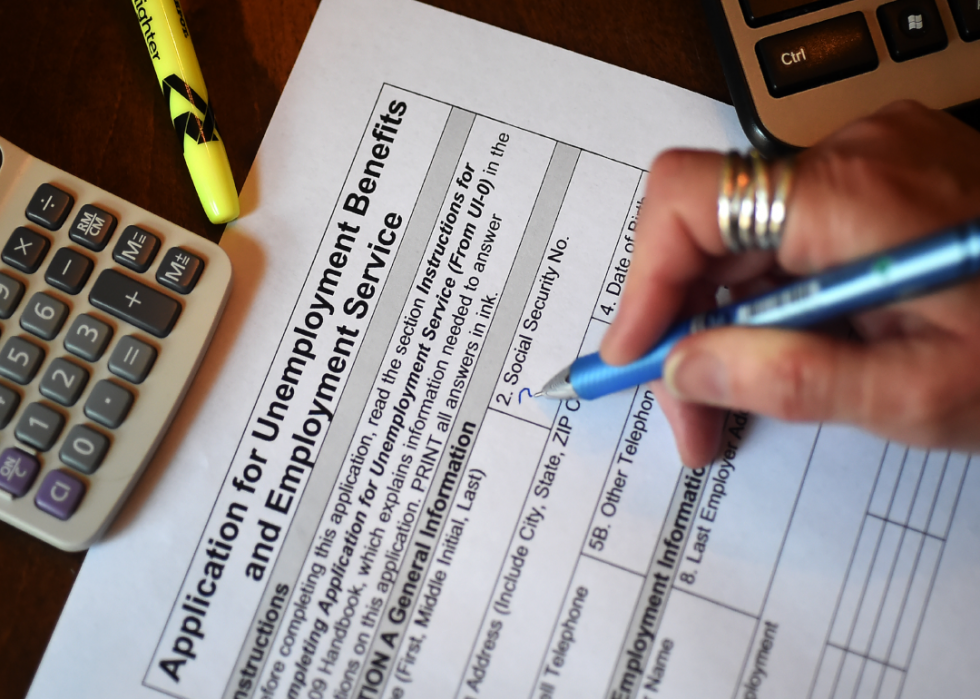
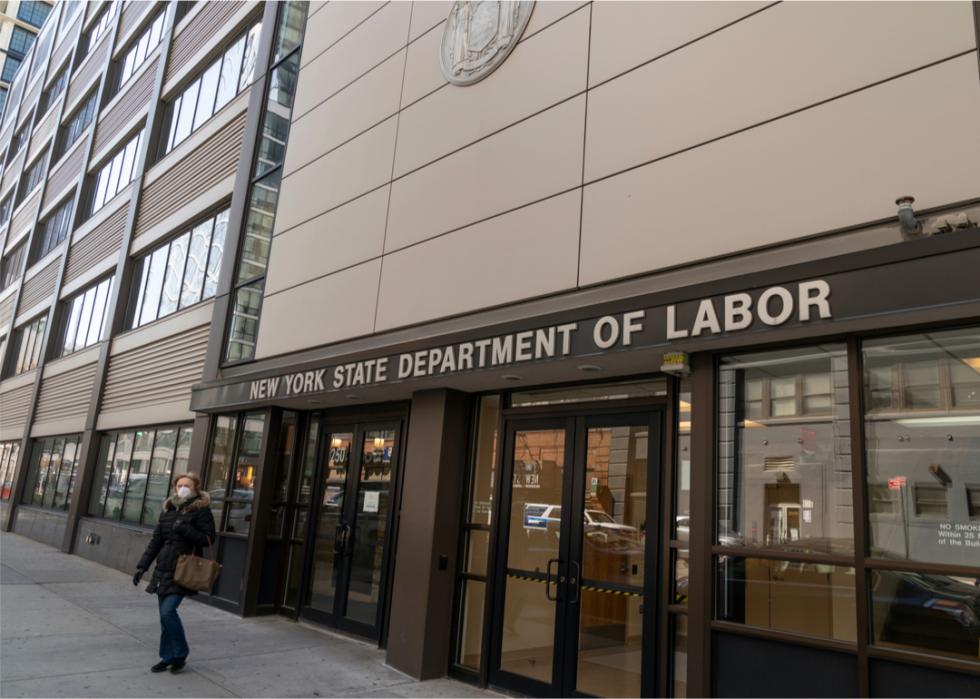
At the height of the crisis in March 2020, nearly 7 million people were filing jobless claims. For many, that meant the loss of health insurance coverage during the country's worst public health crisis in 100 years. The numbers of uninsured were already rising, according to the Kaiser Family Foundation. They went from 26.7 million in 2016, up to 27.6 million in 2017, up again to 28.2 million in 2018, reaching 29.2 million in 2019. People without insurance could face large medical bills if they get COVID-19.

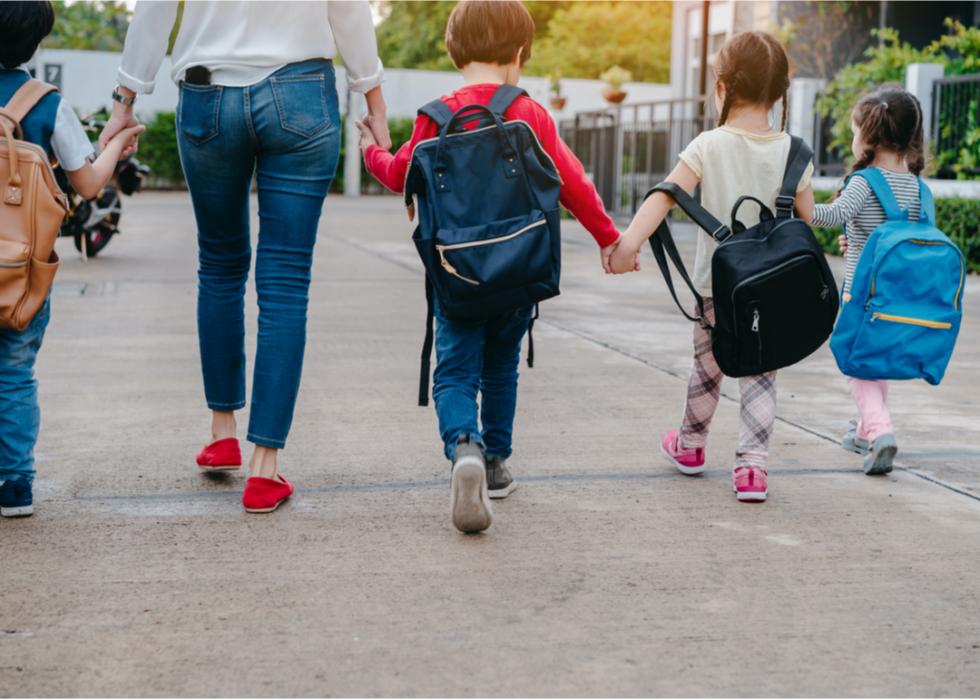
Women were already more likely to be poor than men. In 2018, 12.9% of women lived in poverty, compared to 10.6% men. Now the pandemic is placing an unequal burden on women, who no longer have the support of schools and day care for child care. Many have left their jobs or are considering it, a trend that could worsen poverty for some.

Stacker looked at data from the Census Bureau, the Bureau of Labor Statistics, charitable organizations, university studies, and other documents to compile this list of 50 facts about poverty in the United States.

Poverty rate dropped in 2019

oneinchpunch // Shutterstock

1 / 50

Poverty rate dropped in 2019

The poverty rate in the United States dropped 1.3 percentage points in 2019, according to the Census Bureau. The rate was 10.5%, down from 11.8% in 2018.

Drop was fifth consecutive fall in poverty rate

TZIDO SUN // Shutterstock

2 / 50

Drop was fifth consecutive fall in poverty rate

The decline in 2019 was the fifth consecutive yearly drop. The poverty rate has decreased from 14.8% in 2014 to 10.5%, a decline of 4.3 percentage points.

Women are more likely to be poor

kitzcorner // Shutterstock

4 / 50

Women are more likely to be poor

More women than men lived in poverty in 2018: 12.9% of women compared to 10.6% of men. Among married couples, the rate was just 4.7%, but for a family headed by a single mother, it soared to 24.9%.

More than 4.2 million people are poor

blvdone // Shutterstock

5 / 50

More than 4.2 million people are poor

In 2019, 34 million people were considered poor, a drop of 4.2 million people compared to 2018. The federal government defines the poverty threshold as about $25,700 a year for a family of four. That threshold is an unrealistically low number, according to critics, who point to the poverty threshold doesn't match the reality of costs of living. If it did, the number of people the federal government defines as poor would be much higher. 

Household income rises

fizkes // Shutterstock

6 / 50

Household income rises

At the same time, the median household income rose 6.8% to $68,703. All workers saw their real median earnings increase by 1.4% from 2018 to 2019, though the increase was smaller for full-time, year-round workers, at 0.8%. The cost-of-living increase for 2020 is 1.6%.

The number of workers increases

ChameleonsEye // Shutterstock

7 / 50

The number of workers increases

Between 2018 and 2019, there was a 1.2 million increase in the number of full-time workers. The total of people with earnings rose even more, by 2.2 million.

Coronavirus pandemic causes economic slide

Drew Angerer // Getty Images

8 / 50

Coronavirus pandemic causes economic slide

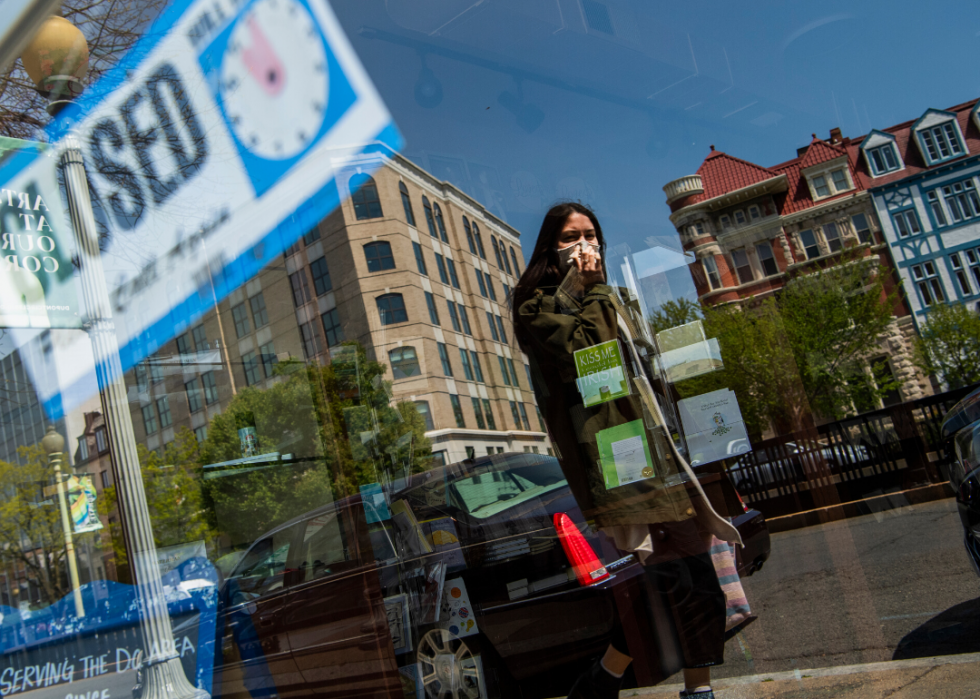
When the coronavirus reached the United States in the spring of 2020, the economy tumbled. In just three months, between February and May, 14 percent of Americans lost their jobs. The unemployment rate skyrocketed from 3.5% in February to more than 19% in April.

Almost half of American households lose income

Spencer Platt // Getty Images

9 / 50

Almost half of American households lose income

By the end of April 2020, almost half of American adults lived in a household that had lost wages. The drop disproportionately affected lower-income workers.

Coronavirus pandemic results in long-term unemployed

Brian van der Brug // Los Angeles Times via Getty Images

10 / 50

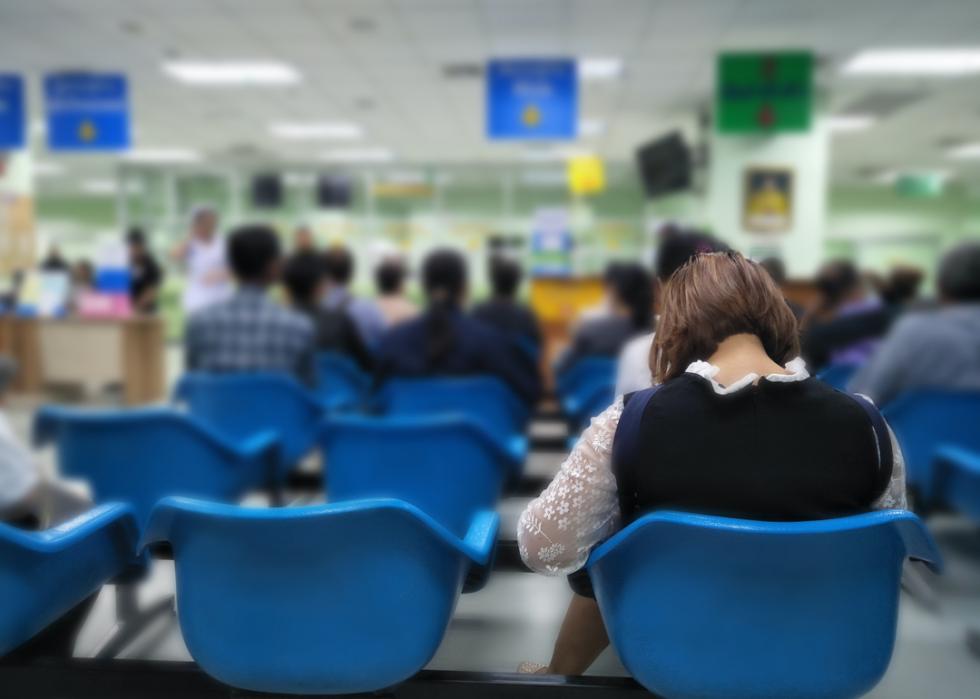
Coronavirus pandemic results in long-term unemployed

By September 2020 the economy had recovered about half of the 22 million jobs lost between February and April. Nonetheless, at the beginning of October 2020, 2.4 million people had not been employed for 27 weeks or more, considered long-term joblessness by the U.S. Bureau of Labor Statistics.

Pandemic fallout hits unequally

Spencer Platt // Getty Images

11 / 50

Pandemic fallout hits unequally

In October 2020, the unemployment rate fell to to 6.9%, a drop of 1 percentage point. It marked the sixth consecutive month of declines, but the rate remained almost two times the 3.5% of February and job losses were unevenly distributed. The rate was 6.0% for whites, but 7.6% for Asians, 8.8% for Hispanics, and 10.8% for Blacks.

Some workers are laid off temporarily

Tom Williams/CQ-Roll Call, Inc via Getty Images

12 / 50

Some workers are laid off temporarily

Some of those who are unemployed have been laid off temporarily, and that number fell in October 2020 by 1.4 million to 3.2 million, according to data from the U.S. Bureau of Labor Statistics. That is below the high of 18.1 million in April, but still 2.4 million above that of February.

3.7 million find themselves permanently unemployed

OLIVIER DOULIERY/AFP via Getty Images

13 / 50

3.7 million find themselves permanently unemployed

Another 3.7 million have lost their jobs permanently as of October 2020. The number is 2.4 million higher than in February.

One quarter of disabled people are poor

VGstockstudio // Shutterstock

14 / 50

One quarter of disabled people are poor

One quarter of people with a disability were living in poverty in 2018, 25.7%. That adds up to almost 4 million people.

One in six children live in poverty

Potential Filmmaker // Shutterstock

15 / 50

One in six children live in poverty

Almost one in six children was classified as poor in 2018. That is 16.2% of all children, for a total of 11.9 million. Across the country, 2.5 million children are homeless over a year time period.

At least 9.7% of seniors are poor

evrymmnt // Shutterstock

16 / 50

At least 9.7% of seniors are poor

In 2018, 9.7% of seniors were poor, according to Census data. The actual number could be higher, according to PovertyUSA, an initiative of the Catholic Campaign for Human Development. The Supplemental Poverty Measure, which includes the increased cost of healthcare and other such expenses, ups the rate to 14.1%.

Native Americans have the highest poverty rate

sattahipbeach // Shutterstock

17 / 50

Native Americans have the highest poverty rate

Poverty falls unequally among ethnic and racial groups, from highs of 25.4% among Native Americans, 20.8% for Blacks, and 17.6% for Hispanics. Whites and Asians both have rates of 10.1%. The 2018 data is from the U.S. Census.

More than 93 million are close to poverty

MikeDotta // Shutterstock

18 / 50

More than 93 million are close to poverty

According to PovertyUSA, 5.3% of the country, totalling 17.3 million people, live in what is called deep poverty, defined as incomes below half of a poverty threshold. Another 29.9%, for a total of 93.6 million people, are close to poverty.

More than half of poor people are women

Jonathan Weiss // Shutterstock

19 / 50

More than half of poor people are women

Of the 38.1 million people who were poor in 2018, more than half—56 percent—were women. That amounts to 21.4 million. Pandemic-related job losses that have disproportionately affected women threaten to raise that number.

Women across races, ethnicities fare worse than men

TZIDO SUN // Shutterstock

20 / 50

Women across races, ethnicities fare worse than men

Women are more likely to be poor than men no matter their race or ethnicity. Native American women, Black women, and Latinas have the highest rates of poverty. One in four of Native American women, including Alaskan Native women, live in poverty, the highest rate of poverty in the country.

Black women, Latinas are disproportionately poor

fizkes // Shutterstock

21 / 50

Black women, Latinas are disproportionately poor

Black and Hispanic women are disproportionately poor. Black women represent 12.8% of women in the United States, but 22.3% of women living in poverty. For Hispanic women, the numbers are similar: 18.1% of women but 27.1% of women living in poverty.

Unmarried mothers are worse off than married women

Newman Studio // Shutterstock

22 / 50

Unmarried mothers are worse off than married women

When unmarried mothers are compared to married women, the unmarried women face higher rates of poverty. Almost a fourth are considered poor. Among children younger than 18 in 2018, 11.9 million lived in poverty.

Women more likely than men to be poor

Icatnews // Shutterstock

23 / 50

Women more likely than men to be poor

Women aged 25 to 35 are 69% more likely than men of their age to be poor. The poverty rates continue to diverge when women and men get older, when 13.2% of women live in poverty compared to only 8.8% of men.

Gay women face higher hurdles

kudla // Shutterstock

24 / 50

Gay women face higher hurdles

LGBTQ+ women are more often poor than straight women or men: 17.9 percent of lesbian women, 29.4 percent of bisexual women, and 29.4 percent of transgender people, according to a 2019 survey from UCLA Law School’s Williams Institute.

Women earn less than men

fizkes // Shutterstock

25 / 50

Women earn less than men

Women, particularly women of color, earn less than men—82 cents on the dollar, according to 2018 U.S. Census Bureau data. Latinas earn 54 cents, Native women earn 57 cents, and Black women earn 62 cents.

Food insecurity affects 11.1% of families

Sara Carpenter // Shutterstock

26 / 50

Food insecurity affects 11.1% of families

Among American households in 2018, 11.1% reported being food insecure —not being able to provide enough food all of the time. That adds up to 14.3 million households, according to the US Department of Agriculture.

Pandemic worsens food insecurity

Sara Carpenter // Shutterstock

27 / 50

Pandemic worsens food insecurity

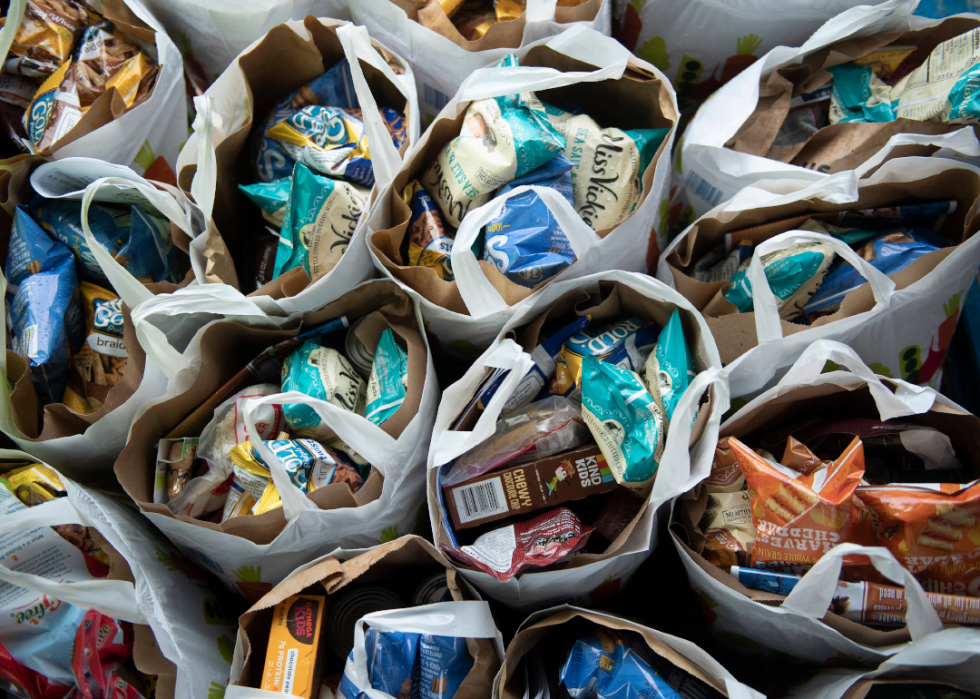
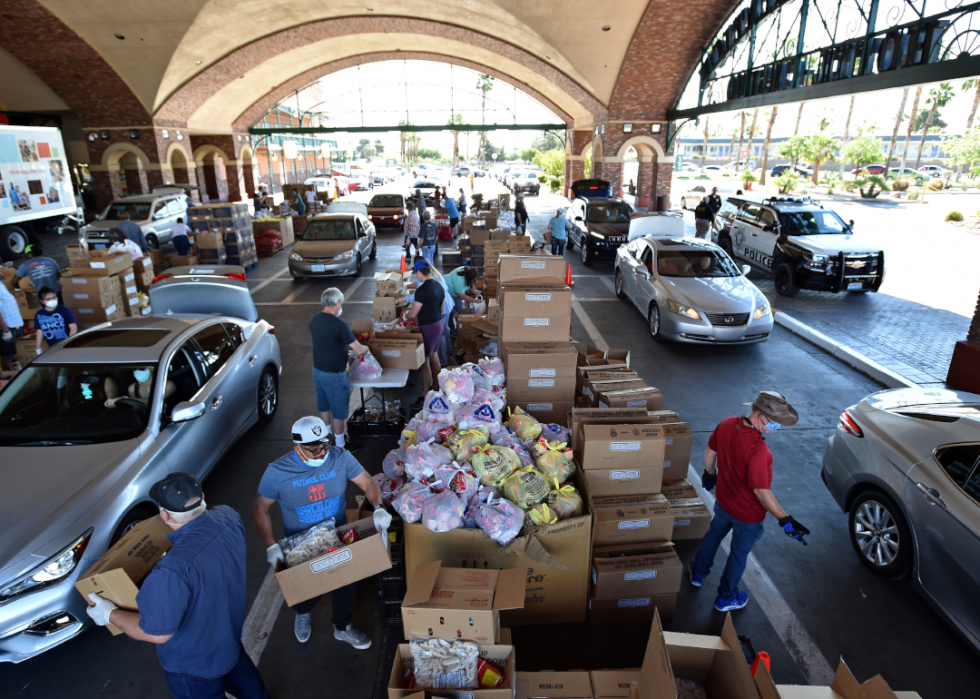
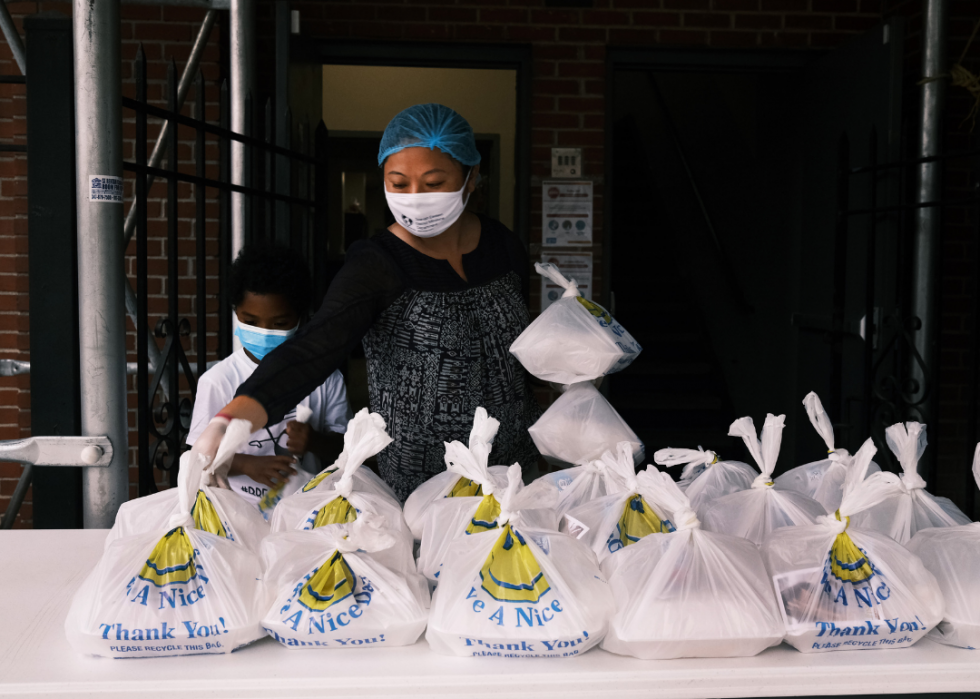
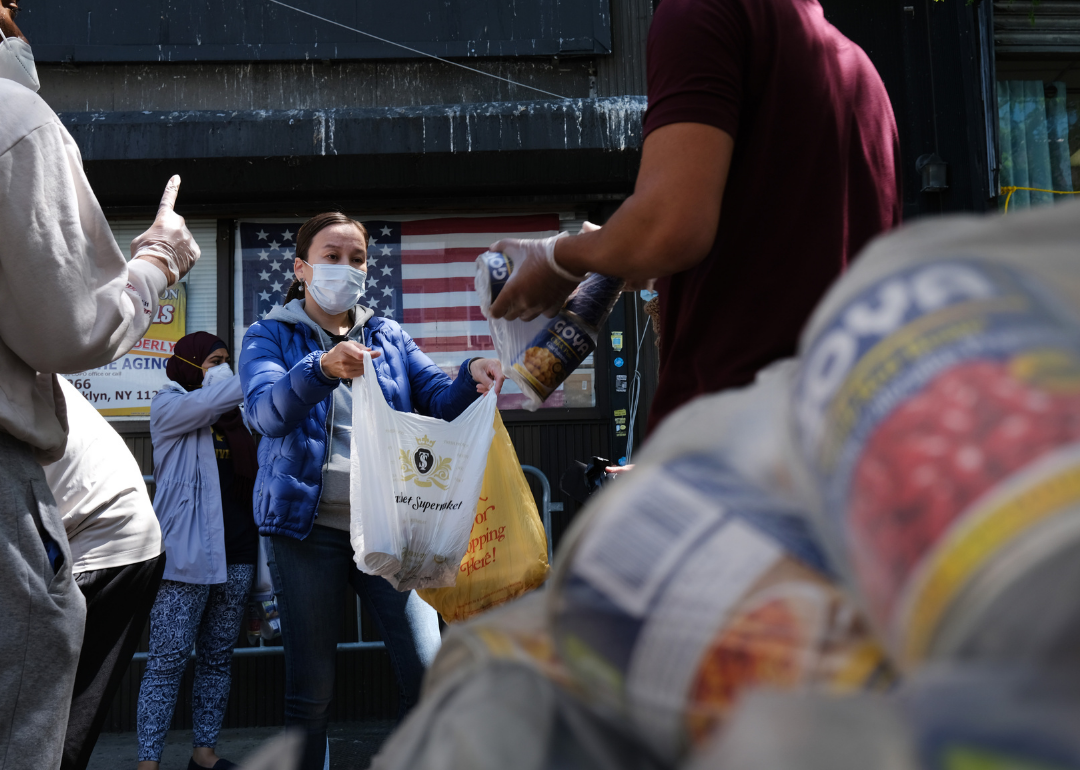
The coronavirus pandemic could leave more than 50 million people facing food insecurity in 2020, among them 17 million children, according to Feeding America, the country’s biggest hunger-relief organization.

Families more likely to lack enough food

Spencer Platt // Getty Images

28 / 50

Families more likely to lack enough food

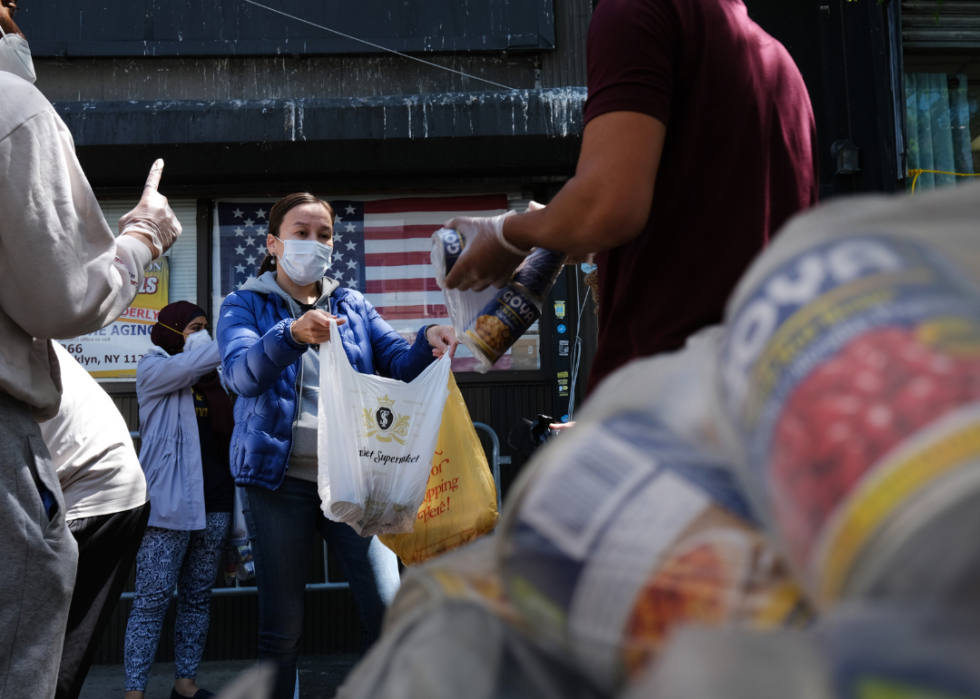
Even before the pandemic, more than 10 million children could not be certain they would have enough food to eat. Families with children are more likely to be food insecure, especially after schools and childcare that provided meals were forced to close.

Pandemic keeps food bank volunteers at home

Lauren A. Little/MediaNews Group/Reading Eagle via Getty Images

29 / 50

Pandemic keeps food bank volunteers at home

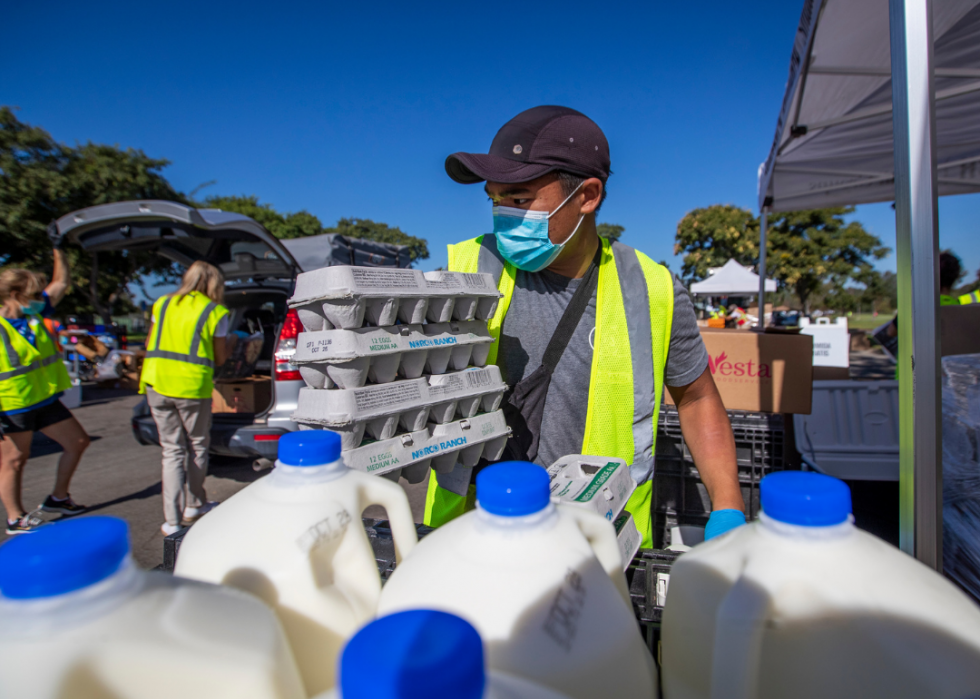
Feeding America has a network of 200 food banks across the country, relying on 2 million volunteers to help distribute the food. Often those volunteers are older, however, and the coronavirus pandemic has sidelined many of them.

Mississippi faces the highest rate of food insecurity

BRENDAN SMIALOWSKI/AFP via Getty Images

30 / 50

Mississippi faces the highest rate of food insecurity

Mississippi is expected to have the highest rate of food insecurity for 2020 at 22.6%. Its rate in 2018 was 18.7%, also the highest in the country.

California would have the most food-insecure households

Allen J. Schaben / Los Angeles Times via Getty Images

31 / 50

California would have the most food-insecure households

California, the state with the largest population, is also projected to have the largest absolute increase in the number of households uncertain about having enough food. The expected increase is 1.9 million, for a total of 6.2 million people.

North Dakota would have the least

Sara Carpenter // Shutterstock

32 / 50

North Dakota would have the least

By contrast, in North Dakota, the proportion of food-insecure households is expected to be only 9.7%, the lowest across the country. The state was the lowest in 2018 as well, at 6.8%.

One example of need: San Antonio doubles distribution

lev radin // Shutterstock

33 / 50

One example of need: San Antonio doubles distribution

In one example of the tremendous need since the pandemic struck, the head of the San Antonio Food Bank told CNBC that the organization was feeding 120,000 people a week, double the number from before the pandemic. Most were visiting a food bank for the first time.

29.6 million Americans lacked health insurance

Valeri Potapova // Shutterstock

34 / 50

29.6 million Americans lacked health insurance

As far as health insurance in 2019 in the United States, 9.2 percent of residents did not have coverage at the time they were interviewed for the Census Bureau’s American Community Survey. That represents a total of 29.6 million people, an increase from the 28.6 million insured people in 2018.

Percentage of uninsured rose in 19 states

toodtuphoto // Shutterstock

35 / 50

Percentage of uninsured rose in 19 states

In all, 8 percent of the country's residents did not have health insurance at any point in 2019, for a total of 26.1 million people. The percentage of people who lacked health insurance rose in 19 states between 2018 and 2019, according to Census Bureau data.

Uninsured numbers rose three years in a row

Jacob L. // Shutterstock

36 / 50

Uninsured numbers rose three years in a row

The number of Americans without insurance rose for three years in a row, starting in 2017, according to the Kaiser Family Foundation, which focuses on healthcare. The number of uninsured rose from 26.7 million in 2016 to 28.9 million in 2019.

Millions lose insurance in pandemic-related layoffs

Joyseulay // Shutterstock

37 / 50

Millions lose insurance in pandemic-related layoffs

The Kaiser Family Foundation estimates that the pandemic has meant a loss of health insurance for 27 million Americans and their families. Before the layoffs, 61% were covered by insurance through their jobs. They could now be eligible for insurance through the Medicaid expansion that’s part of Obamacare, or the COBRA program that allows them to keep job-sponsored insurance for a limited period, but COBRA payments can be high.

Insurance loss tops that of 2008 recession

alexkich // Shutterstock

38 / 50

Insurance loss tops that of 2008 recession

Another study, from Families USA, found that the economic upheaval brought by the pandemic meant that between February and May 2020 5.4 million workers lost their jobs and as a result their health insurance. That is even higher than the number who lost insurance at the start of the 2008 recession, 3.9 million.

Pandemic increases workload on women

Ilona Titova // Shutterstock

39 / 50

Pandemic increases workload on women

In a development that could drive up poverty rates, the pandemic has increased the workload for women at home, as schools and child-care centers close, and some women have been forced to leave their jobs as a result. Women already were responsible for most of the care of children. In homes with children 5 and younger, one quarter of women worked out of the house part-time and 35% did not work outside the house at all.

One-fourth of women could give up their jobs

Drazen Zigic // Shutterstock

40 / 50

One-fourth of women could give up their jobs

One quarter of women are considering giving up their jobs or taking on less responsibility as a result of the coronavirus pandemic, according to a report from McKinsey & Company and Lean In. Black women already must overcome more obstacles in the workplace and now also are part of a community that is disproportionately becoming ill from COVID-19.

Pandemic drives women from the labor market

Jennifer M. Mason // Shutterstock

41 / 50

Pandemic drives women from the labor market

Four times as many women as men left the workforce in September 2020, according to the National Women’s Law Center. Of the 1.1 million workers who stopped seeking employment, 865,000 or 80.0% were women. Among them were 324,000 Latinas and 58,000 Black women.

Pandemic pushing up poverty rate

Spencer Platt // Getty Images

42 / 50

Pandemic pushing up poverty rate

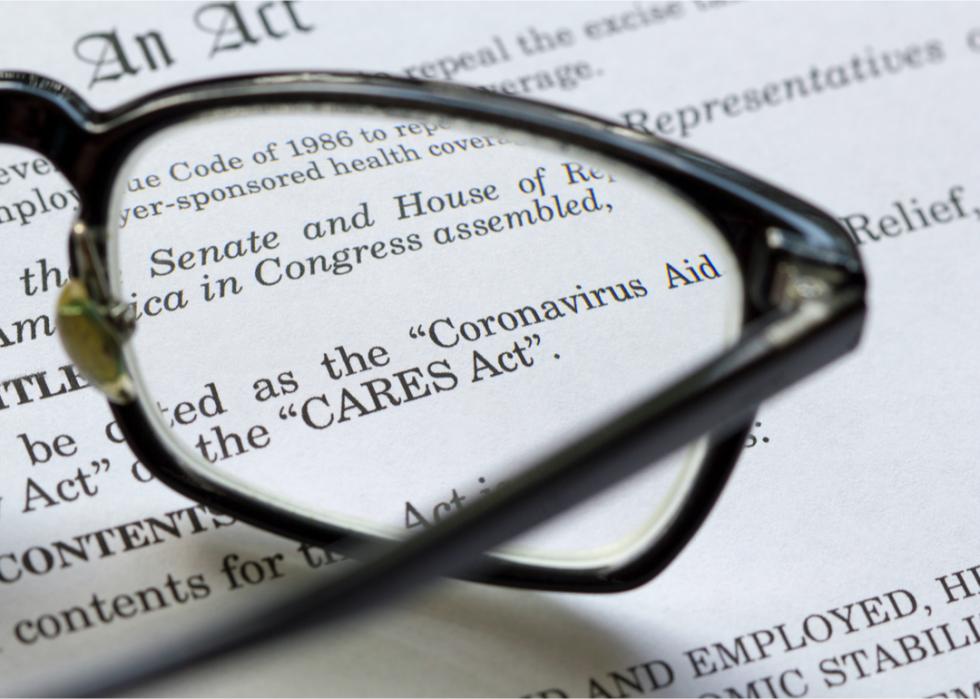
As a result of the pandemic, poverty rates rose, even with the payments made to families under the federal CARES Act, which offered up to $1,200 for adults with incomes of less than $99,000 and $500 for children under 17. The data is from a study from Columbia University.

Hardships hit Black and Hispanic people

fizkes // Shutterstock

43 / 50

Hardships hit Black and Hispanic people

The number of poor people increased by 8 million between May and October, according to the study. The monthly poverty rate rose from 15% in February 2020 to 16.7% in September 2020, despite the cash payments under the CARES Act. Black and Hispanic people have been especially affected, as have children.

Number of poor people dropped by 18 million

Tada Images // Shutterstock

44 / 50

Number of poor people dropped by 18 million

Together, unemployment benefits and the CARES checks meant 18 million fewer poor people in April, but when the extra $600 a week COVID-19 unemployment benefit expired, that number dropped to 4 million in August and September.

Monthly poverty rate rises above pre-pandemic levels

DAVID BECKER/AFP via Getty Images

45 / 50

Monthly poverty rate rises above pre-pandemic levels

When both the CARES Act's stimulus checks and $600 unemployment supplement expired, the monthly poverty rate rose higher in September than in April or May. The rate was also higher than it had been before the pandemic.

Jobless claims rise for second week

OLIVIER DOULIERY/AFP via Getty Images

46 / 50

Jobless claims rise for second week

Jobless claims rose to 778,000 the week before Thanksgiving 2020, the second week of an increase, the Labor Department reported. Claims the week before totaled 742,000.

Illinois records the largest increase

fizkes // Shutterstock

47 / 50

Illinois records the largest increase

The largest increase in jobless claims came in Illinois, up by 18,225. Michigan followed with 15,843, and then Washington state, with 13,179.

Jobless claims topped out at 7 million

lev radin // Shutterstock

48 / 50

Jobless claims topped out at 7 million

Jobless claims were at the highest in March at 7 million. That compares to 282,000 in mid-March, when the pandemic first hit.

Poverty rates differ between native and foreign born

Spencer Platt // Getty Images

49 / 50

Poverty rates differ between native and foreign born

Poverty rates differ for residents born in the United States and those born elsewhere. In 2019, among those born in the United States, the rate was 11.8%, compared to 13.5% for those born elsewhere. Foreign-born residents who are not citizens had a rate of 17.7%.

Poverty rate fell through 1960s

wutzkohphoto / Shutterstock

50 / 50

Poverty rate fell through 1960s

The poverty rate among Americans in the late 1950s was 22.4% or 39.5 million people. These numbers fell through the 1960s, to a low in 1973 of 11.1%, or 22.9 million people.