SKT Studio // Shutterstock
1 / 50#50. Oklahoma City
- Motor vehicle crash fatalities: 12.23 per 100,000 residents (81 total)
- Pedestrian fatalities from vehicle crashes: 3.77 per 100,000 residents (25 total)

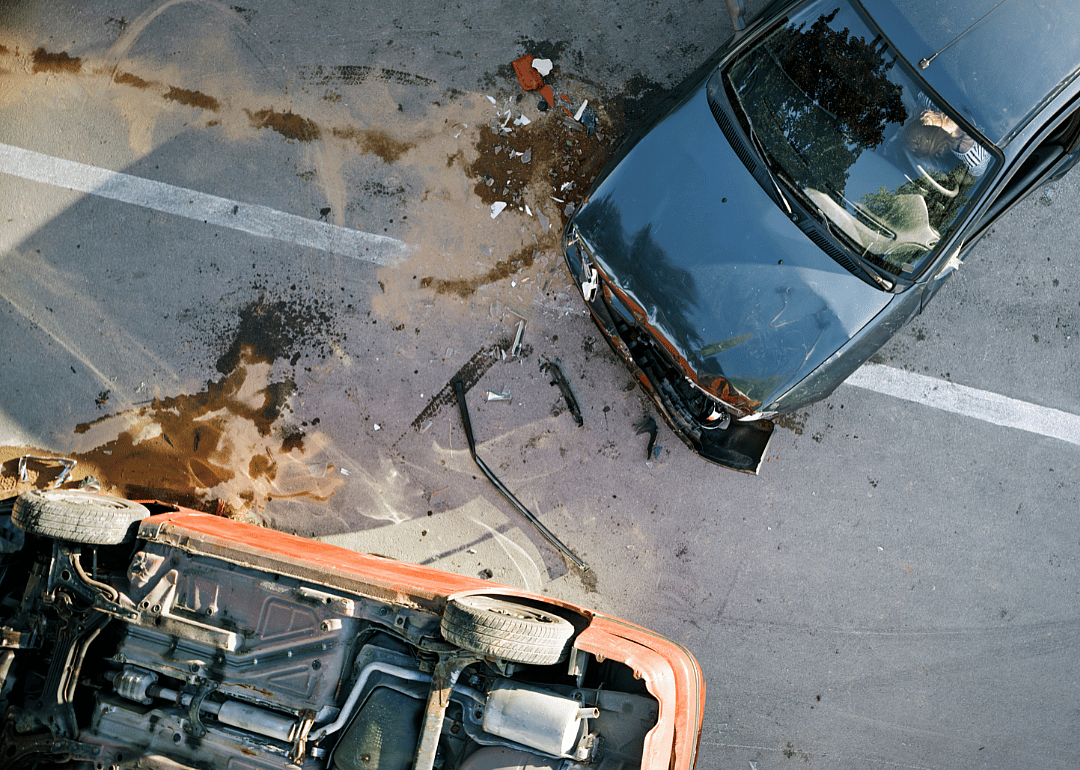
The last few years saw a startling trend on America's roads. The number of car crash fatalities in 2021 and 2022 reached levels the country hadn't seen in 15 years. But that pattern may be changing. According to an April 2024 report released by the National Highway Traffic Safety Administration, an estimated 40,990 people died in traffic accidents in 2023, as compared to 42,514 the year prior. It's the second straight year that car crash fatalities overall have gone down.
Though the 3.6% drop from 2022 to 2023 is significant, authorities warn that these numbers are no cause for celebration. Upon release of the report, the deputy administrator of the NHTSA told AP that distracted drivers are often to blame for driving fatalities—roughly 3,300 of traffic deaths in 2022 were caused by drivers not paying enough attention to the road.
Unfortunately, drivers today are much more distracted than you might think. In April 2024, Nationwide released new data showing that the average driver looks away from the road upward of 12 times per day. Eating ranked as the #1 distraction, and making work phone calls came in second.
As summer kicks off, it's also worth noting that the season can be an especially deadly time for American drivers and their passengers. A May 2024 analysis from USA Today found that in some states, the number of deadly car accidents in June, July, and August has increased by almost 40%.
These numbers do vary in greatly in different areas of the country. To see how they compare, Stacker used Department of Transportation data to rank the 50 cities with the highest motor vehicle crash fatality rates in 2020 and broke ties by the total number of fatalities. Only cities with a population of at least 150,000 were considered.
Many of the cities that rank among the most deadly are located in the southern U.S. Read on to see if your city made the list.
You may also like: As touchscreens everywhere prompt for tips, consumers feel fatigue—and frustration
SKT Studio // Shutterstock
1 / 50- Motor vehicle crash fatalities: 12.23 per 100,000 residents (81 total)
- Pedestrian fatalities from vehicle crashes: 3.77 per 100,000 residents (25 total)

William A. Morgan // Shutterstock
2 / 50- Motor vehicle crash fatalities: 12.25 per 100,000 residents (25 total)
- Pedestrian fatalities from vehicle crashes: 1.96 per 100,000 residents (4 total)

Dmitry Kalinovsky // Shutterstock
3 / 50- Motor vehicle crash fatalities: 12.25 per 100,000 residents (48 total)
- Pedestrian fatalities from vehicle crashes: 1.28 per 100,000 residents (5 total)

Gorodenkoff // Shutterstock
4 / 50- Motor vehicle crash fatalities: 12.29 per 100,000 residents (22 total)
- Pedestrian fatalities from vehicle crashes: 1.68 per 100,000 residents (3 total)

Kwangmoozaa // Shutterstock
5 / 50- Motor vehicle crash fatalities: 12.70 per 100,000 residents (34 total)
- Pedestrian fatalities from vehicle crashes: 2.24 per 100,000 residents (6 total)
You may also like: Here's why 61% of Americans think AI could spell the end of humanity

Godlikeart // Shutterstock
6 / 50- Motor vehicle crash fatalities: 12.72 per 100,000 residents (60 total)
- Pedestrian fatalities from vehicle crashes: 4.45 per 100,000 residents (21 total)

Dmitry Kalinovsky // Shutterstock
7 / 50- Motor vehicle crash fatalities: 12.74 per 100,000 residents (25 total)
- Pedestrian fatalities from vehicle crashes: 4.08 per 100,000 residents (8 total)

Vereshchagin Dmitry // Shutterstock
8 / 50- Motor vehicle crash fatalities: 12.81 per 100,000 residents (26 total)
- Pedestrian fatalities from vehicle crashes: 3.94 per 100,000 residents (8 total)

Gorodenkoff // Shutterstock
9 / 50- Motor vehicle crash fatalities: 12.89 per 100,000 residents (35 total)
- Pedestrian fatalities from vehicle crashes: 2.21 per 100,000 residents (6 total)

Krummerchen // Shutterstock
10 / 50- Motor vehicle crash fatalities: 13.09 per 100,000 residents (51 total)
- Pedestrian fatalities from vehicle crashes: 2.57 per 100,000 residents (10 total)
You may also like: When police kill and use victims' rights laws to stay anonymous

Ground Picture // Shutterstock
11 / 50- Motor vehicle crash fatalities: 13.11 per 100,000 residents (224 total)
- Pedestrian fatalities from vehicle crashes: 4.27 per 100,000 residents (73 total)

Juice Flair // Shutterstock
12 / 50- Motor vehicle crash fatalities: 13.22 per 100,000 residents (51 total)
- Pedestrian fatalities from vehicle crashes: 3.63 per 100,000 residents (14 total)

osobystist // Shutterstock
13 / 50- Motor vehicle crash fatalities: 13.39 per 100,000 residents (71 total)
- Pedestrian fatalities from vehicle crashes: 5.47 per 100,000 residents (29 total)

pictoplay // Shutterstock
14 / 50- Motor vehicle crash fatalities: 13.67 per 100,000 residents (27 total)
- Pedestrian fatalities from vehicle crashes: 5.06 per 100,000 residents (10 total)

Phase4Studios // Shutterstock
15 / 50- Motor vehicle crash fatalities: 14.63 per 100,000 residents (59 total)
- Pedestrian fatalities from vehicle crashes: 3.97 per 100,000 residents (16 total)
You may also like: The deadliest and safest cities for pedestrians

Ground Picture // Shutterstock
16 / 50- Motor vehicle crash fatalities: 14.64 per 100,000 residents (31 total)
- Pedestrian fatalities from vehicle crashes: 6.14 per 100,000 residents (13 total)

Dmitry Kalinovsky // Shutterstock
17 / 50- Motor vehicle crash fatalities: 14.77 per 100,000 residents (87 total)
- Pedestrian fatalities from vehicle crashes: 2.55 per 100,000 residents (15 total)

Zoran Ras // Shutterstock
18 / 50- Motor vehicle crash fatalities: 14.80 per 100,000 residents (29 total)
- Pedestrian fatalities from vehicle crashes: 2.04 per 100,000 residents (4 total)

Nutnaree Saingwongwattana// Shutterstock
19 / 50- Motor vehicle crash fatalities: 14.88 per 100,000 residents (23 total)
- Pedestrian fatalities from vehicle crashes: 2.59 per 100,000 residents (4 total)

rdjan Randjelovic // Shutterstock
20 / 50- Motor vehicle crash fatalities: 14.91 per 100,000 residents (28 total)
- Pedestrian fatalities from vehicle crashes: 2.66 per 100,000 residents (5 total)
You may also like: 10 cities with the most single men and women

Aedonis // Shutterstock
21 / 50- Motor vehicle crash fatalities: 15.06 per 100,000 residents (23 total)
- Pedestrian fatalities from vehicle crashes: 2.62 per 100,000 residents (4 total)

Ground Picture // Shutterstock
22 / 50- Motor vehicle crash fatalities: 15.26 per 100,000 residents (134 total)
- Pedestrian fatalities from vehicle crashes: 4.44 per 100,000 residents (39 total)

Wangkun Jia // Shutterstock
23 / 50- Motor vehicle crash fatalities: 15.49 per 100,000 residents (104 total)
- Pedestrian fatalities from vehicle crashes: 5.51 per 100,000 residents (37 total)

Lopolo // Shutterstock
24 / 50- Motor vehicle crash fatalities: 15.55 per 100,000 residents (45 total)
- Pedestrian fatalities from vehicle crashes: 3.80 per 100,000 residents (11 total)

Ground Picture // Shutterstock
25 / 50- Motor vehicle crash fatalities: 15.70 per 100,000 residents (64 total)
- Pedestrian fatalities from vehicle crashes: 3.43 per 100,000 residents (14 total)
You may also like: What graduation party traditions look like around the world

TFoxFoto // Shutterstock
26 / 50- Motor vehicle crash fatalities: 15.77 per 100,000 residents (30 total)
- Pedestrian fatalities from vehicle crashes: 2.63 per 100,000 residents (5 total)

Kycheryavuy // Shutterstock
27 / 50- Motor vehicle crash fatalities: 15.80 per 100,000 residents (81 total)
- Pedestrian fatalities from vehicle crashes: 4.88 per 100,000 residents (25 total)

round Picture // Shutterstock
28 / 50- Motor vehicle crash fatalities: 16.53 per 100,000 residents (222 total)
- Pedestrian fatalities from vehicle crashes: 4.91 per 100,000 residents (66 total)

Tony Dunn // Shutterstock
29 / 50- Motor vehicle crash fatalities: 16.78 per 100,000 residents (31 total)
- Pedestrian fatalities from vehicle crashes: 4.33 per 100,000 residents (8 total)

Aleksandar Nalbantjan // Shutterstock
30 / 50- Motor vehicle crash fatalities: 17.25 per 100,000 residents (29 total)
- Pedestrian fatalities from vehicle crashes: 3.57 per 100,000 residents (6 total)
You may also like: Population growth is greatest in these US states

Glenn Highcove // Shutterstock
31 / 50- Motor vehicle crash fatalities: 17.28 per 100,000 residents (26 total)
- Pedestrian fatalities from vehicle crashes: 3.99 per 100,000 residents (6 total)

bibiphoto // Shutterstock
32 / 50- Motor vehicle crash fatalities: 17.70 per 100,000 residents (88 total)
- Pedestrian fatalities from vehicle crashes: 3.22 per 100,000 residents (16 total)

Silent O // Shutterstock
33 / 50- Motor vehicle crash fatalities: 17.97 per 100,000 residents (28 total)
- Pedestrian fatalities from vehicle crashes: 5.13 per 100,000 residents (8 total)

imofeev Vladimir // Shutterstock
34 / 50- Motor vehicle crash fatalities: 18.27 per 100,000 residents (113 total)
- Pedestrian fatalities from vehicle crashes: 5.01 per 100,000 residents (31 total)

Vadim Ratnikov // Shutterstock
35 / 50- Motor vehicle crash fatalities: 18.40 per 100,000 residents (34 total)
- Pedestrian fatalities from vehicle crashes: 1.08 per 100,000 residents (2 total)
You may also like: Pedestrian crash analysis shows that even at low speeds, accidents often cause severe injuries

Photo Spirit // Shutterstock
36 / 50- Motor vehicle crash fatalities: 18.45 per 100,000 residents (34 total)
- Pedestrian fatalities from vehicle crashes: 5.43 per 100,000 residents (10 total)

Kaentian Street // Shutterstock
37 / 50- Motor vehicle crash fatalities: 18.67 per 100,000 residents (105 total)
- Pedestrian fatalities from vehicle crashes: 5.33 per 100,000 residents (30 total)
Canva
38 / 50- Motor vehicle crash fatalities: 18.99 per 100,000 residents (29 total)
- Pedestrian fatalities from vehicle crashes: 4.58 per 100,000 residents (7 total)

ESOlex // Shutterstock
39 / 50- Motor vehicle crash fatalities: 19.19 per 100,000 residents (49 total)
- Pedestrian fatalities from vehicle crashes: 5.88 per 100,000 residents (15 total)

Tiko Aramyan // Shutterstock
40 / 50- Motor vehicle crash fatalities: 19.34 per 100,000 residents (178 total)
- Pedestrian fatalities from vehicle crashes: 4.89 per 100,000 residents (45 total)
You may also like: A dozen cities set youth curfews this year, even though they don't reduce crime

Semiglass // Shutterstock
41 / 50- Motor vehicle crash fatalities: 19.81 per 100,000 residents (75 total)
- Pedestrian fatalities from vehicle crashes: 2.64 per 100,000 residents (10 total)

zef art // Shutterstock
42 / 50- Motor vehicle crash fatalities: 20.69 per 100,000 residents (45 total)
- Pedestrian fatalities from vehicle crashes: 5.52 per 100,000 residents (12 total)

GUNDAM_Ai // Shutterstock
43 / 50- Motor vehicle crash fatalities: 21.26 per 100,000 residents (44 total)
- Pedestrian fatalities from vehicle crashes: 4.35 per 100,000 residents (9 total)

Vitpho // Shutterstock
44 / 50- Motor vehicle crash fatalities: 21.73 per 100,000 residents (43 total)
- Pedestrian fatalities from vehicle crashes: 10.11 per 100,000 residents (20 total)

Dmitry Kalinovsky // Shutterstock
45 / 50- Motor vehicle crash fatalities: 22.58 per 100,000 residents (125 total)
- Pedestrian fatalities from vehicle crashes: 6.68 per 100,000 residents (37 total)
You may also like: What America can learn from Canada's new '$10 a day' child care system

EVA CARRE // Shutterstock
46 / 50- Motor vehicle crash fatalities: 26.48 per 100,000 residents (58 total)
- Pedestrian fatalities from vehicle crashes: 9.13 per 100,000 residents (20 total)

wisawa222 // Shutterstock
47 / 50- Motor vehicle crash fatalities: 27.21 per 100,000 residents (81 total)
- Pedestrian fatalities from vehicle crashes: 6.72 per 100,000 residents (20 total)

desk006 // Shutterstock
48 / 50- Motor vehicle crash fatalities: 28.71 per 100,000 residents (191 total)
- Pedestrian fatalities from vehicle crashes: 6.16 per 100,000 residents (41 total)

Laszlo66 // Shutterstock
49 / 50- Motor vehicle crash fatalities: 33.58 per 100,000 residents (53 total)
- Pedestrian fatalities from vehicle crashes: 9.50 per 100,000 residents (15 total)

Bigc Studio // Shutterstock
50 / 50- Motor vehicle crash fatalities: 34.32 per 100,000 residents (223 total)
- Pedestrian fatalities from vehicle crashes: 9.70 per 100,000 residents (63 total)
You may also like: These states offer the greatest benefits to veteran-owned businesses