Counties with the most tornadoes in Virginia

·Stacker

Canva
Canva

It's been a busy year for tornadoes in the U.S. According to the National Oceanic and Atmospheric Administration, as many as 1,155 twisters have touched down across the country since the start of the year, above the average for this time of year.

A single day can drive up tornado counts. March 31, 2023, accounted for 163 tornadoes across the Midwest and South. Tornado activity usually peaks in the spring and early summer, and the pace of tornadoes usually slows around late summer. A smaller-scale second tornado season emerges in the fall, mostly in the Gulf Coast states.

Stacker used data from NOAA's National Centers for Environmental Information to find the counties in Virginia that have experienced the most tornadoes since 2000. While data is available going back to 1950, tornado tracking by the National Weather Service became more robust and accurate in the 1990s. Since counties can vary in size, they are ranked by the number of tornadoes per 100 square miles. Counties that experienced less than five tornadoes are not included.

The counties that encounter the most tornadoes aren't all in the infamous Tornado Alley. When adjusted for county area, the top 10 counties that experienced the most tornadoes since 2000 are from nine different states, all in the Southeast with the exception of Cleveland County, Oklahoma.

Research has shown that Tornado Alley is shifting due to warming temperatures fueled by climate change. In the future, the Southeast could become the region that receives the bulk of the country's tornadoes. It's a concerning trend as the South is more populated than the Great Plains and has a higher concentration of mobile homes than other parts of the country, making the storms potentially deadlier and costlier.

As of August 2023, 75 people have died from tornadoes this year, and over 60% of those deaths occurred in mobile homes.

The best way to stay protected during tornadoes is to have multiple ways of receiving storm updates including social media, radio, television, and sirens, and to immediately seek shelter in a basement or interior room without windows when a tornado watch escalates to a warning.

Read on to see which counties experience the most tornadoes in Virginia.

You may also like: Countries to which Virginia exports the most goods

#50. Bedford County

Jon Marc Lyttle / Shutterstock

1 / 50

#50. Bedford County

- Tornadoes since 2000: 8 (1.06 per 100 square miles)
- #1,742 nationally
- Tornadoes this year, as of May 31: 0
#49. Washington County

Canva

2 / 50

#49. Washington County

- Tornadoes since 2000: 6 (1.07 per 100 square miles)
- #1,739 nationally
- Tornadoes this year, as of May 31: 0
#48. Halifax County

Canva

3 / 50

#48. Halifax County

- Tornadoes since 2000: 9 (1.10 per 100 square miles)
- #1,720 nationally
- Tornadoes this year, as of May 31: 0
#47. Albemarle County

ImagineerInc // Shutterstock

4 / 50

#47. Albemarle County

- Tornadoes since 2000: 8 (1.11 per 100 square miles)
- #1,711 nationally
- Tornadoes this year, as of May 31: 0
#46. Mecklenburg County

Canva

5 / 50

#46. Mecklenburg County

- Tornadoes since 2000: 7 (1.12 per 100 square miles)
- #1,706 nationally
- Tornadoes this year, as of May 31: 0

You may also like: Highest-earning counties in Virginia
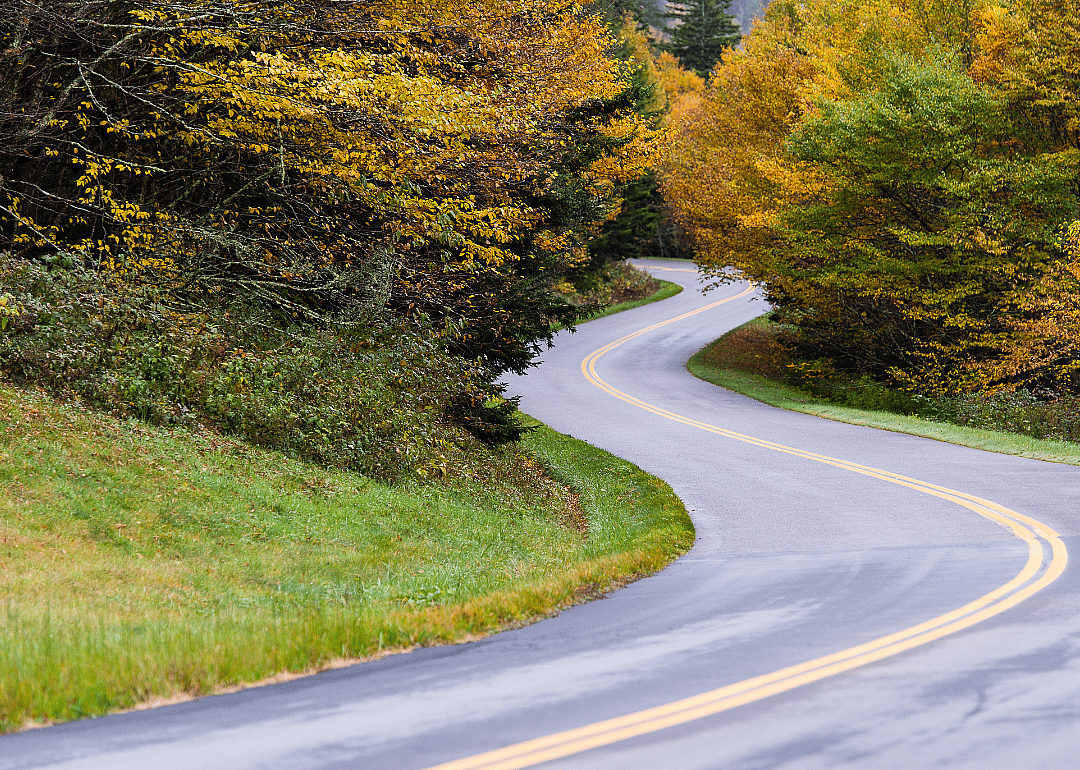
#45. Dinwiddie County

Canva

6 / 50

#45. Dinwiddie County

- Tornadoes since 2000: 6 (1.19 per 100 square miles)
- #1,653 nationally
- Tornadoes this year, as of May 31: 0
#44. Frederick County

Jon Bilous // Shutterstock

7 / 50

#44. Frederick County

- Tornadoes since 2000: 5 (1.21 per 100 square miles)
- #1,640 nationally
- Tornadoes this year, as of May 31: 0
#43. Sussex County

Canva

8 / 50

#43. Sussex County

- Tornadoes since 2000: 6 (1.22 per 100 square miles)
- #1,625 nationally
- Tornadoes this year, as of May 31: 0
#42. Brunswick County

Canva

9 / 50

#42. Brunswick County

- Tornadoes since 2000: 7 (1.24 per 100 square miles)
- #1,607 nationally
- Tornadoes this year, as of May 31: 0
#40. Lee County

Jeffery L Willis // Shutterstock

11 / 50
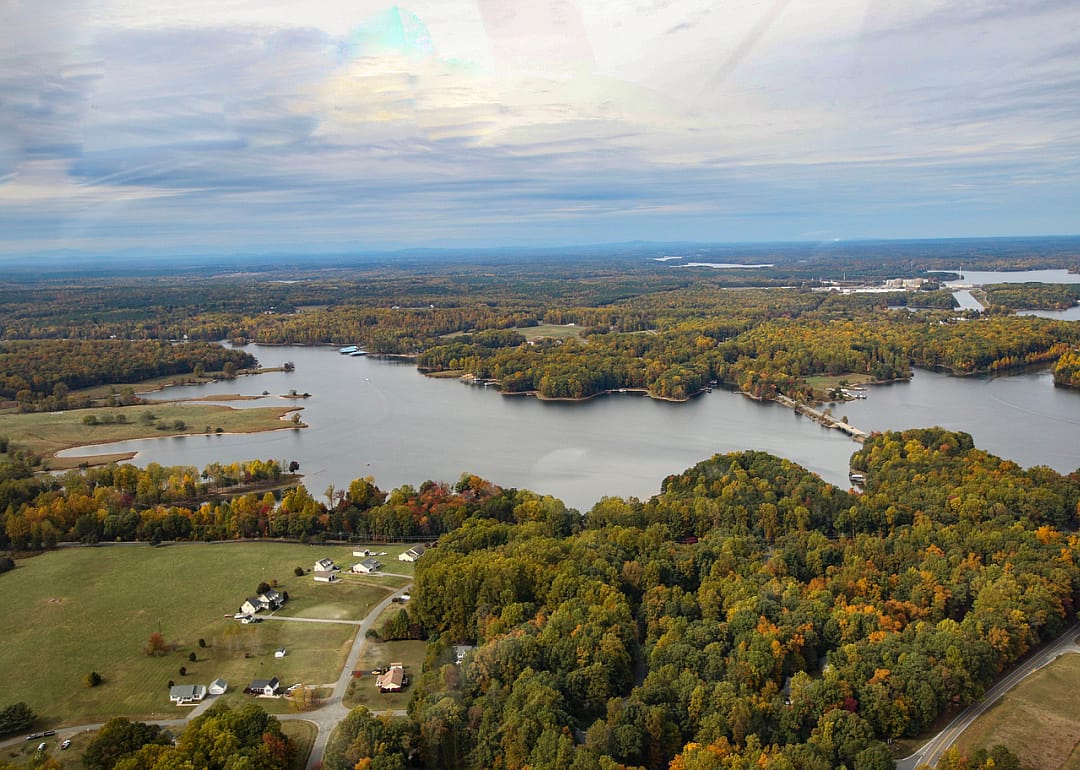
#40. Lee County

- Tornadoes since 2000: 7 (1.61 per 100 square miles)
- #1,349 nationally
- Tornadoes this year, as of May 31: 2
#39. Louisa County

ButtermilkgirlVirginia // Shutterstock

12 / 50
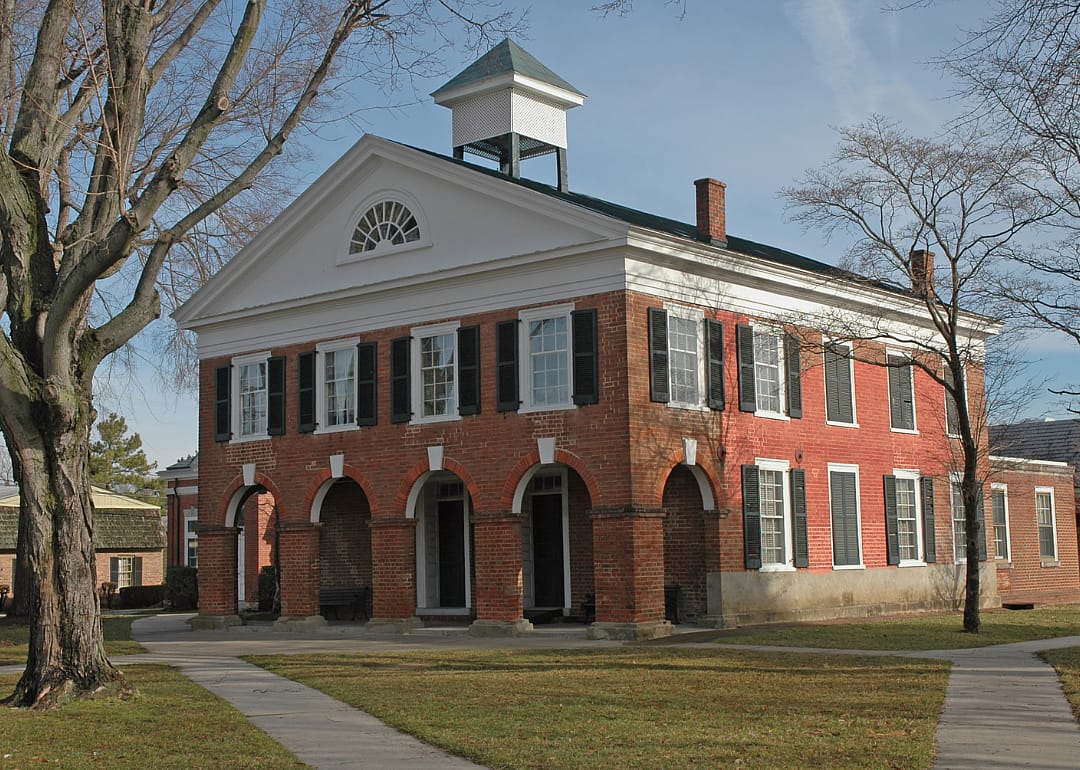
#39. Louisa County

- Tornadoes since 2000: 8 (1.61 per 100 square miles)
- #1,343 nationally
- Tornadoes this year, as of May 31: 0
#38. Caroline County

Carolyn M Carpenter // Shutterstock

13 / 50
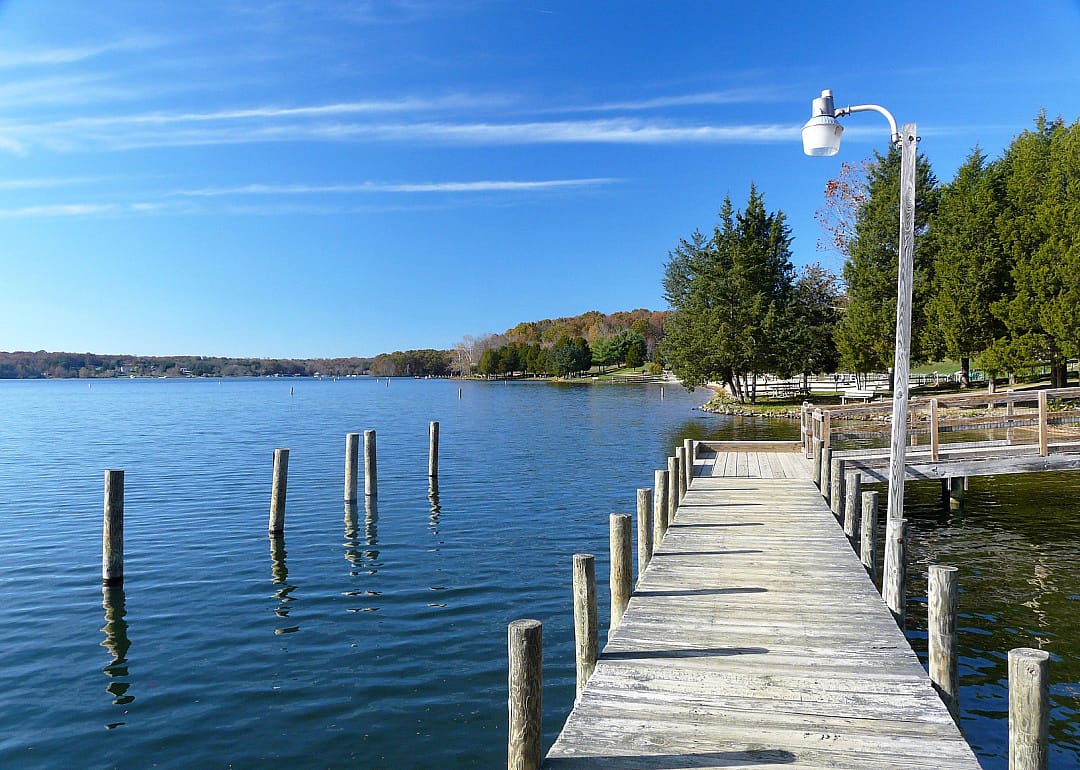
#38. Caroline County

- Tornadoes since 2000: 9 (1.71 per 100 square miles)
- #1,276 nationally
- Tornadoes this year, as of May 31: 0
#37. Spotsylvania County

Regine Poirier // Shutterstock

14 / 50

#37. Spotsylvania County

- Tornadoes since 2000: 7 (1.74 per 100 square miles)
- #1,250 nationally
- Tornadoes this year, as of May 31: 0
#35. Campbell County

Canva

16 / 50

#35. Campbell County

- Tornadoes since 2000: 9 (1.79 per 100 square miles)
- #1,218 nationally
- Tornadoes this year, as of May 31: 0
#34. Prince George County

Lekali Studio // Shutterstock

17 / 50

#34. Prince George County

- Tornadoes since 2000: 5 (1.89 per 100 square miles)
- #1,138 nationally
- Tornadoes this year, as of May 31: 0
#33. Chesterfield County

OJUP // Shutterstock

18 / 50

#33. Chesterfield County

- Tornadoes since 2000: 8 (1.89 per 100 square miles)
- #1,135 nationally
- Tornadoes this year, as of May 31: 0
#32. King and Queen County

Canva

19 / 50

#32. King and Queen County

- Tornadoes since 2000: 6 (1.90 per 100 square miles)
- #1,123 nationally
- Tornadoes this year, as of May 31: 0
#31. Culpeper County

refrina // Shutterstock

20 / 50

#31. Culpeper County

- Tornadoes since 2000: 8 (2.11 per 100 square miles)
- #977 nationally
- Tornadoes this year, as of May 31: 0

You may also like: Most common jobs 150 years ago in Virginia
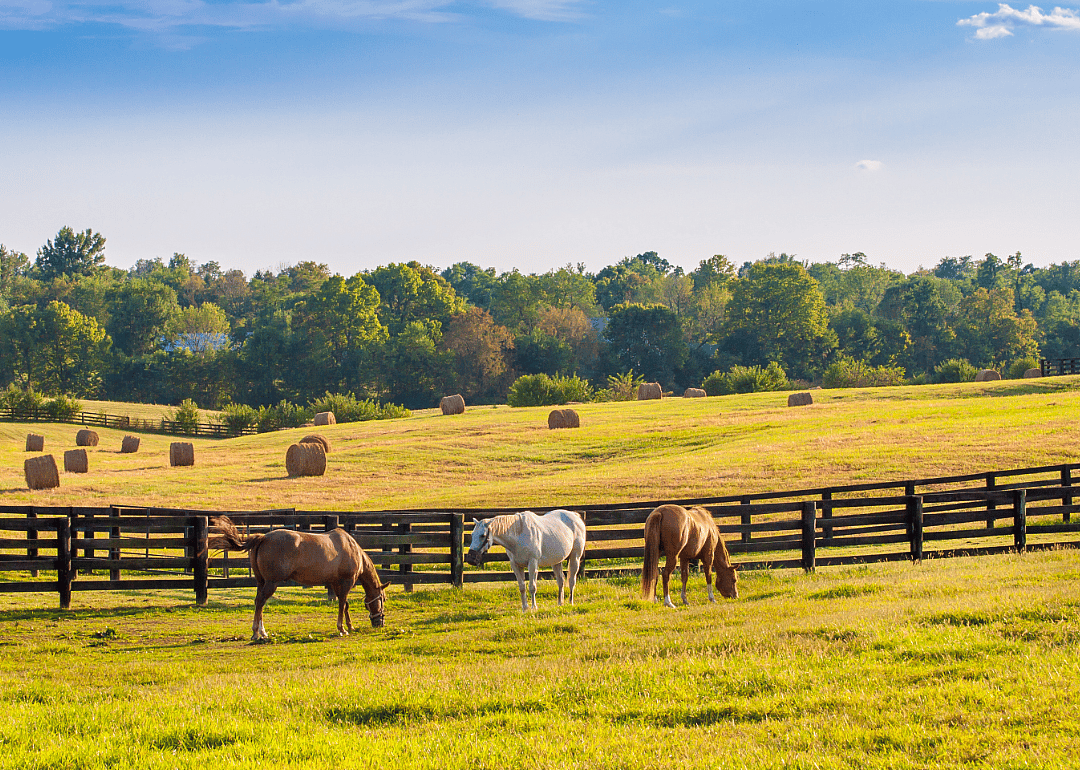
#30. Goochland County

Canva

21 / 50

#30. Goochland County

- Tornadoes since 2000: 6 (2.13 per 100 square miles)
- #964 nationally
- Tornadoes this year, as of May 31: 0
#29. Surry County

Timothy L Barnes // Shutterstock

22 / 50
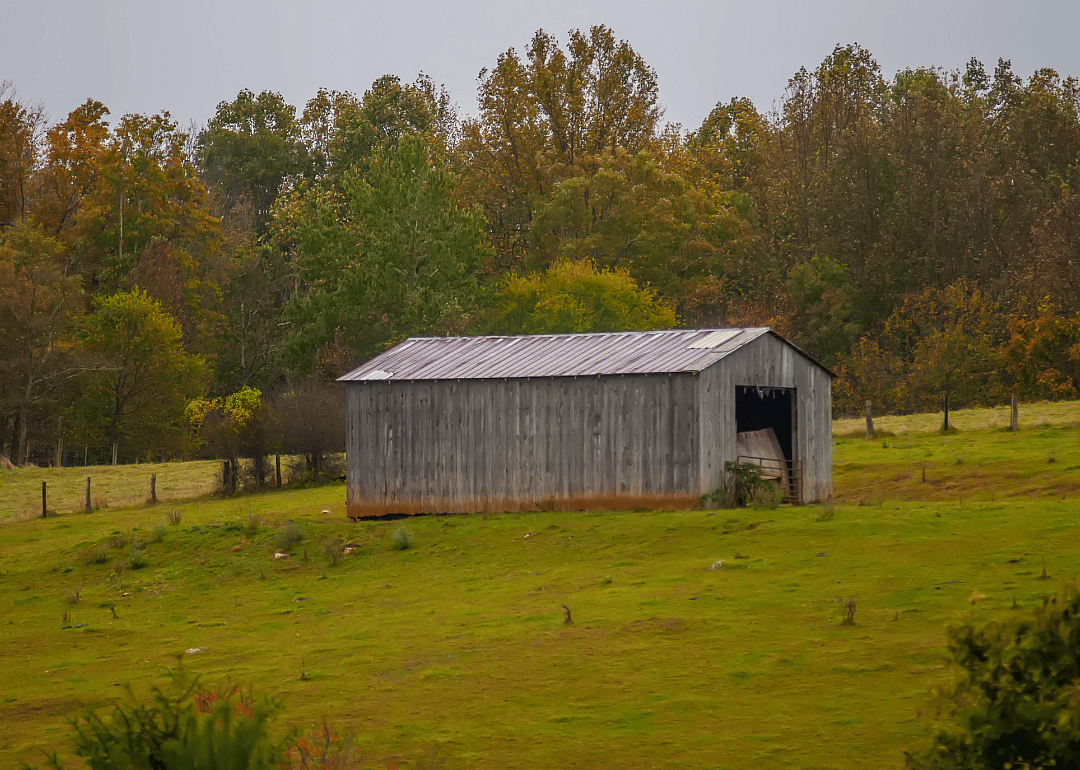
#29. Surry County

- Tornadoes since 2000: 6 (2.15 per 100 square miles)
- #955 nationally
- Tornadoes this year, as of May 31: 0
#28. King William County

Canva

23 / 50

#28. King William County

- Tornadoes since 2000: 6 (2.19 per 100 square miles)
- #936 nationally
- Tornadoes this year, as of May 31: 0
#27. Nottoway County

Don Williamson // Shutterstock

24 / 50

#27. Nottoway County

- Tornadoes since 2000: 7 (2.23 per 100 square miles)
- #906 nationally
- Tornadoes this year, as of May 31: 0
#25. Loudoun County

Canva

26 / 50

#25. Loudoun County

- Tornadoes since 2000: 12 (2.33 per 100 square miles)
- #839 nationally
- Tornadoes this year, as of May 31: 0
#24. Southampton County

Canva

27 / 50

#24. Southampton County

- Tornadoes since 2000: 14 (2.34 per 100 square miles)
- #833 nationally
- Tornadoes this year, as of May 31: 1
#23. Orange County

Kristi Blokhin // Shutterstock

28 / 50

#23. Orange County

- Tornadoes since 2000: 8 (2.35 per 100 square miles)
- #829 nationally
- Tornadoes this year, as of May 31: 0
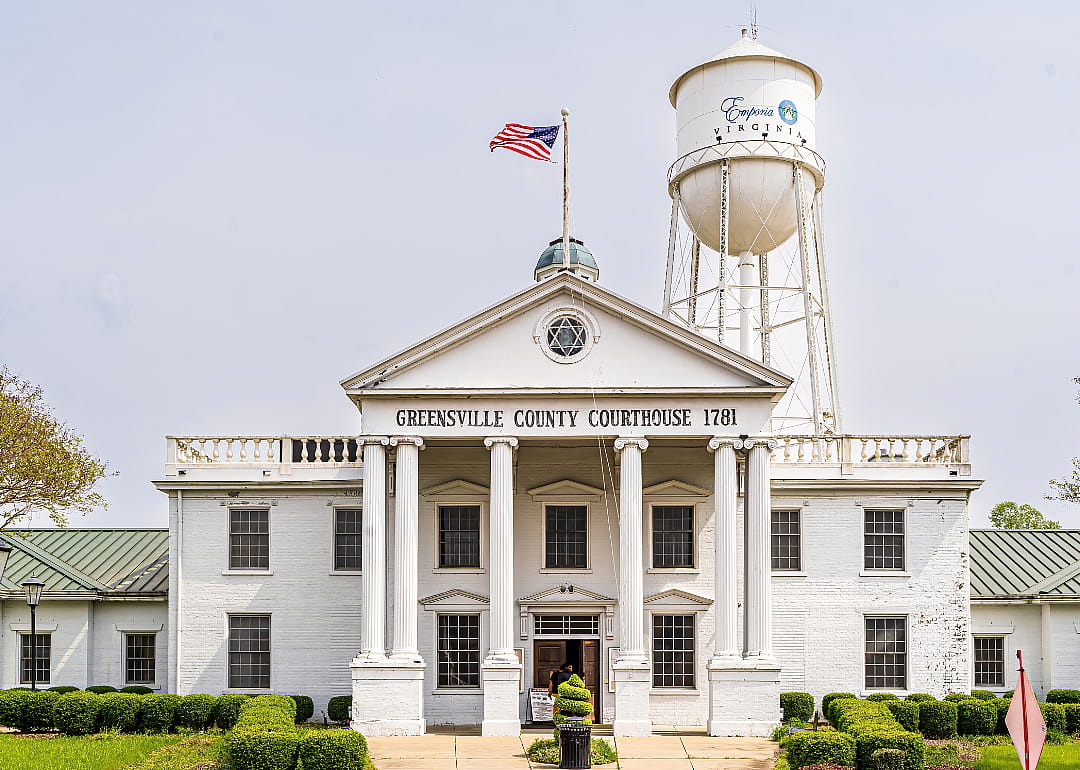
#22. Greensville County

Wileydoc // Shutterstock

29 / 50

#22. Greensville County

- Tornadoes since 2000: 7 (2.37 per 100 square miles)
- #813 nationally
- Tornadoes this year, as of May 31: 0
#20. Fluvanna County

Canva

31 / 50

#20. Fluvanna County

- Tornadoes since 2000: 7 (2.45 per 100 square miles)
- #752 nationally
- Tornadoes this year, as of May 31: 0
#19. Richmond County

Erin Cadigan // Shutterstock

32 / 50

#19. Richmond County

- Tornadoes since 2000: 5 (2.61 per 100 square miles)
- #671 nationally
- Tornadoes this year, as of May 31: 0
#18. Northumberland County

Dan Kauffman // Shutterstock

33 / 50

#18. Northumberland County

- Tornadoes since 2000: 5 (2.61 per 100 square miles)
- #670 nationally
- Tornadoes this year, as of May 31: 0
#17. Fairfax County

MarkVanDykePhotography // Shutterstock

34 / 50

#17. Fairfax County

- Tornadoes since 2000: 11 (2.81 per 100 square miles)
- #583 nationally
- Tornadoes this year, as of May 31: 0
#16. Isle of Wight County

Melinda Fawver // Shutterstock

35 / 50

#16. Isle of Wight County

- Tornadoes since 2000: 9 (2.85 per 100 square miles)
- #565 nationally
- Tornadoes this year, as of May 31: 0

You may also like: Counties with the oldest homes in Virginia

#15. Fauquier County

Canva

36 / 50

#15. Fauquier County

- Tornadoes since 2000: 19 (2.93 per 100 square miles)
- #532 nationally
- Tornadoes this year, as of May 31: 0
#14. Hanover County

Canva

37 / 50

#14. Hanover County

- Tornadoes since 2000: 14 (2.99 per 100 square miles)
- #499 nationally
- Tornadoes this year, as of May 31: 0
#13. Henrico County

Canva

38 / 50

#13. Henrico County

- Tornadoes since 2000: 7 (3.00 per 100 square miles)
- #495 nationally
- Tornadoes this year, as of May 31: 0
#12. Virginia Beach

Sherry V Smith // Shutterstock

39 / 50

#12. Virginia Beach

- Tornadoes since 2000: 8 (3.21 per 100 square miles)
- #411 nationally
- Tornadoes this year, as of May 31: 1
#10. Suffolk

O.C Ritz // Shutterstock

41 / 50

#10. Suffolk

- Tornadoes since 2000: 14 (3.50 per 100 square miles)
- #325 nationally
- Tornadoes this year, as of May 31: 0
#9. Prince William County

Canva

42 / 50

#9. Prince William County

- Tornadoes since 2000: 12 (3.57 per 100 square miles)
- #307 nationally
- Tornadoes this year, as of May 31: 0
#8. King George County

Canva

43 / 50

#8. King George County

- Tornadoes since 2000: 7 (3.90 per 100 square miles)
- #248 nationally
- Tornadoes this year, as of May 31: 0
#7. Stafford County

Felix Lipov // Shutterstock

44 / 50

#7. Stafford County

- Tornadoes since 2000: 11 (4.09 per 100 square miles)
- #218 nationally
- Tornadoes this year, as of May 31: 0
#6. James City County

Canva

45 / 50

#6. James City County

- Tornadoes since 2000: 7 (4.91 per 100 square miles)
- #114 nationally
- Tornadoes this year, as of May 31: 0

You may also like: Best counties to retire to in Virginia
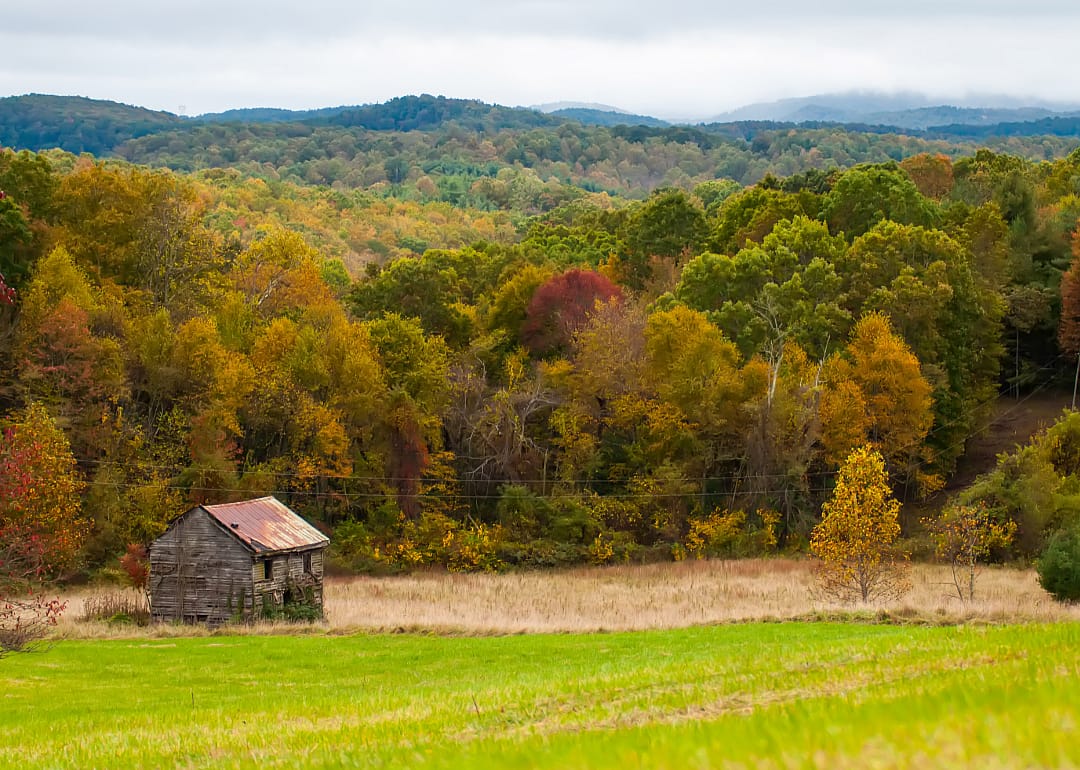
#5. Lancaster County

Canva

46 / 50

#5. Lancaster County

- Tornadoes since 2000: 7 (5.25 per 100 square miles)
- #91 nationally
- Tornadoes this year, as of May 31: 0
#4. Middlesex County

EchoFree // Shutterstock

47 / 50

#4. Middlesex County

- Tornadoes since 2000: 7 (5.37 per 100 square miles)
- #83 nationally
- Tornadoes this year, as of May 31: 0
#3. York County

Canva

48 / 50

#3. York County

- Tornadoes since 2000: 6 (5.73 per 100 square miles)
- #65 nationally
- Tornadoes this year, as of May 31: 0
#2. Mathews County

Canva

49 / 50

#2. Mathews County

- Tornadoes since 2000: 5 (5.82 per 100 square miles)
- #58 nationally
- Tornadoes this year, as of May 31: 0
#1. Richmond

Erin Cadigan // Shutterstock

50 / 50

#1. Richmond

- Tornadoes since 2000: 9 (15.05 per 100 square miles)
- #1 nationally
- Tornadoes this year, as of May 31: 0

You may also like: Hottest Novembers in Virginia since 1895