Data viz decoded: Stacker's best practices for insightful charts
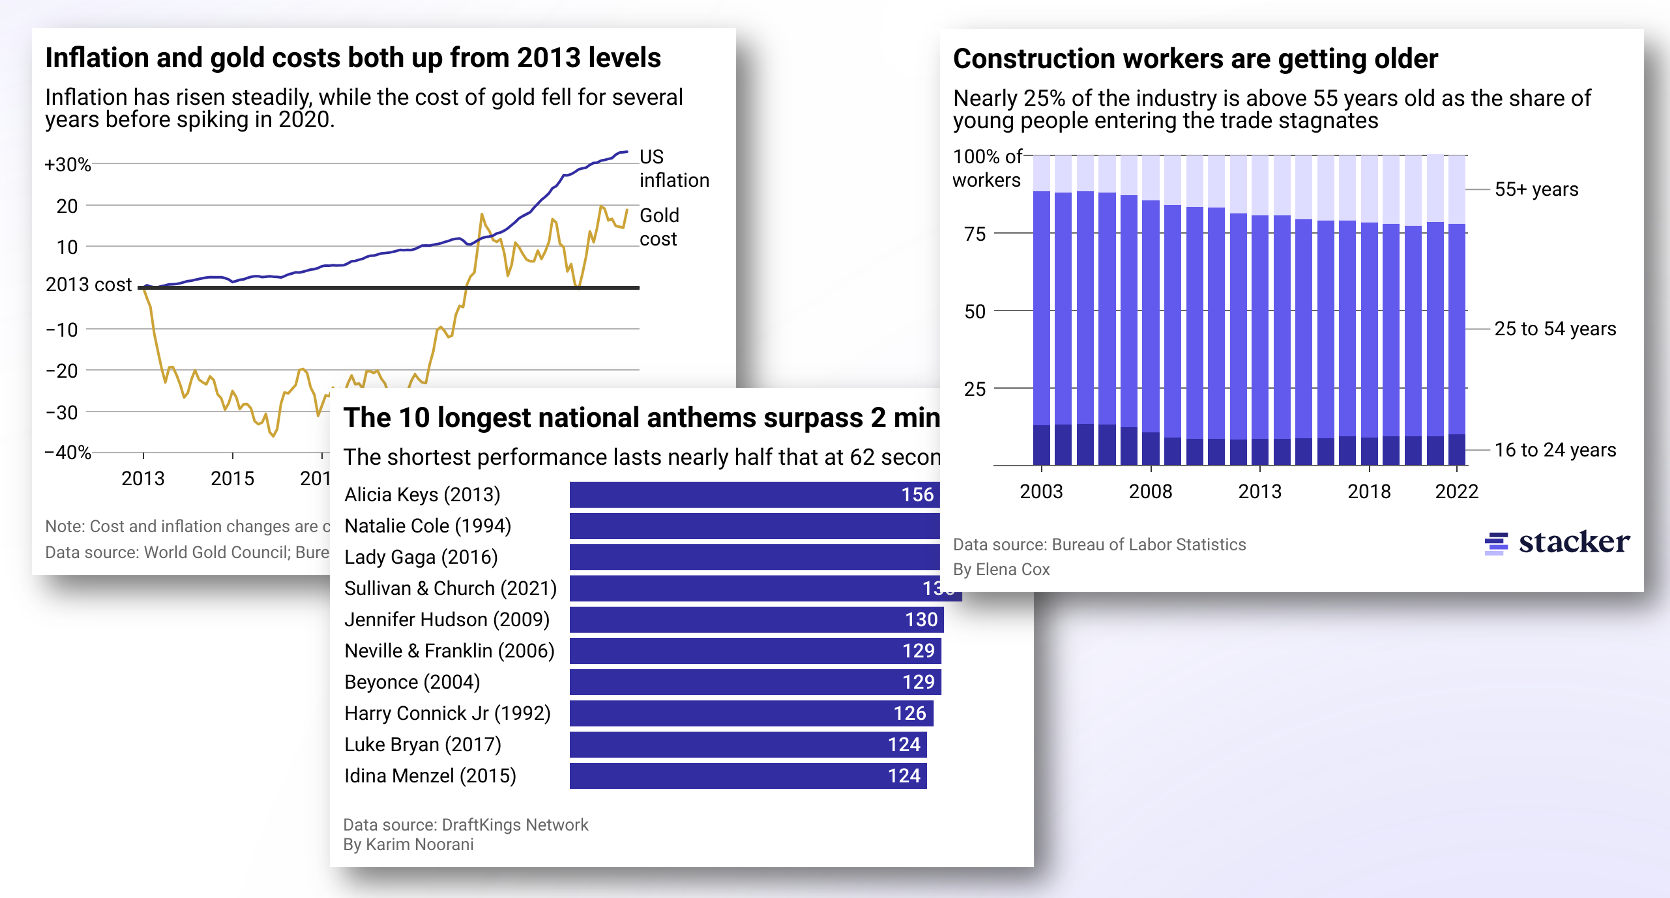
At Stacker, we produce over 20 stories featuring data visualization each month. These have ranged from maps on solar power capacity to line charts on girls’ ...
At Stacker, we produce over 20 stories featuring data visualization each month. These have ranged from maps on solar power capacity to line charts on girls’ ...