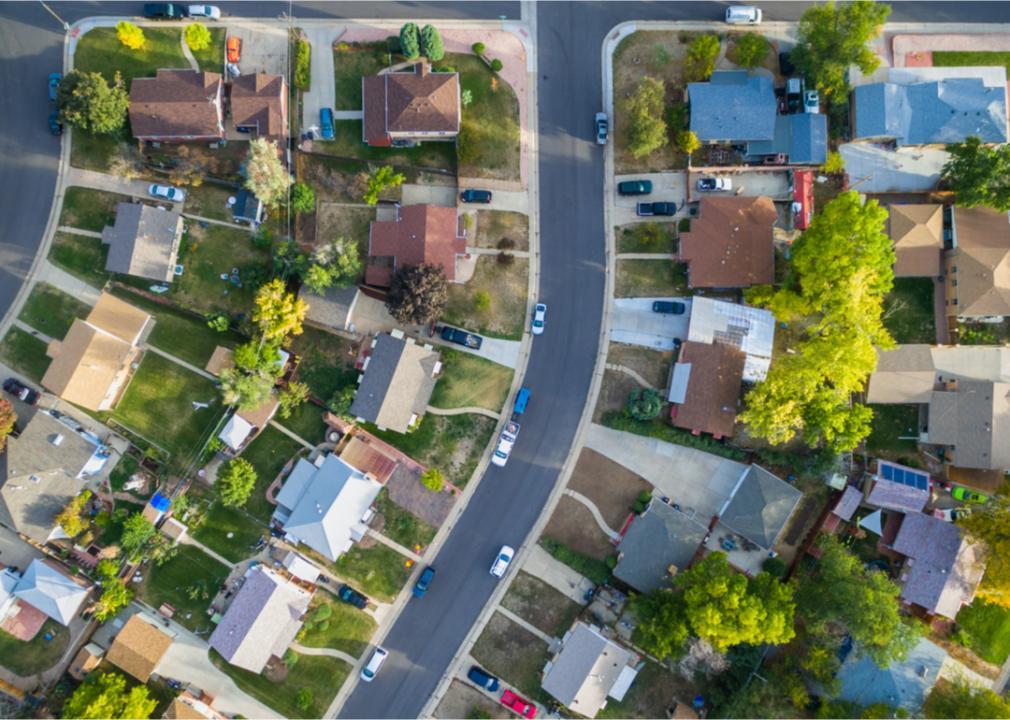
Counties in Maryland where people spend most of their paycheck on housing
Counties in Maryland where people spend most of their paycheck on housing
It's no secret that many Americans are forgoing homeownership in favor of renting. In 2020, renters in the U.S. occupied 43 million housing units.
The Stacker team looked at data from a United States Census survey that revealed an estimated 43,378,800 renter-occupied homes in the United States as of 2017, which makes up 36.1% of all households in the country. In 2019, renting was more affordable than buying a median-priced home in 59% of the counties; in 2021, the opposite was true: Owning was more affordable than renting in 63% of U.S. counties.
Stacker compiled a list of counties in Maryland where people spend the highest percent of income on rent using data from the U.S. Census Bureau. Of course, saving money by owning a home is unattainable for many Americans who don't have savings that could cover a down payment, those who are denied a mortgage, or both. Keep reading to see where in your home state most of people's take-home pay goes to their monthly rent.
You may also like: Highest-rated Class of 2021 football recruits from Maryland
#24. Garrett County
- Median percent of income spent on housing: 16.7%
--- Percent of households spending <20% of income on housing: 53.3%
--- Percent of households spending >30% of income on housing: 23.0%
- Total occupied households: 12,425
- Median household income: $52,617
- Median monthly housing cost: $733
#23. Allegany County
- Median percent of income spent on housing: 18.5%
--- Percent of households spending <20% of income on housing: 51.3%
--- Percent of households spending >30% of income on housing: 26.7%
- Total occupied households: 27,399
- Median household income: $45,893
- Median monthly housing cost: $707
#22. Howard County
- Median percent of income spent on housing: 19.3%
--- Percent of households spending <20% of income on housing: 47.0%
--- Percent of households spending >30% of income on housing: 26.6%
- Total occupied households: 114,170
- Median household income: $121,160
- Median monthly housing cost: $1,949
#21. Carroll County
- Median percent of income spent on housing: 19.4%
--- Percent of households spending <20% of income on housing: 48.2%
--- Percent of households spending >30% of income on housing: 24.8%
- Total occupied households: 60,758
- Median household income: $96,769
- Median monthly housing cost: $1,563
#20. Harford County
- Median percent of income spent on housing: 19.6%
--- Percent of households spending <20% of income on housing: 48.9%
--- Percent of households spending >30% of income on housing: 26.0%
- Total occupied households: 93,955
- Median household income: $89,147
- Median monthly housing cost: $1,458
You may also like: Counties with the most college graduates in Maryland
#19. Talbot County
- Median percent of income spent on housing: 19.6%
--- Percent of households spending <20% of income on housing: 45.3%
--- Percent of households spending >30% of income on housing: 30.1%
- Total occupied households: 16,826
- Median household income: $73,547
- Median monthly housing cost: $1,204
#18. Calvert County
- Median percent of income spent on housing: 19.7%
--- Percent of households spending <20% of income on housing: 48.2%
--- Percent of households spending >30% of income on housing: 24.8%
- Total occupied households: 31,973
- Median household income: $109,313
- Median monthly housing cost: $1,798
#17. Cecil County
- Median percent of income spent on housing: 19.9%
--- Percent of households spending <20% of income on housing: 45.0%
--- Percent of households spending >30% of income on housing: 28.6%
- Total occupied households: 37,058
- Median household income: $76,887
- Median monthly housing cost: $1,276
#16. Washington County
- Median percent of income spent on housing: 20.1%
--- Percent of households spending <20% of income on housing: 47.7%
--- Percent of households spending >30% of income on housing: 27.8%
- Total occupied households: 56,035
- Median household income: $60,860
- Median monthly housing cost: $1,021
#15. Frederick County
- Median percent of income spent on housing: 20.1%
--- Percent of households spending <20% of income on housing: 46.5%
--- Percent of households spending >30% of income on housing: 27.1%
- Total occupied households: 92,526
- Median household income: $97,730
- Median monthly housing cost: $1,640
You may also like: Fastest-growing counties in Maryland
#14. Worcester County
- Median percent of income spent on housing: 20.7%
--- Percent of households spending <20% of income on housing: 43.6%
--- Percent of households spending >30% of income on housing: 33.9%
- Total occupied households: 22,089
- Median household income: $63,499
- Median monthly housing cost: $1,093
#13. St. Mary's County
- Median percent of income spent on housing: 20.7%
--- Percent of households spending <20% of income on housing: 47.4%
--- Percent of households spending >30% of income on housing: 27.8%
- Total occupied households: 40,552
- Median household income: $89,845
- Median monthly housing cost: $1,553
#12. Queen Anne's County
- Median percent of income spent on housing: 20.9%
--- Percent of households spending <20% of income on housing: 43.8%
--- Percent of households spending >30% of income on housing: 28.9%
- Total occupied households: 18,577
- Median household income: $97,034
- Median monthly housing cost: $1,689
#11. Montgomery County
- Median percent of income spent on housing: 21.0%
--- Percent of households spending <20% of income on housing: 43.3%
--- Percent of households spending >30% of income on housing: 32.1%
- Total occupied households: 370,950
- Median household income: $108,820
- Median monthly housing cost: $1,905
#10. Anne Arundel County
- Median percent of income spent on housing: 21.0%
--- Percent of households spending <20% of income on housing: 44.8%
--- Percent of households spending >30% of income on housing: 28.1%
- Total occupied households: 209,814
- Median household income: $100,798
- Median monthly housing cost: $1,765
You may also like: Highest-earning counties in Maryland
#9. Baltimore County
- Median percent of income spent on housing: 21.3%
--- Percent of households spending <20% of income on housing: 44.7%
--- Percent of households spending >30% of income on housing: 30.4%
- Total occupied households: 313,519
- Median household income: $76,866
- Median monthly housing cost: $1,367
#8. Dorchester County
- Median percent of income spent on housing: 21.4%
--- Percent of households spending <20% of income on housing: 40.4%
--- Percent of households spending >30% of income on housing: 34.0%
- Total occupied households: 13,183
- Median household income: $52,917
- Median monthly housing cost: $942
#7. Charles County
- Median percent of income spent on housing: 22.2%
--- Percent of households spending <20% of income on housing: 41.6%
--- Percent of households spending >30% of income on housing: 30.7%
- Total occupied households: 56,520
- Median household income: $100,003
- Median monthly housing cost: $1,849
#6. Wicomico County
- Median percent of income spent on housing: 22.5%
--- Percent of households spending <20% of income on housing: 42.2%
--- Percent of households spending >30% of income on housing: 32.8%
- Total occupied households: 37,793
- Median household income: $56,956
- Median monthly housing cost: $1,067
#5. Caroline County
- Median percent of income spent on housing: 22.6%
--- Percent of households spending <20% of income on housing: 40.7%
--- Percent of households spending >30% of income on housing: 33.5%
- Total occupied households: 12,024
- Median household income: $58,638
- Median monthly housing cost: $1,103
You may also like: Counties with the worst commutes in Maryland
#4. Kent County
- Median percent of income spent on housing: 22.9%
--- Percent of households spending <20% of income on housing: 41.2%
--- Percent of households spending >30% of income on housing: 36.1%
- Total occupied households: 8,025
- Median household income: $58,598
- Median monthly housing cost: $1,117
#3. Prince George's County
- Median percent of income spent on housing: 23.6%
--- Percent of households spending <20% of income on housing: 36.6%
--- Percent of households spending >30% of income on housing: 36.6%
- Total occupied households: 311,343
- Median household income: $84,920
- Median monthly housing cost: $1,669
#2. Somerset County
- Median percent of income spent on housing: 25.1%
--- Percent of households spending <20% of income on housing: 40.6%
--- Percent of households spending >30% of income on housing: 40.7%
- Total occupied households: 8,574
- Median household income: $37,803
- Median monthly housing cost: $792
#1. Baltimore city
- Median percent of income spent on housing: 26.5%
--- Percent of households spending <20% of income on housing: 36.2%
--- Percent of households spending >30% of income on housing: 38.1%
- Total occupied households: 239,116
- Median household income: $50,379
- Median monthly housing cost: $1,113


