Counties with the most bridges in dire need of repair in Arizona
One in three U.S. bridges is in need of repair or replacement, according to data from the American Road & Transportation Builders Association, including 29% of interstate bridges. The cost to make these repairs is estimated to be in excess of $54 billion.
Stacker investigated which counties in Arizona have the most bridges in dire need of repair using data from the Federal Highway Administration. The data is accurate as of June 15, 2022. Counties are ranked by percent of bridges in "poor" condition and ties are broken by percent square meters of bridges in poor condition. Counties that have no bridges or have no bridges in poor condition are excluded from the list.
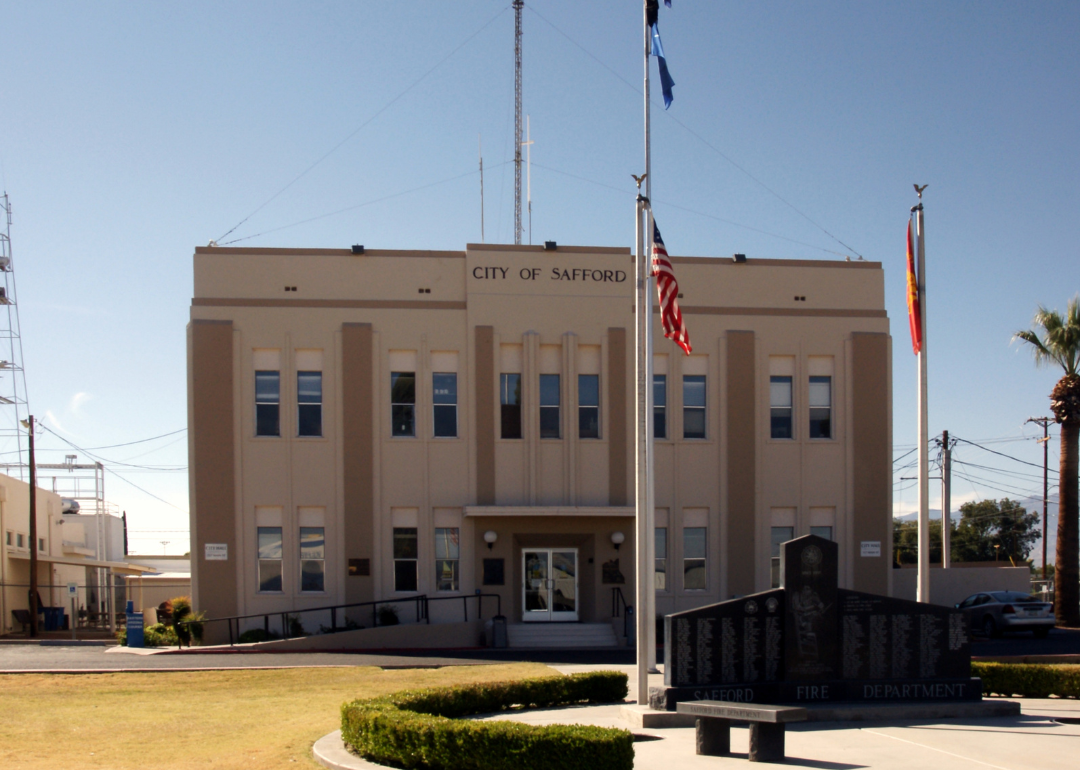
- Bridges in poor condition: 0.1% (4 of 2,791 bridges)
- Square meters of bridges in poor condition: 0.1% (2,821 of 3,402,652 square meters of bridges)
2 / 15
Canva
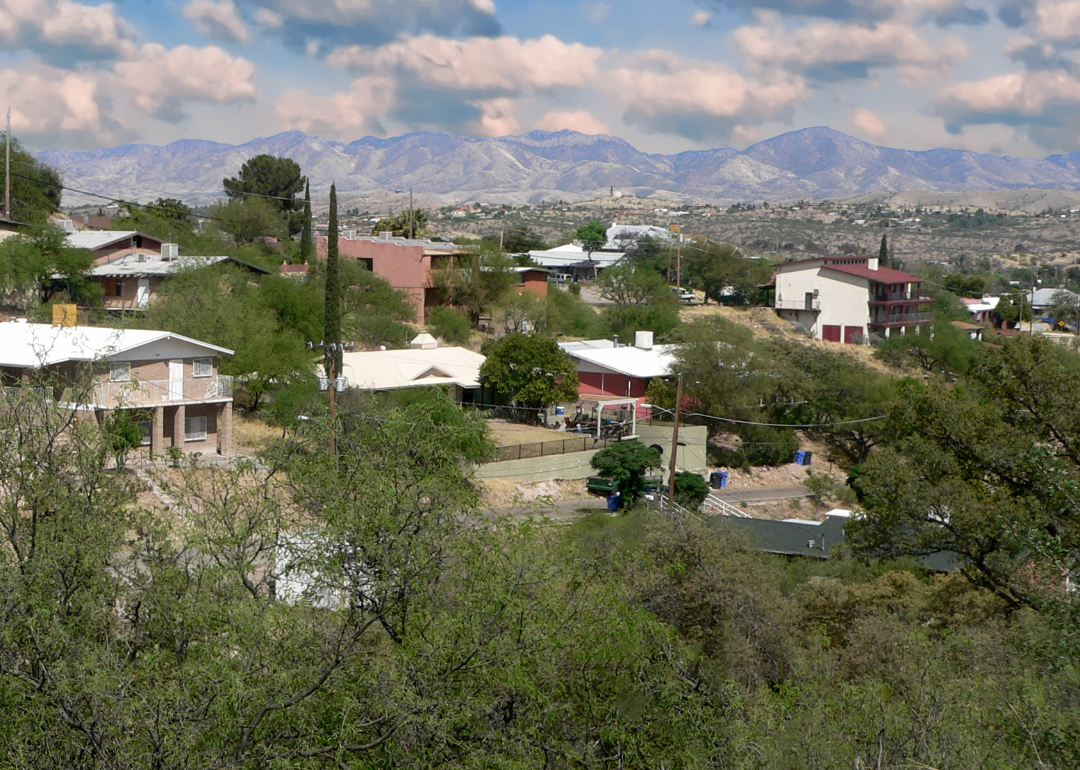
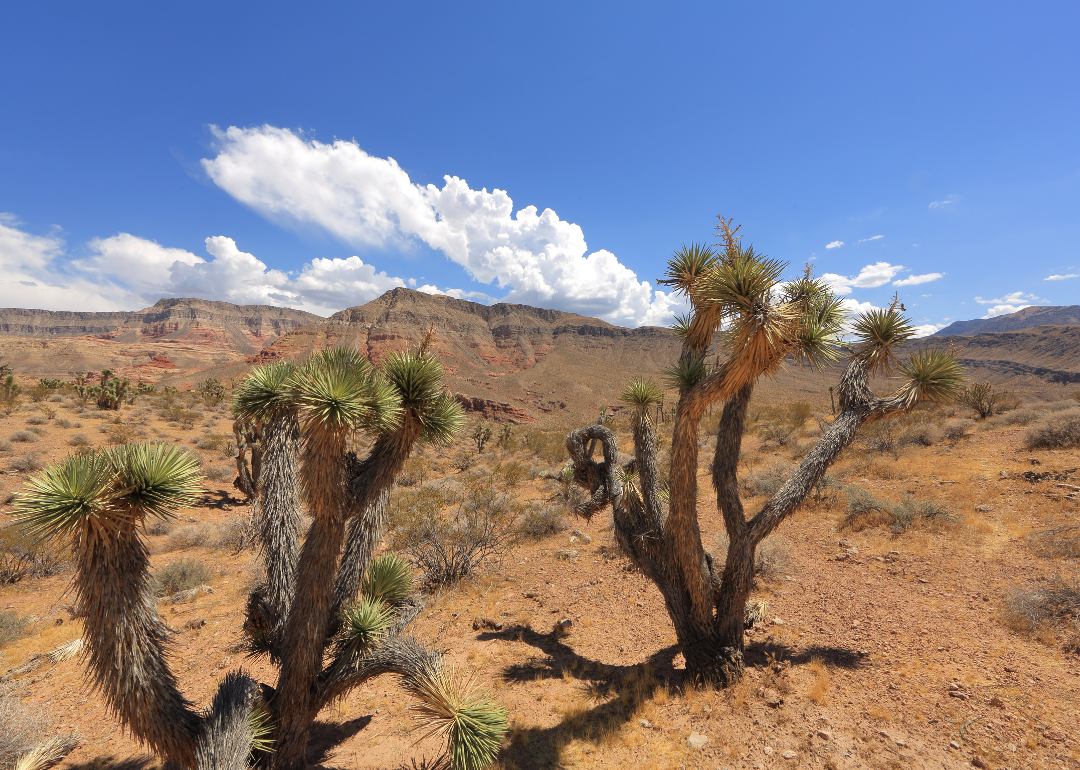
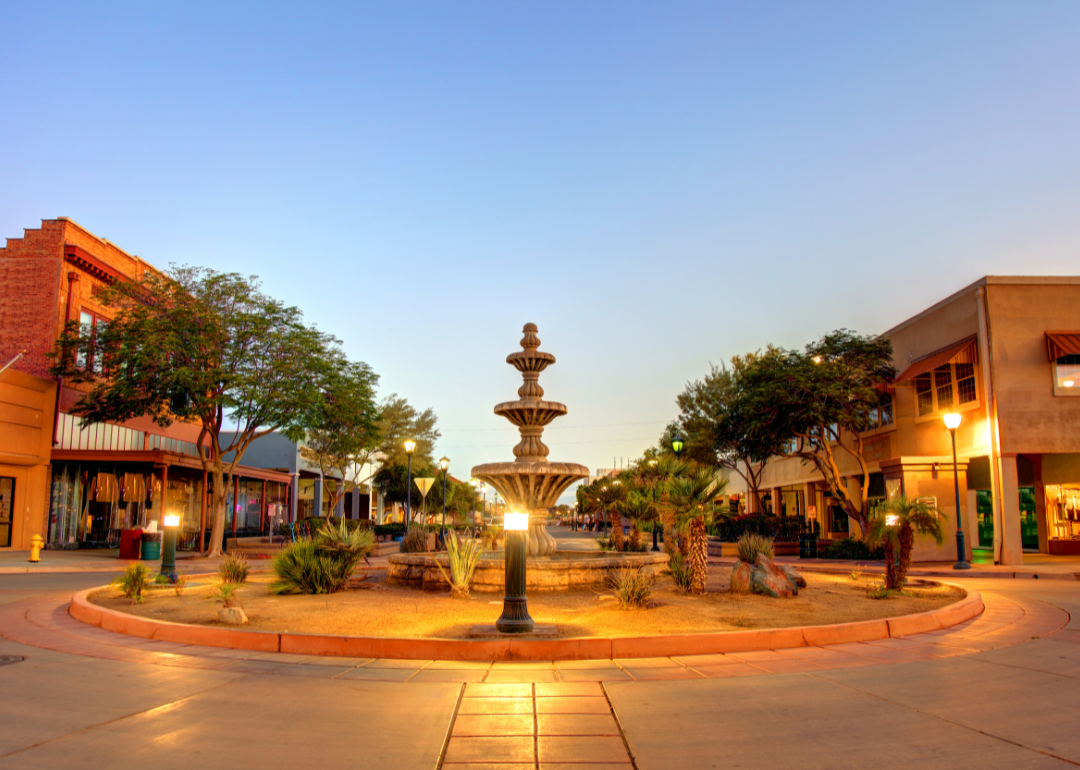
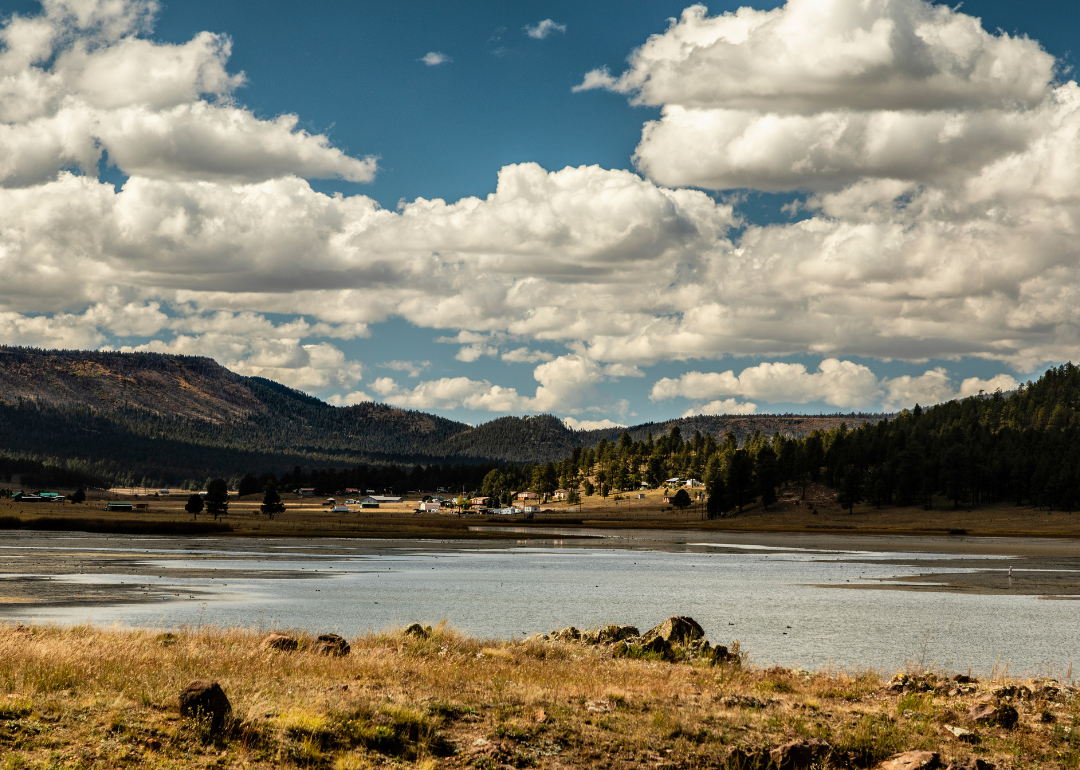
#14. Santa Cruz County
- Bridges in poor condition: 0.7% (1 of 135 bridges)
- Square meters of bridges in poor condition: 0.1% (105 of 71,431 square meters of bridges)
3 / 15
Jay Yuan // Shutterstock
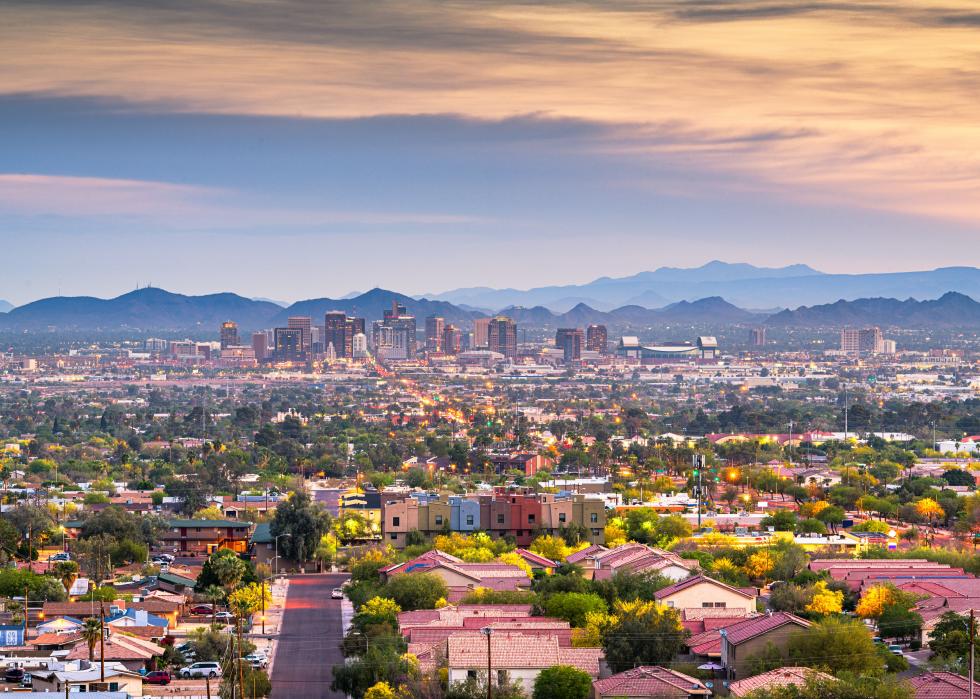
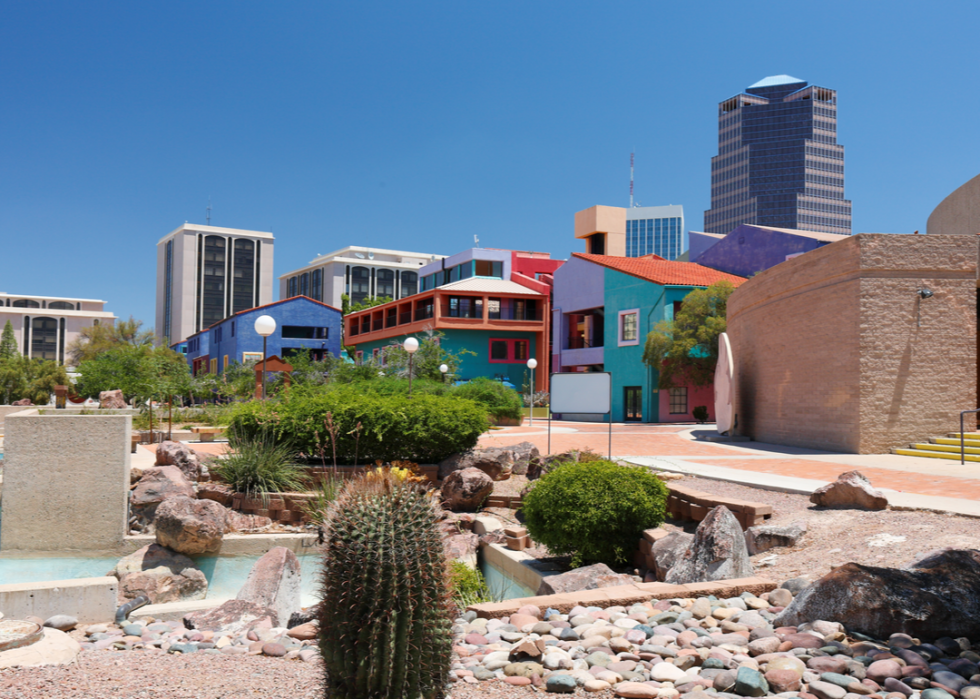
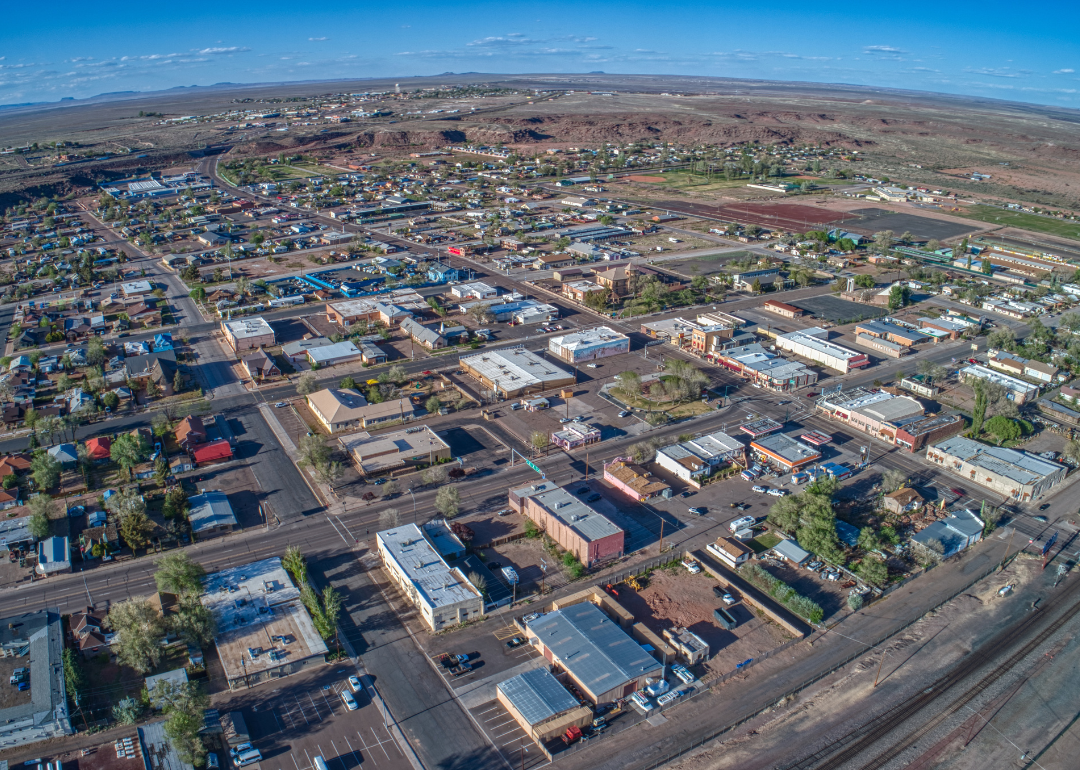
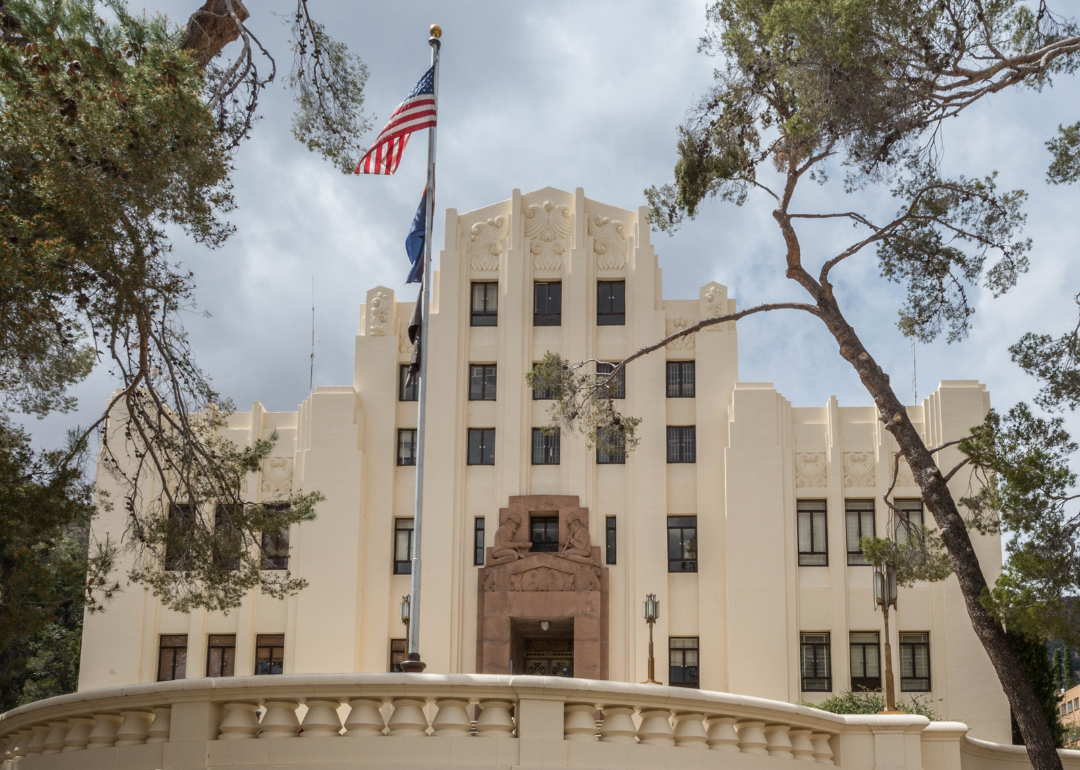
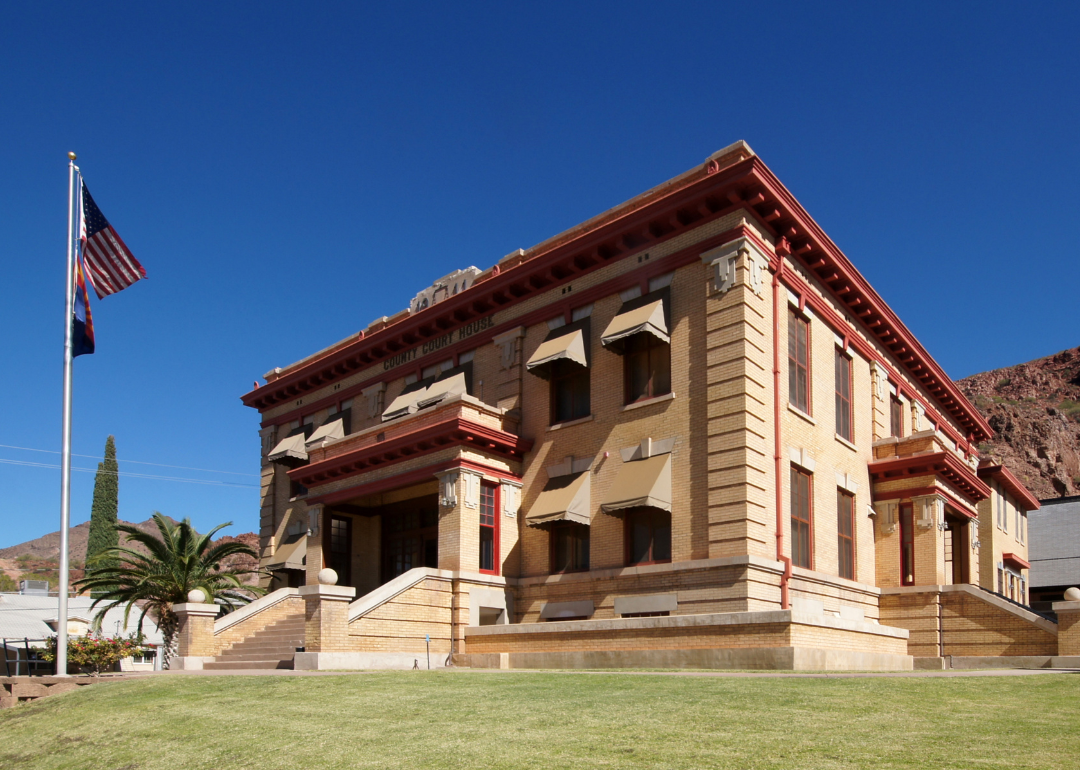
#13. Pima County
- Bridges in poor condition: 0.9% (10 of 1,163 bridges)
- Square meters of bridges in poor condition: 1.7% (11,926 of 718,403 square meters of bridges)
4 / 15
Canva
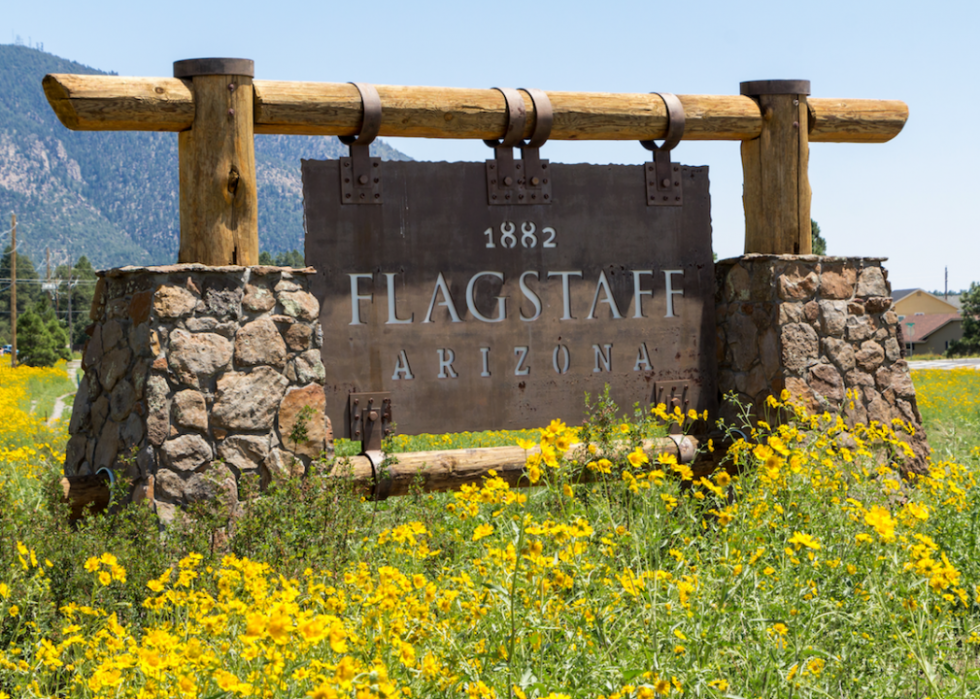
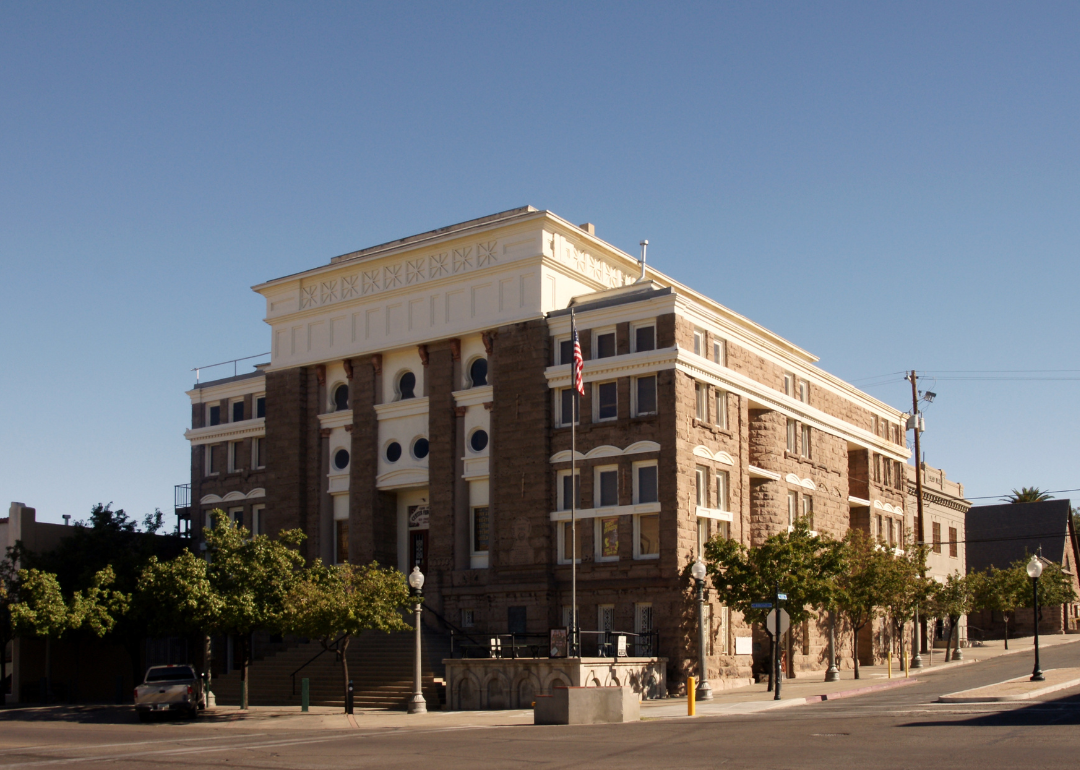
#12. Yavapai County
- Bridges in poor condition: 0.9% (5 of 543 bridges)
- Square meters of bridges in poor condition: 1.0% (2,391 of 230,468 square meters of bridges)
5 / 15
Canva
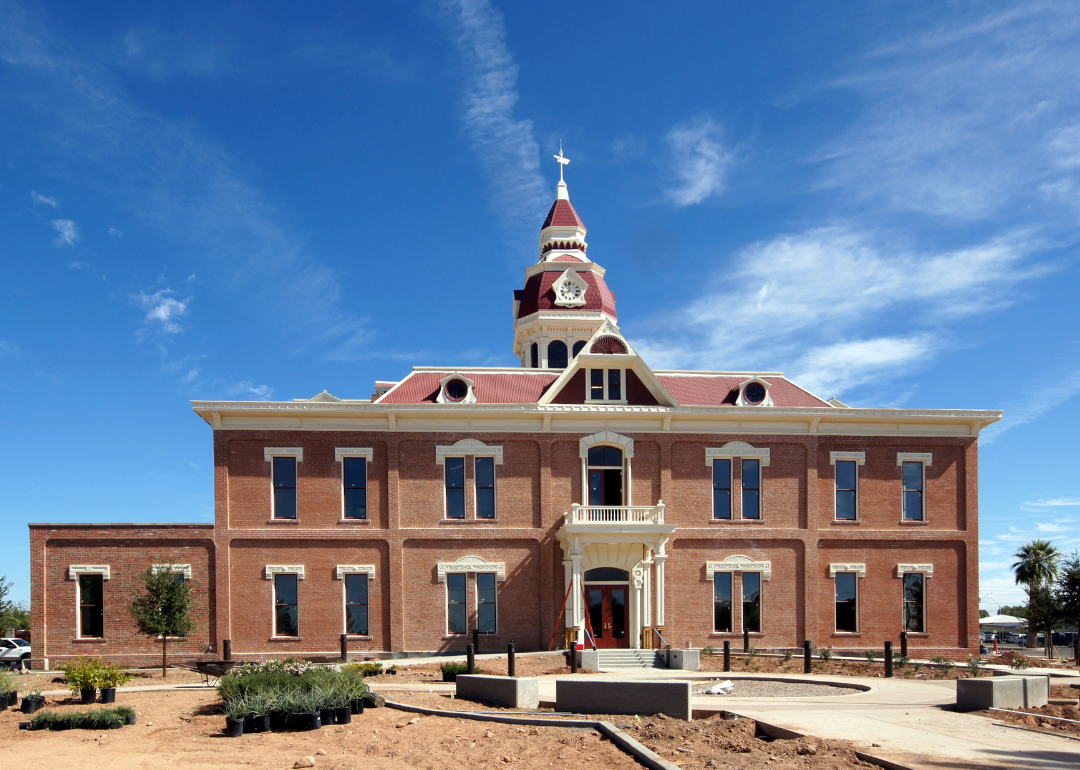
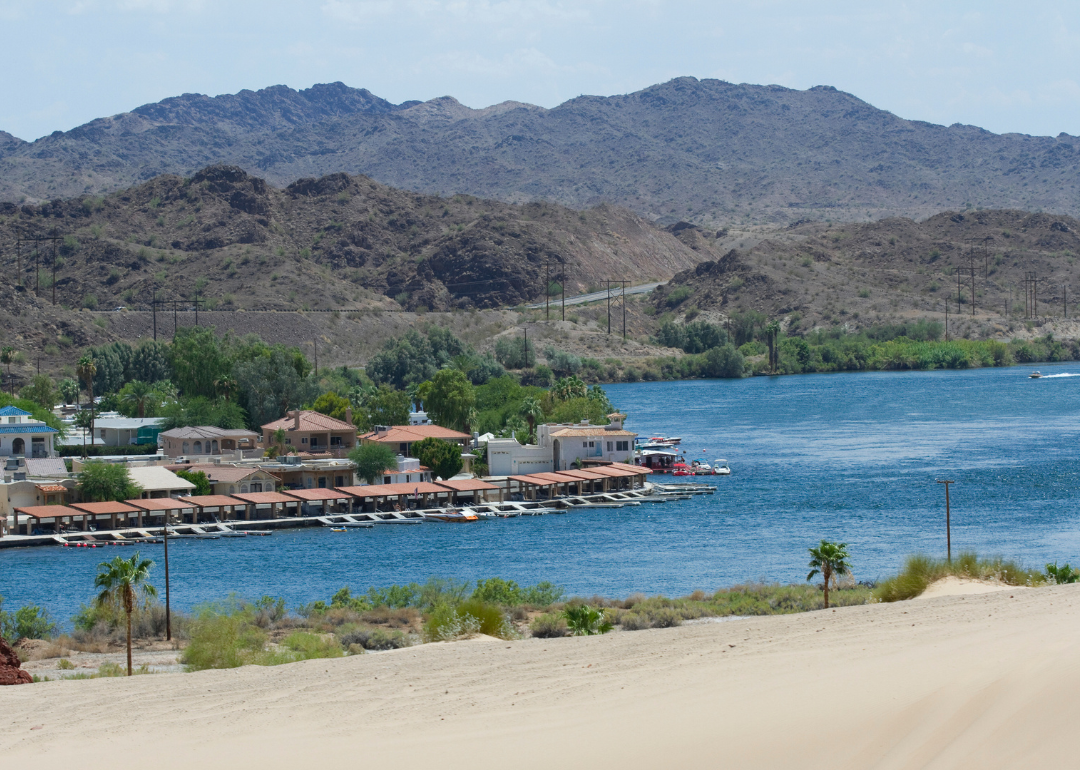
#11. Pinal County
- Bridges in poor condition: 1.0% (7 of 708 bridges)
- Square meters of bridges in poor condition: 2.2% (6,351 of 284,360 square meters of bridges)