
Breaking down the NBA's playoff blowout problem
On May 15, the 2022 NBA Playoffs had its first two winner-take-all Game 7s of the postseason. But while the stakes for a Game 7 are always high, the competition on the court that day was less so. In the first game of the day, the Boston Celtics walloped the Milwaukee Bucks 109-81. A few hours later, the Dallas Mavericks drubbed the Phoenix Suns 123-90.
The fact that two of the most crucial playoff games ended with lopsided scores shined a spotlight on an emerging issue: The NBA was facing a blowout crisis, something that could encourage viewers to tune out of games early. By May 23, the playoffs reached 22 games won by 20 points or more, two shy of the league record, per a Stacker analysis. Also around that time, there had been only seven "clutch time" minutes during a set span of 17 games.
Stacker dug into the details to better understand the blowout phenomena the NBA experienced this postseason. Using data from Stathead, we compared this year's playoffs to previous postseasons and came up with a few possible explanations for what transpired.
The Finals were a microcosm of the problems plaguing the playoffs. The series between Boston and Golden State averaged a scoring margin of 13.3 points—over 3 points higher than the all-time Finals average scoring margin of 10.2—and all six Finals games were won by double digits, marking the first time in history that every Finals game finished with a 10-points-or-more scoring margin. The Warriors put on an especially dominating performance in their 103-90 Game 6 championship clincher, which included a 21-0 run that was the largest scoring run in the past 50 Finals.
Is 2022 an outlier when it comes to playoff blowouts? Was it all a mirage? These questions are tackled ahead.
6 of the past 7 postseasons have seen high-scoring margins
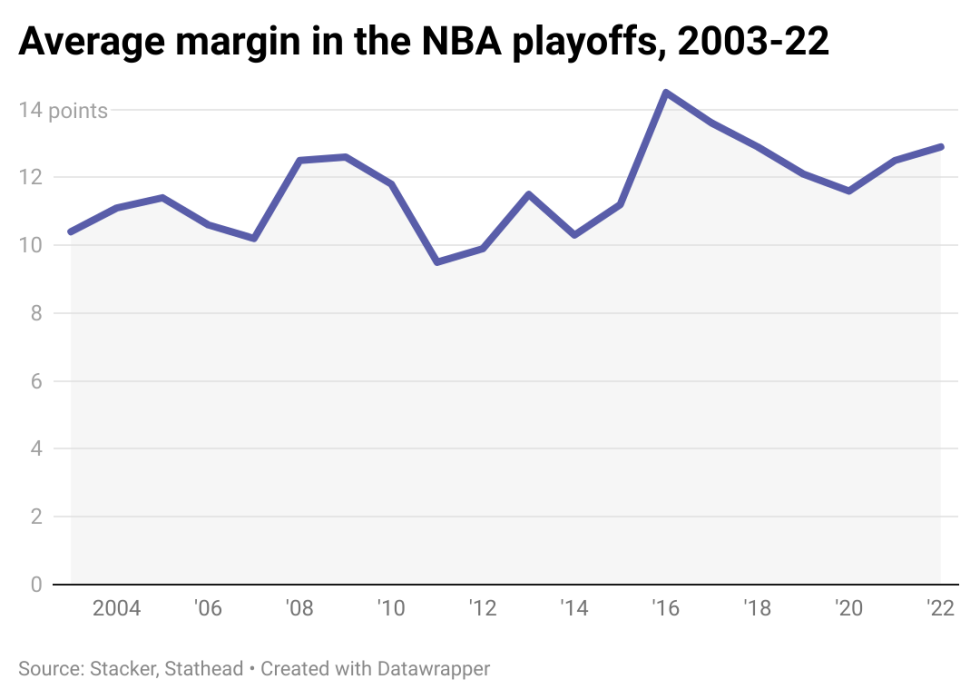
The 2021 playoffs had a high average scoring margin, but they weren’t a historic outlier. This postseason’s tally was 12.9 points per game, tied for third highest since 2003 with 2018 and behind 2016’s 14.5 average scoring margin and 2017’s 13.6.
However, this year’s average scoring margin is part of a recent trend. In the seven years since 2016, the average sits at 12.9, a 17.3% increase over the previous seven years of 2009-15. Plus, six of those seven most recent postseasons have had an average scoring margin above 12.
In the 13 years prior dating back to 2003, just two broke the 12-point-margin-per-game watermark.
The rate of blowouts reached historic highs in recent postseasons
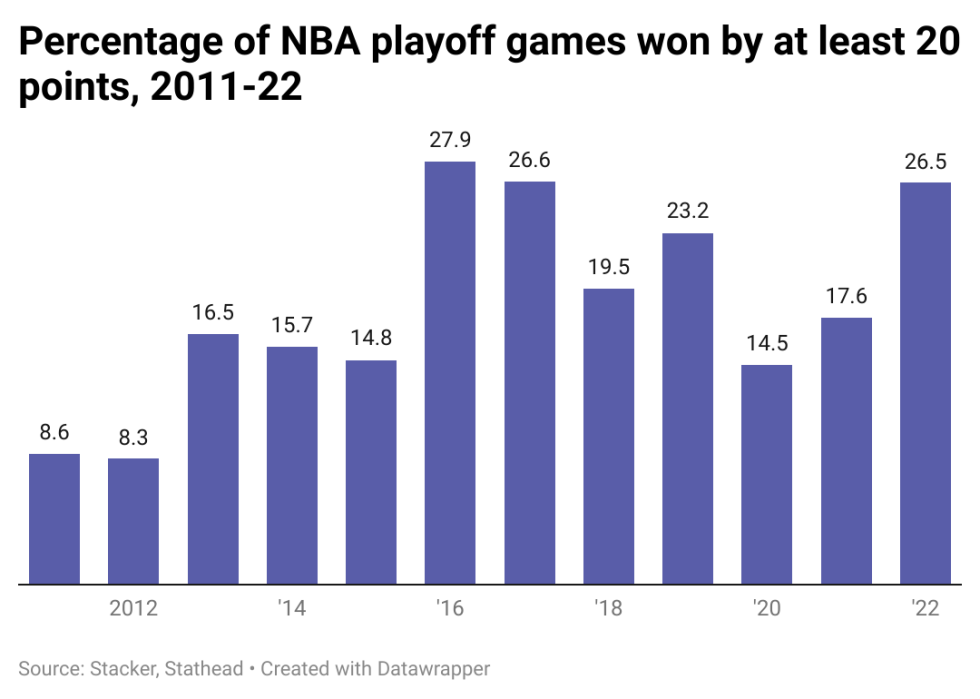
With a high average scoring margin, it makes sense that the rate of blowouts is up too. That’s exactly what the data reveals.
When defining a “blowout” as a game won by 20 or more points, 2022 had a blowout rate of 25.3%. This means that roughly one out of every four playoff games this year ended with a lopsided score. It was the third time since the initial high-scoring margin year of 2016 that the playoffs concluded with a 25% or more rate of 20-plus point blowouts.
What’s perhaps most interesting about the 2022 postseason is that the blowouts came clustered together. In a nine-day span running May 10-19, eight of the 13 games played finished with a margin of 20 or more. And all but two finished with a double-digit scoring margin.
Things settled down a bit after that burst, but, as already mentioned, even the Finals suffered from a lack of close games—only one of six games between the Warriors and Celtics finished with both teams’ core lineup on the court.
When adjusting scoring margins for increased scoring totals, recent years don’t look as bad
The rise in the 3-point shot has been bandied about as a probable cause for the increased rate of blowouts and higher average scoring margin. It’s a reasonable take; 3-pointers are high-risk, high-reward shots, and if one team struggles from 3-point range while their opponent is connecting from deep, the potential for a game to get out of hand rises.
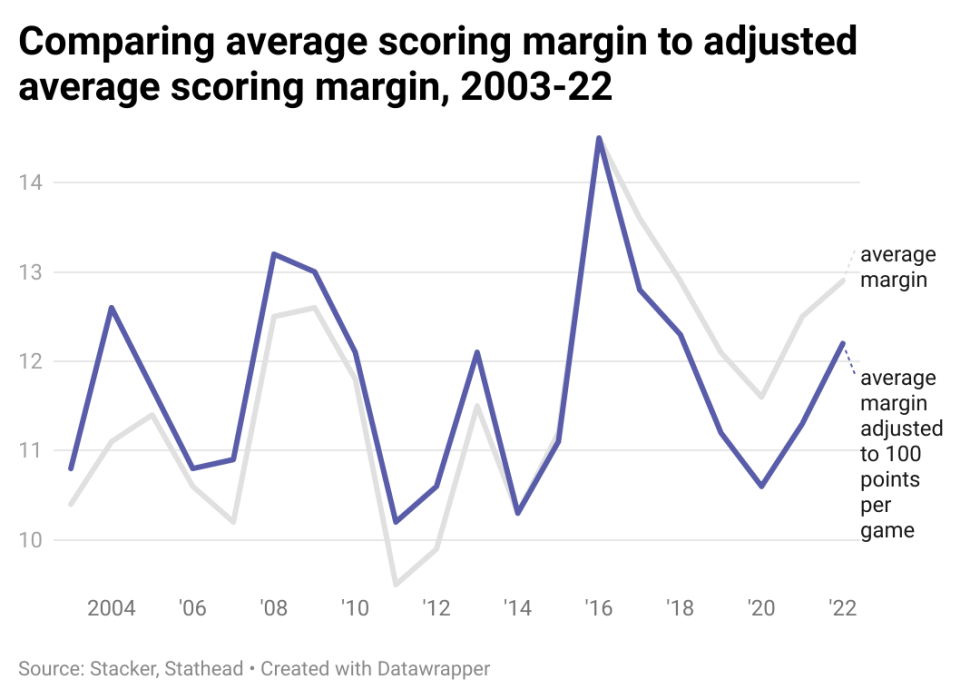
As the NBA has increased its reliance on 3-pointers, there’s also been an increase in total points per game. To factor this trend in, the average scoring margin was divided by each postseason’s points per game and normalized the result to a consistent 100 points per game total. After making this adjustment, the recent trend in higher average scoring margin vanishes.
2016 remains an outlier, but the years that follow wind up more in line with earlier seasons. 2022’s adjusted average scoring margin is actually quite middling—its 12.2 adjusted average ranks only seventh highest in the past 20 years.
This suggests the recent bump in the average scoring margin may simply be caused by higher-scoring games. It does make sense on the surface, as point totals increase, the scoring margin should also increase.
However, just looking at the adjusted scoring margin doesn’t tell the full story.
Scoring margins are up in the playoffs compared to the regular season
If a higher point total was the sole culprit behind the higher average scoring margin, we’d expect a similar tale when looking at regular season data. But that’s not the case.
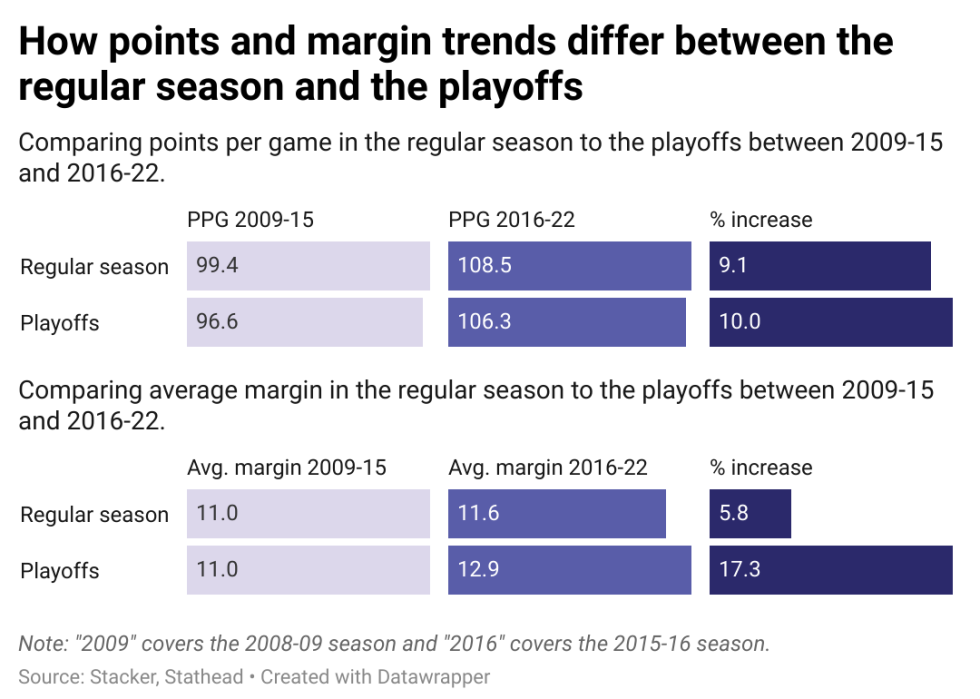
To test this theory, the average points per game in the regular season and the playoffs over the past seven years—back to 2016, when fans first saw an increase in playoff blowouts—were compared to that of the seven years prior, 2009-15.
Both the playoffs and the regular season increased their average scoring margin at a similar clip between those two time periods. The regular season’s points per game grew by 9.1% over the sampled seasons, and the playoffs’ points per game grew by 10%.
The same isn’t true for the average scoring margin. During the 2009-15 time frame, both the playoffs and the regular season averaged a scoring margin of 11. In the seven years that followed, however, the regular season’s average scoring margin increased 5.8% to 11.6 and the playoffs increased 17.3% to 12.9, growth spurts incongruous with the more consistent change in points per game totals.
So what happened? The home-court advantage might be playing a bigger role during the playoffs. Since the 2002-03 season, home teams have an average point differential of +4.3 in the playoffs, up 54% from +2.8 in the regular season. This difference in home-court advantage could be magnified when coupled with larger points per game totals.
The 2020 playoffs held in a COVID-19 bubble can be treated as a makeshift control group. That year every playoff game was played on a neutral court at Disney World, and, notably, it’s the only year of the past seven that didn’t reach the 12-point scoring margin watermark discussed earlier.
In fact, the 11.6 average scoring margin during the 2020 playoffs lines up nicely with the 11.6 average margin found during the regular season over the past seven seasons. Because neutral site games had lower scoring margins, there’s potential evidence that playoff home-court advantage is more crucial in a higher-scoring, 3-point-shot friendly NBA.
Ultimately, a slew of factors could impact the rise in playoff blowouts. The Warriors’ road beatdown of the Celtics to clinch the title in Boston anecdotally suggests that home-court advantage isn’t everything.
Beyond home-court advantage, other culprits may be more difficult to diagnose with data—such as general player wear-and-tear throughout a long season or the effects of playoff travel—and would require a deeper analysis.
Series went longer on average this postseason
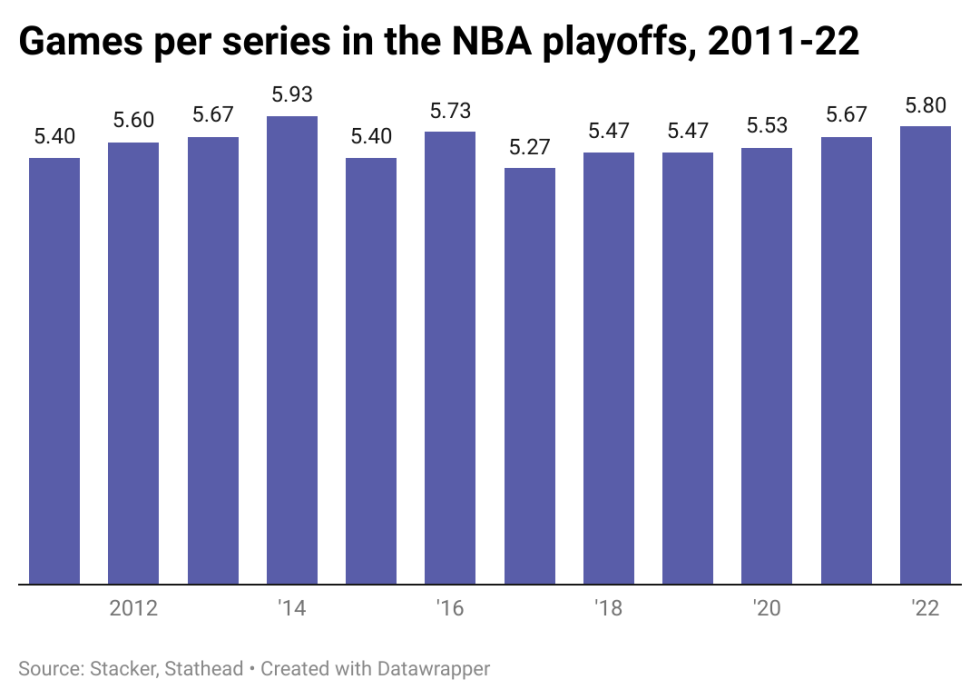
Despite the higher rate of blowouts, there is one silver lining to the 2022 NBA Playoffs: This postseason was more competitive than other blowout-heavy years, at least when looking at the data on a series level.
The average length for a series this year was 5.8 games. This average is one of the highest in recent years—only 2014's 5.93 average beats it in the past 12 postseasons. To top it off, there was also only one sweep this year—Boston over Brooklyn in the first round—a low last equaled in 2014.
The competition was still fierce this year team-by-team; it was just individual games that were more one-sided than in years past. Of course, that may provide little consolation to the average NBA viewer. Competitive games are more engaging to watch, no matter how long a particular series goes.
Fans will just have to wait and see if next year bucks the blowout trend.


