 What Themes Will Engage Audiences in Q3? Key Insights from Stacker"
class="blog-post-hero-img">
What Themes Will Engage Audiences in Q3? Key Insights from Stacker"
class="blog-post-hero-img">

Every month, over 1,600 publishing news sites across 50 states and Canada pick up stories from the Stacker newswire. Despite the diverse content needs of our publishing partner network, certain themes consistently emerge as top performers.
We currently gauge story performance by looking at the number of pickups per story and its readership. The Partner Success team also regularly communicates with partners to understand which specific topics resonate with their audiences. Our H1 analysis* combined this qualitative feedback with quantitative data, allowing us to identify the top-performing and most requested themes.
- Lifestyle and entertainment—budget-friendly travel and weddings, wellness for families and the 65+ demographic, reality TV, celebrity, and music (including nostalgia!)
- Real estate and economics—housing and employment trends, consumer spending and debt, the overall impact of the economy on communities and daily life
- Parenting and education—parenting tips, family activities, education rankings
- Weather and environment—seasonal predictions, extreme weather prep and aftermath, climate change
Alongside these top topics, here are five takeaways we recommend keeping in mind as you plan your content this quarter.
1. Consider how safety and security in all forms is top of mind

Many of our top stories (400+ pickups) intersected multiple topics of interest, with a significant portion addressing various forms of safety and security. For instance, stories about rising work fatalities, identity theft in different states, and families facing food insecurity were among our top performers.
One particularly successful article, “The role of dashcams in vehicle accidents and their effect on your car insurance,” was hyperspecific, but it resonated by effectively touching on multiple themes.
Though we didn’t get frequent requests for technology content, stories that converged with privacy and societal concerns saw significant success.Examples:
-
“Facial recognition, biometrics largely accepted in tech, but some remain wary of certain uses”
-
“What the Biden administration's new executive order on AI will mean for cybersecurity"
With that said, some stories are best kept straightforward with a singular focus.
2. Simplify with superlative rankings

Over three-quarters of stories with over 100,000 impressions had superlatives in the headline. This strategy works well for data-driven pieces across verticals and story types:
- A local snapshot (state, metro, or county) within a larger picture
- Buzzy, reader-friendly angles
- Part of a weekly or monthly series
- Movie and TV shows casting across the US (weekly)
- This series also has a local version
- Movie and TV shows casting across the US (weekly)
3. Follow seasonal trends and news pegs
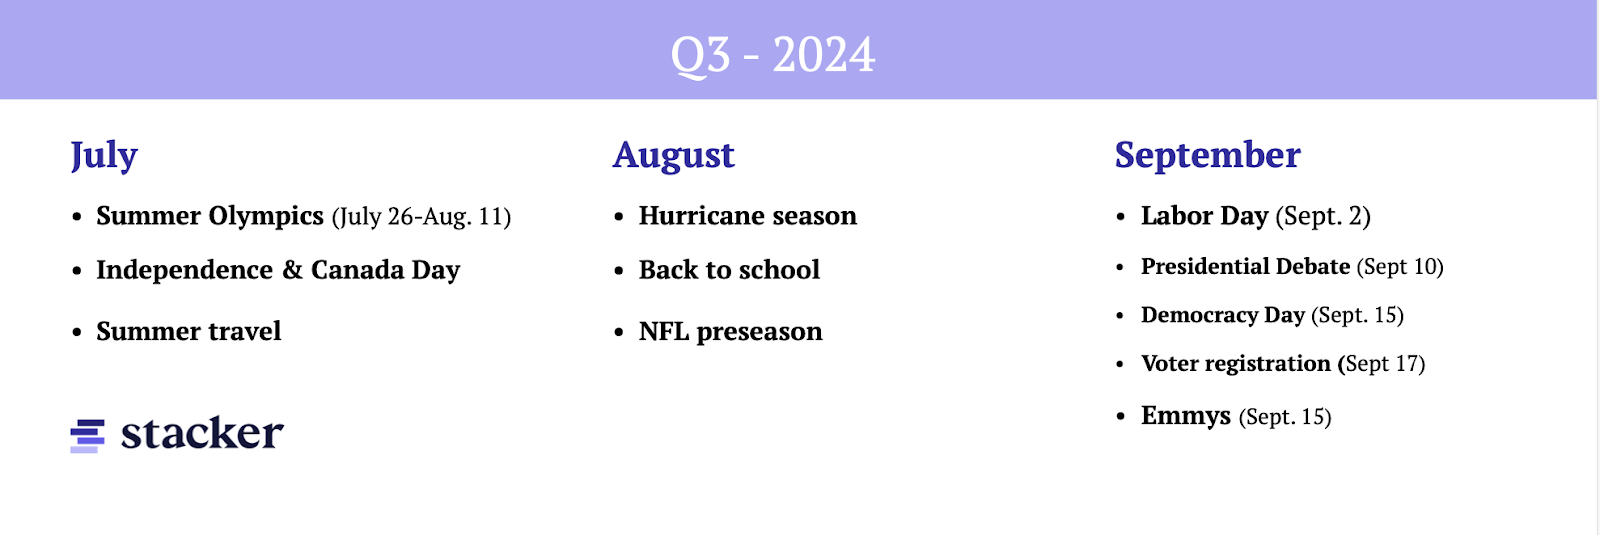
Engagement often spikes around predictable events like the Olympics, particularly when they intersect with topics you know your audience is interested in. For example, a significant portion of the network sees engagement with entertainment angles, i.e., “10 of the best movies about the Olympics.”
In Q3 of last year, about a quarter of our top pickup stories related to education—mainly in the summer months! Back to school is on the mind this early in the summer, so consider starting content planning now if you haven't yet.
Lastly, you know your audience and expertise best when it comes to how you approach election coverage. Peep the above events cheat sheet as a reminder of upcoming dates to get a jump on.
4. Monitor unexpected trends and odd pairings
The most pleasant surprises often come from events that fall outside your tentpole calendar. The story on the rare cicada season was far from niche—it amassed over 500,000 readers. Keep a close eye on nature of all kinds and “unique, offbeat one-offs,” as one publishing partner referred to our story “Most commonly seen birds in [state].” Last year at this time this was a partner favorite and had the numbers to show for it.
We also see unexpected pairings and trends draw high readership. “Jobs with the highest divorce rates” had over 500,000 readers despite having lower-than-average pickups from the network. A similar odd pairing of employment and marital status drew solid pickups and readership—“Most people in these jobs have never been married.”
5. Use data visualizations to distill your story
Data visualizations can be powerful storytelling tools for effectively delivering core findings in today's fast-paced, short-attention-span world.
The symbol map in “Cities with the fewest community pools per capita” encapsulates more than a long list of words could.

The economy's impact on daily living is always a safe bet. And the data viz in
“Fast food inflation: Which chains are hiking their prices the most?” certainly helped push this story to over 100,000 readers from Stacker’s network alone.

You can check out Stacker’s tips for data visualizations here. If you’d like to learn more about best practices for engaging readers with data viz, save the date for our upcoming webinar on Thursday, July 25 at 1:30 p.m. ET. We’ll go through common pitfalls and how to avoid them. All skill levels are welcome!
*Methodology: We used qualitative data (notes from calls on requested categories/subcategories) and quantitative data (400+ pickup stories in H1, 100K+ impression stories, and their associated tags) to get a summary of overarching themes—thanks to ChatGPT for running the analysis. Speaking of AI, you can check out Stacker’s AI policy here.
As the Partner Success Director at Stacker, Angelica Catalano Sanchez works with publishers to incorporate high-quality, data-driven content into everyday coverage. With nearly 15 years in content production and partnership management, her work has been showcased on platforms including PBS, Teen Vogue, and leading nonprofits. She has utilized collaborative storytelling to help grow The Mighty into a 3M-member community. Angelica holds a Bachelor’s degree from Cornell University.
Featured Image Credit: Lucigerma // Shutterstock