

At a glance, your Stacker Portal's Recent Trends charts can look helpful and important, but you might be looking for some extra guidance on how to use them in your future content planning.
For example, noticing that a category like News has the highest average number of pickups isn't enough to capture the full value of these charts. You need to know how the metric is being measured and whether that's the number you should be chasing for your own brand.
If you're feeling seen and know you can do more with your Insights, read on for a short explainer about what each metric does and how it can guide your content strategy.
What does Recent Trends show?
The Recent Trends module lives in the Content Insights tab. It shows which story categories have trended over the last 90 days, and you can toggle the chart to rank it by the metric you choose.
"Above average" is our shorthand for identifying which stories are outliers relative to a category and a metric. So hitting the above-average bar might mean success for your brand, or it might mean you're working harder than you need to.
How "above average" is calculated
Stacker measures "above average" with four metrics, split across two questions:
- Volume: How much content is moving within a category? This signals how crowded the space is.
- To stand out in high-volume categories, stories should be timely and data-driven, help readers answer a question or address a pain point, and provide some unique findings that similar stories wouldn’t have.
- Quality/authority: Where are the stories landing? Knowing which outlets pick up the top stories signals how competitive you need to be to break through and capture those publishers as well.
The module ranks the same seven categories (Entertainment, Lifestyle, Money, News, Science, Sports, Travel) using four metrics that capture what matters most for PR and AI visibility: volume, reach, quality of pickup, and publisher caliber.
Since each metric shows the average, you can easily see how your stories rank against your vertical's yardstick.
Explaining the four metrics
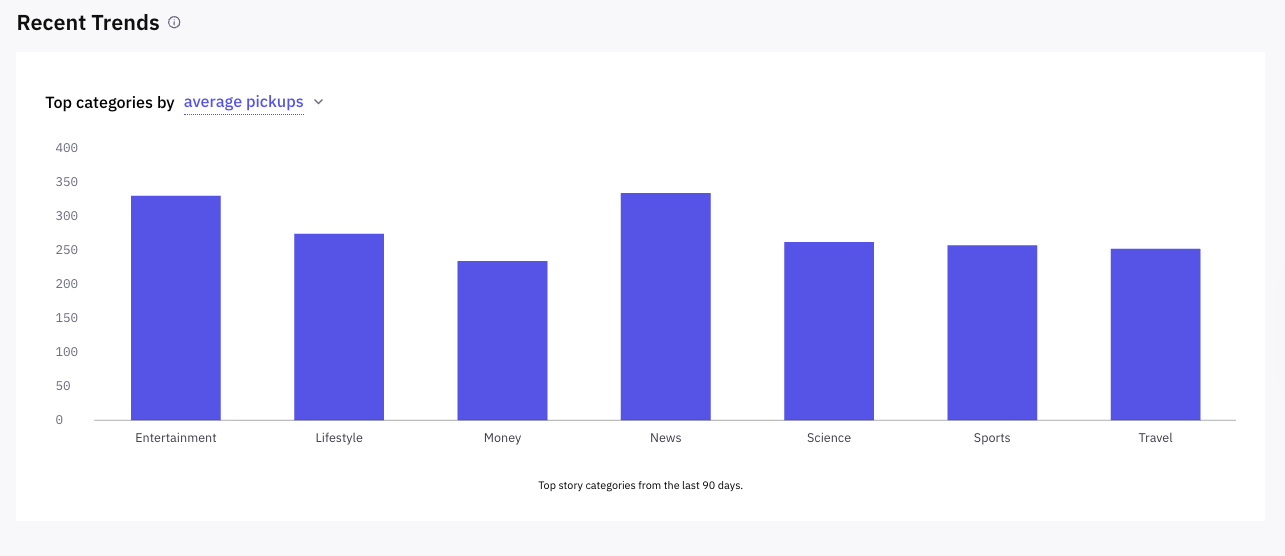
#1: Average pickups: Stories publishers are most interested in
This measures the average raw count of outlets that ran a story in each category, shown by each bar's height. It's the best read on publisher appetite because it shows which categories have the most publishers actively picking up content right now. In the example below, you’ll see that publishers have recently been very interested in republishing stories in News and Science.
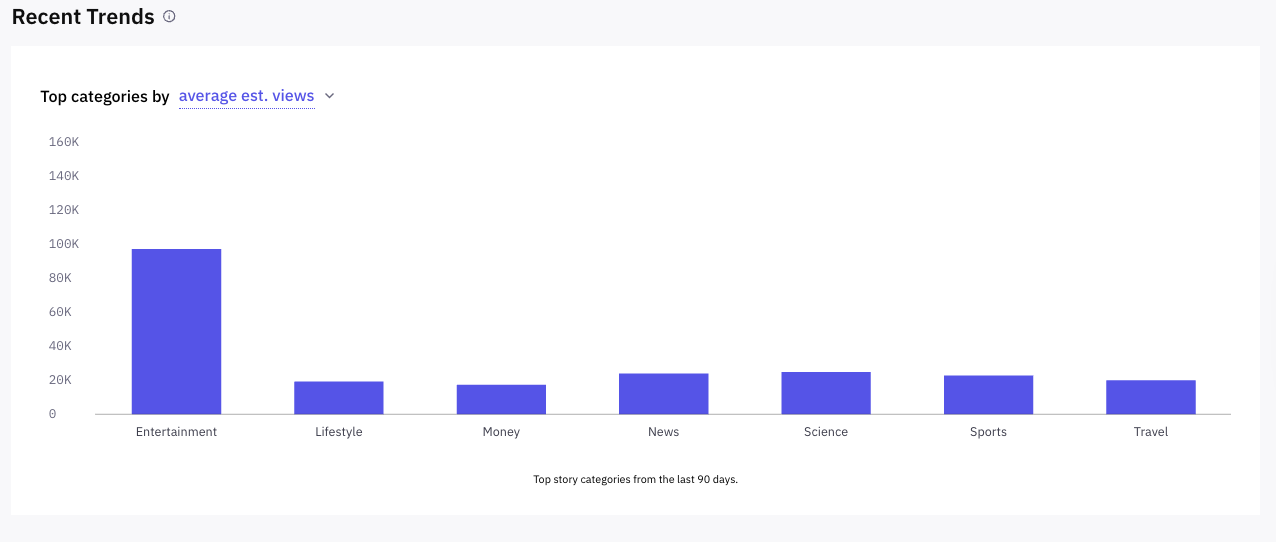
#2: Average est. views: Categories that audiences want to read
Average est. views estimates how many people actually saw the stories, rather than how many outlets ran them — so it shows what audiences want to read, versus what publishers want to run. The two metrics can diverge when a category ranks modestly on pickups but gets a disproportionately high number of views if even a handful of stories land on high-traffic sites.
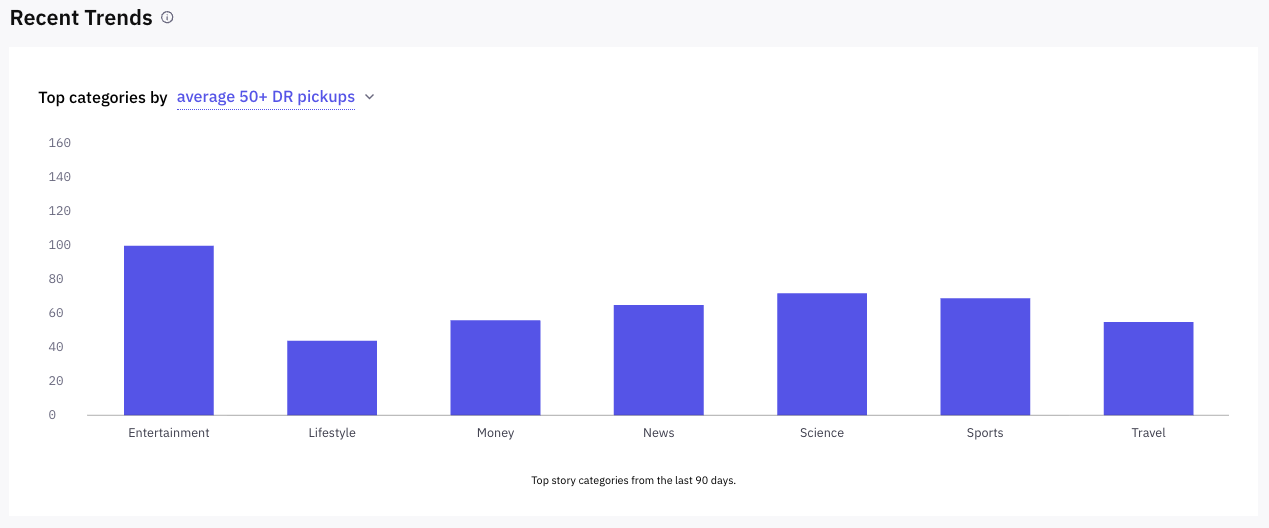
#3: Average 50+ DR pickups: What reputable outlets care about now
Want to know which categories are landing in high-quality outlets? Whereas metric #1 counts every pickup in the last 90 days, this one filters out outlets with a Domain Rating (DR) of 49 or lower. A quick look shows you which categories higher-authority outlets are interested in right now. These outlets typically prefer higher-quality stories that provide both data and a breakdown of complex topics for readers.
This metric shows that not every insight is equally useful for every brand. It's worth watching if you want to:
- Improve your brand's credibility or trust
- Increase your visibility in AI
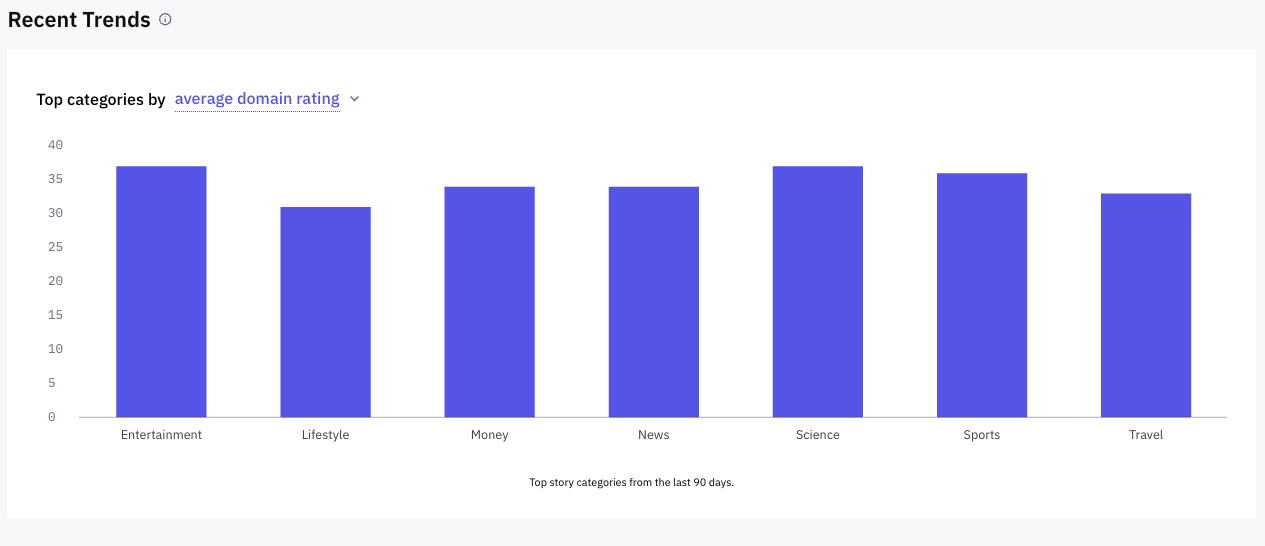
#4: Average domain rating: Categories with the highest-caliber publishers
Finally, see the average authority of all sites that picked up a story in a category, not just the top tier. It's the best single read on overall publisher caliber for a category, and on what caliber of outlet is most likely to pick up your content.
Acting on these metrics to improve your content strategy
Each metric adds a piece to the puzzle of what publishers want and how you can meet their needs. To see how the insights apply to your content strategy, ask yourself:
- What's your brand's main content objective right now? This determines which metric you should focus on, as strategies differ slightly depending on whether you are trying to capture publishers, readers, high-authority placements, or AI citations.
- Do Recent Trends tell you which category to create more content in? Not on its own. See where publisher appetite and pickup quality currently sit, but you'll have to determine whether your brand can compete there and whether the category fits your beat.
- Are there better-performing categories relevant to your strategy that might raise your odds of success?
One metric alone rarely tells you much, but the combination does. For instance, being above average on pickups but below on DR means you're getting volume, not authority. If you're getting below average on pickups, but above on 50+ DR pickups — that means fewer placements, but in high-authority outlets, which could be exactly what you want if credibility or AI visibility is your goal.
Still have questions about what to do next with your insights? Get in touch with your Content Strategist or Account Manager.
Diana Shishkina is Stacker's Senior Lead of Content Operations. She has worked in content for over 8 years, contributing to Stacker as a writer, editor, data journalism lead, and content strategist. In her current role, Diana works in both editorial operations and strategy, analyzing our network data and publisher needs in order to directly help clients across different industries construct digital content that meets their SEO and GEO goals.