
Here's how American families, from the poorest to the richest, spend their money
This story originally appeared on CouponBirds and was produced and distributed in partnership with Stacker Studio.
Here's how American families, from the poorest to the richest, spend their money
Americans certainly know how to spend money. And they're doing it at escalating rates—even outpacing inflation.
U.S. households spent an average of $67,000 in 2021 on everything from groceries to political contributions, according to Bureau of Labor Statistics data. That was a 9.1% increase over 2020. Pre-tax incomes were up about 3.7%, and the Consumer Price Index—which measures inflation through urban prices of various goods and services—increased by 4.7%.
Predictably, the highest expenditures among all income brackets are on necessities like housing, transportation, and food. But spending can vary widely among demographics.
CouponBirds used 2021 BLS Consumer Expenditures Survey data to analyze spending differences based on pre-tax household income, examining spending overall and within four major categories. Spending increased within all income brackets in 2021 and grew faster than pre-tax earnings in each.
Income inevitably has the most profound effect on how people spend. The idea of living paycheck to paycheck isn't new. Still, the data spells it out clearly: Lower-income households must spend a higher share on daily necessities—and don't make enough to cover even that, reinforcing cycles of poverty. Meanwhile, higher earners have more to save and invest in retirement.
Among this data set, the average household size of all survey respondents was 2.4, with the highest income bracket at 3.2 people and the lowest income bracket at 1.7 people. While this analysis focuses on spending at various income levels, household size and other factors (age, race, place, etc.) also influence spending patterns.
Continue reading to learn more about how Americans spend depending on household income.
Debt threatens the lowest earners as they can't keep up with necessary expenses
Spending money is unavoidable. For the lowest-income people in the United States, that can often mean spending money they don't have.
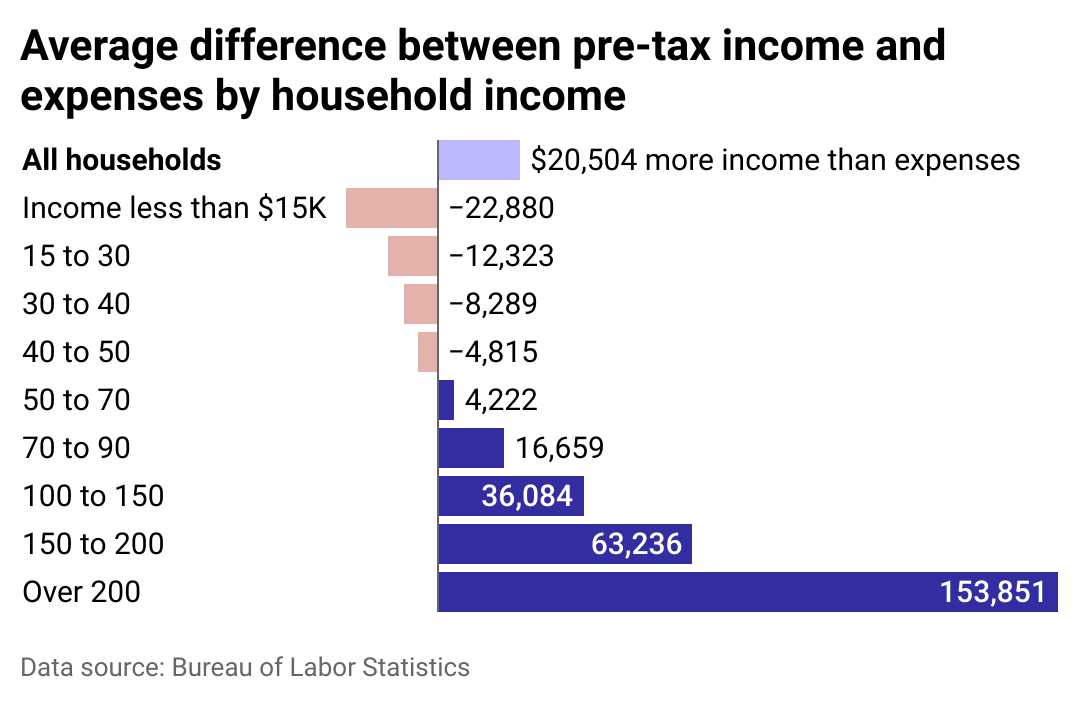
For households earning under $15,000 per year, about 90% of their spending is on essentials: housing, groceries, utilities, transportation, health care, apparel and services, and personal care products and services. And even if that's all they spent—no eating out, no movie nights, no educational expenses—they would still be at a loss of about $20,000.
Income can include government assistance such as Social Security, unemployment, workers' compensation, public assistance, Supplemental Security Income, and the Supplementary Nutrition Assistance Program.
That makes it very difficult for lower-income households to avoid taking on debt, and many also must pay with credit as they face climbing interest rates that accumulate rapidly if they don't pay off their cards in full. Inflation over the past year has compounded the issue: Outstanding credit card balances increased by nearly 17% in November 2022 compared to the previous year, according to Federal Reserve data. Interest rates have risen from 14.6% in 2021—the year of our data analysis—to 19.07% as of preliminary November estimates, to make matters worse.
Meanwhile, high earners typically have considerable money left over after accounting for expenses. With that, they can save, invest, insure, and pay off debts, securing their financial futures against unexpected costs or dips in income.
This analysis does not necessarily tell the full financial story for many Americans, partly because it looks at pre-tax income. A few thousand dollars in tax refunds can help offset expenses for the poorest Americans, while wealthier Americans may have to pay tens of thousands of dollars in taxes each year. Still, the impact is uneven: After taxes, Americans earning less than $15,000 still have an average $20,200 deficit, while those in the highest bracket maintain four times that.
High earners save more for retirement
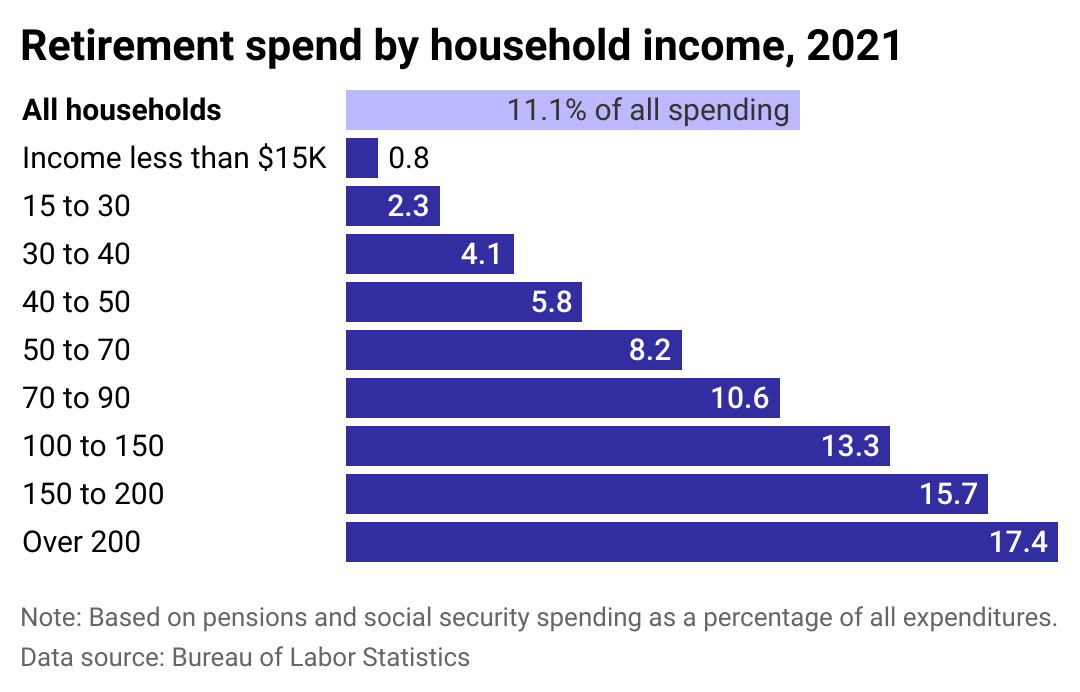
The most significant discrepancy in spending between the lowest and highest earners is in retirement savings. The wealthiest Americans have the means to allocate more than 17% of their considerably higher expenses to retirement savings.
A 2020 Retirement Research Center study found that just 18% of households had accumulated enough wealth to spend as much in retirement as they did before retirement. Three in 10 of those households continued to build wealth in the decade after retirement, though many still chose to spend less due to general uncertainty.
Without enough retirement savings, people who earn less—or don't have the means to save for retirement—may have to work later in their lives, sometimes for lower pay or in more menial jobs as skill gaps, layoffs, and market competition can force elders out of their professions.
BLS Employment Projections data shows that Americans over 55 were the only ones to increase their labor force participation rates from 2001 to 2021. The highest growth was among the oldest Americans (ages 75+). This trend is likely to continue over the next decade.
Low earners must spend more of their income on housing
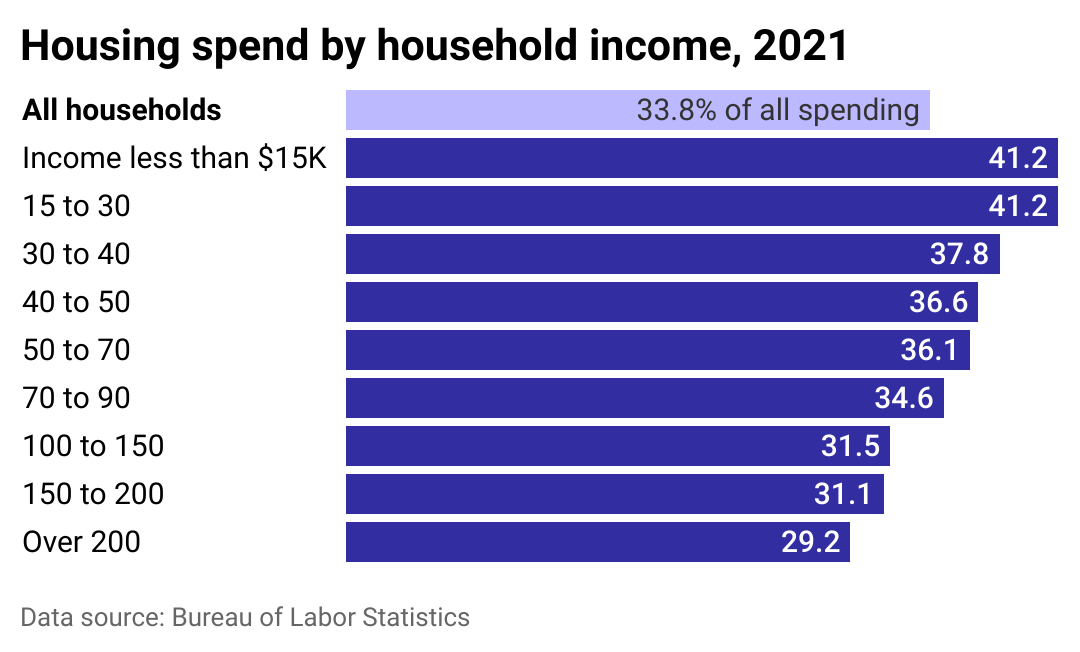
On average, one-third of the average American household spending goes to shelter. As the affordable housing crisis persists in many cities across the country, low-income households must spend a considerably higher share on housing, and their opportunity to buy property is dwindling.
Households earning less than $15,000 spend nearly that entire amount—$12,400 annually, or a little over $1,000 a month—on housing. Households earning over $200,000 a year spend four times as much on housing, though it comprises only 29.2% of their total spending.
One reason behind this is that most high earners own their homes, while renting is more common among lower earners, according to research from Pew. Rent is more susceptible to market increases, and mortgage payments remain consistent while homeownership creates further wealth. Some wealthy Americans can also buy homes without taking on debt, potentially reducing their housing expenses in future years.
Low earners spend a higher share on groceries, but people across income brackets spend roughly the same on dining out
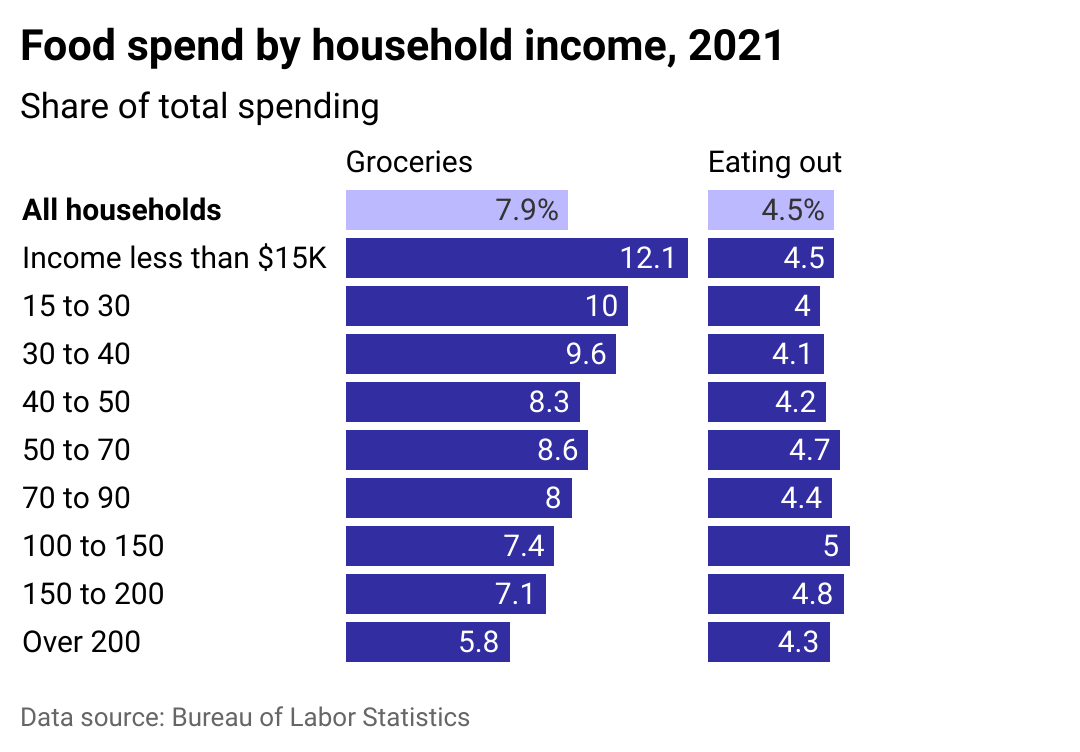
Interestingly, Americans spend similar amounts on dining out, regardless of income bracket. It could be because restaurants serve a wide variety of food, from $2 burgers to $50 steaks. Plus, Americans value speed and convenience, including with their meals: Fast food, delivery, and take-out restaurants are an American staple, and are the most popular categories among food establishments, according to BLS data.
Despite similarities in dining out, low earners have to put a much higher share of their money toward groceries. In turn, inflation has an outsized impact on these households. The BLS reported grocery costs increased 10.4% in December 2022 compared to the previous year, and staples like eggs, flour, pasta, and coffee saw the steepest increases. Comparatively, the cost of dining out increased by about 8.3%.
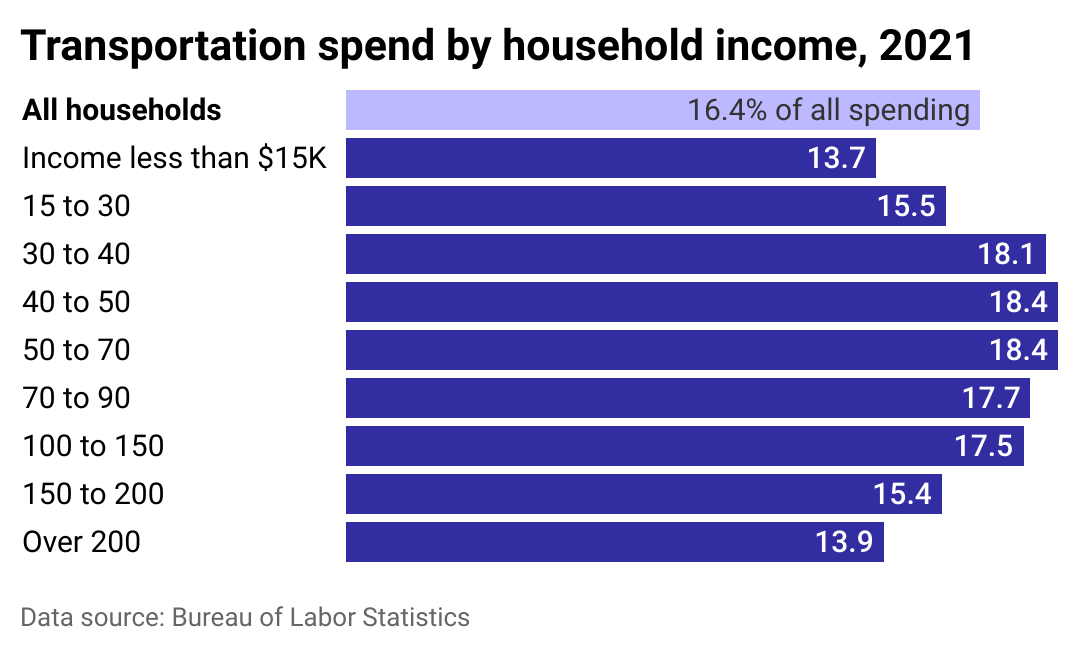
Middle-income earners spend more on transportation
After dipping 8.5% in 2020 amid COVID-19, BLS reported that transportation expenditures grew 11.6% in 2021. Households on the highest and lowest ends of the socioeconomic scale spend a similar share on transportation. However, there's a lot of variation among the middle-income levels.
Much of this has to do with car ownership and financing. Extremely low-income households have at most one car. More than a third of households earning under $15,000 a year don't have a car, which is significantly lower than any other bracket. By walking, biking, or using public transportation—which often offers discounted rates for low-income riders—many people don't have to spend as much getting from place to place.
For middle-income Americans, car ownership adds up. Those with incomes of $30,000 to $100,000 typically have closer to two cars. In 2021, they spent between $3,000 and $5,000 on cars and trucks, $2,000 or so on gas, and another $3,000 to $4,000 on other expenses like insurance and repairs, BLS data shows.
Those making over $150,000 typically have closer to three cars on average, but have more money to buy them outright or better credit to lock in competitive interest rates if they need financing, according to Federal Reserve data


