Home improvement spending increased around 45% in 25 years—here's how it's grown
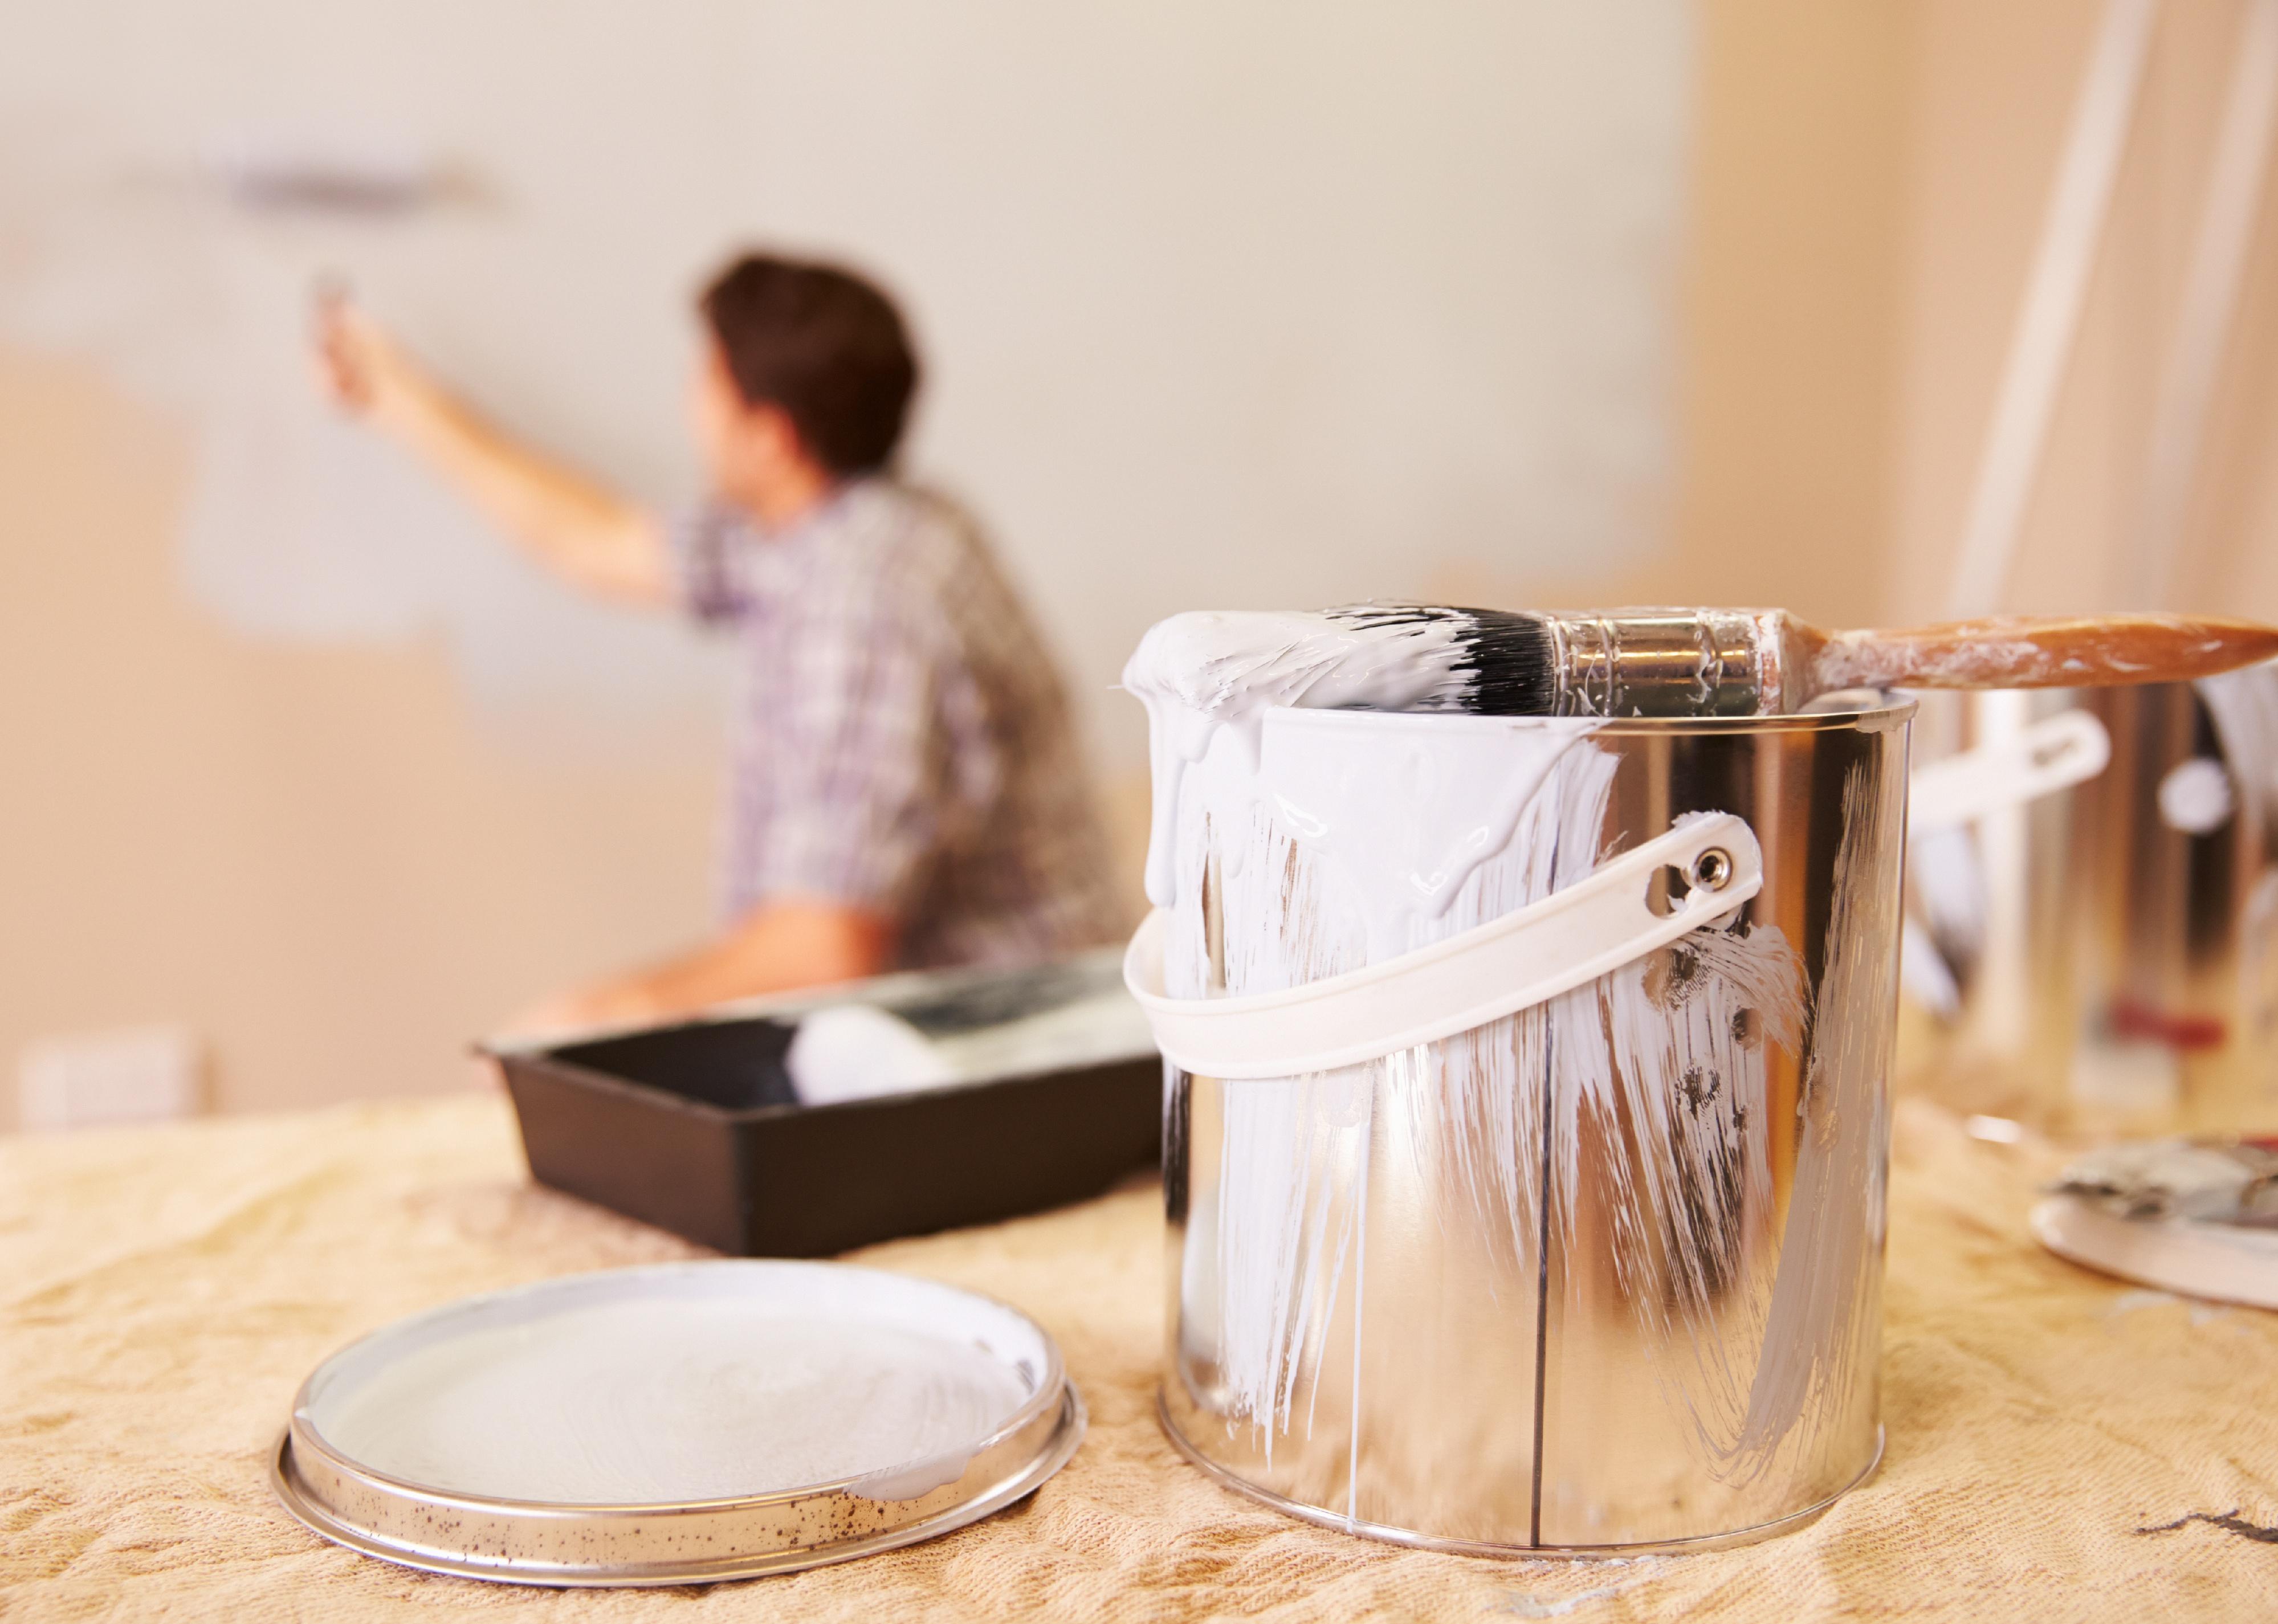
New homeowners quickly learn that property taxes and home insurance premiums aren't the only expenses to expect. After settling in, it's natural to start considering updates. Whether cosmetic changes, like repainting the living room to match your style, or a larger project, like adding a bathroom to the second floor, home improvement costs can add up quickly.
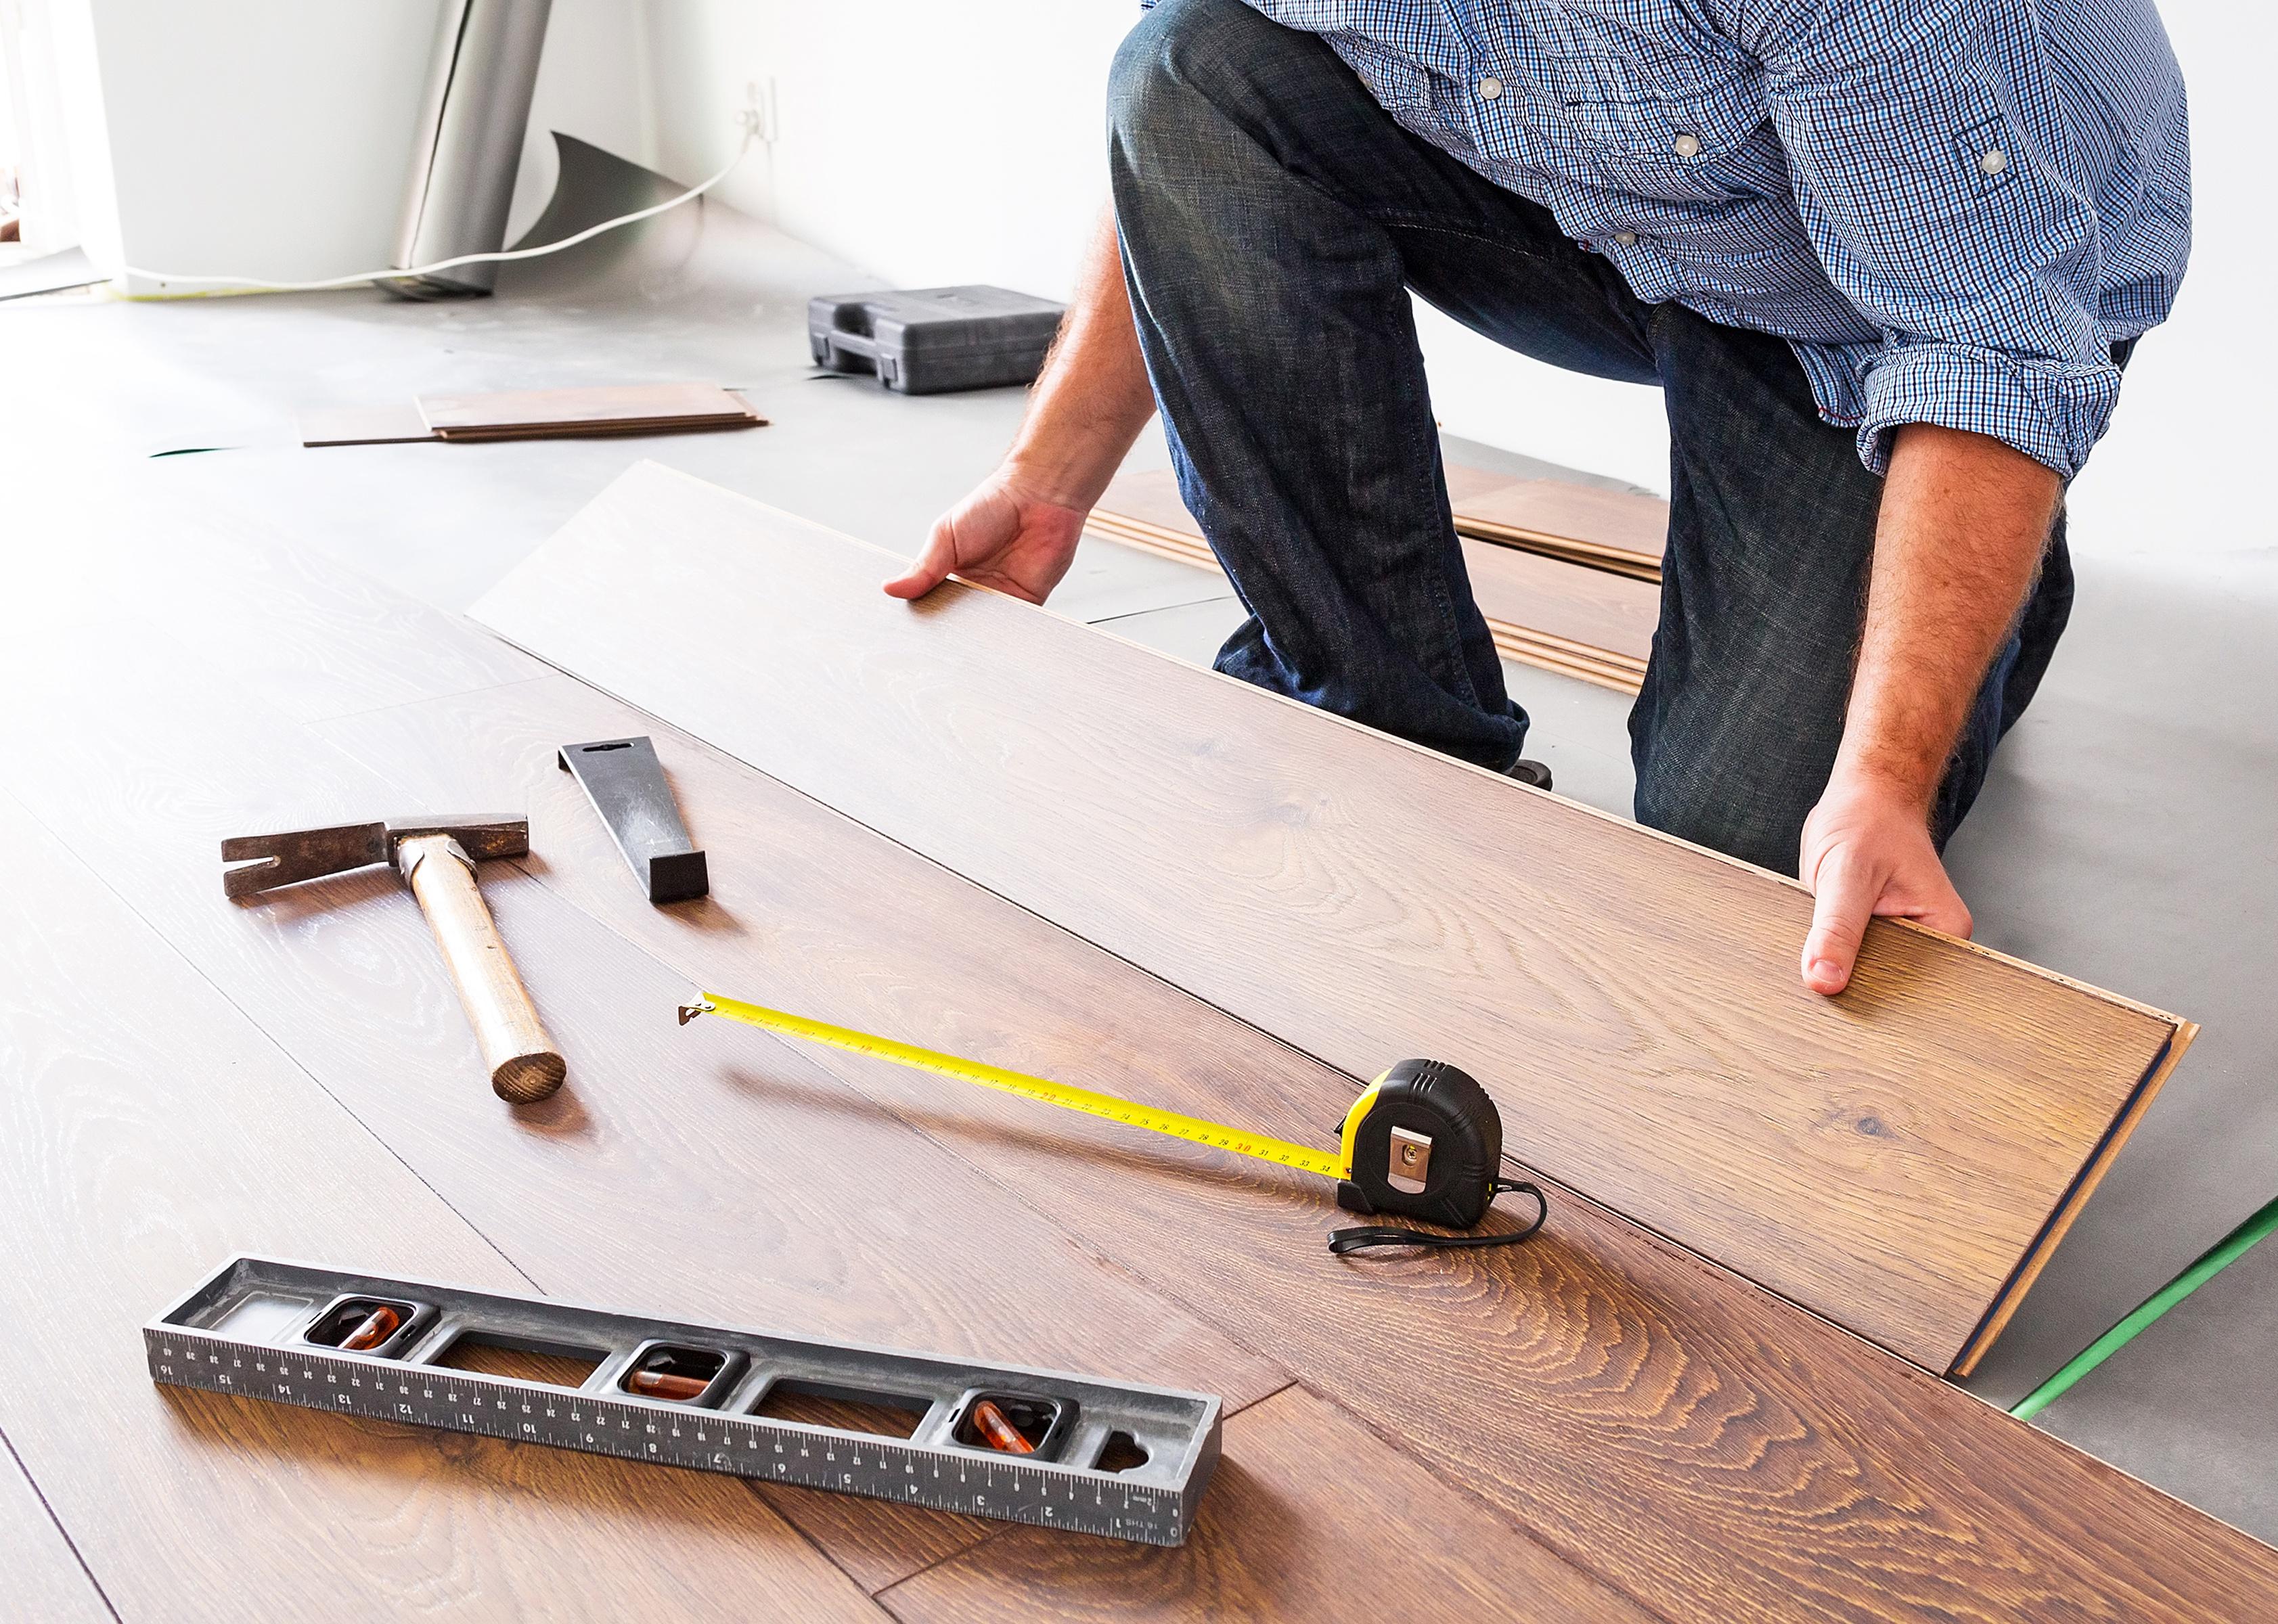
Data shows that younger homeowners might be more likely to focus on home improvement projects: According to Buildfax and the U.S. Census Bureau American Community Survey, metro areas with more significant numbers of people under 35 filed more remodeling permits.
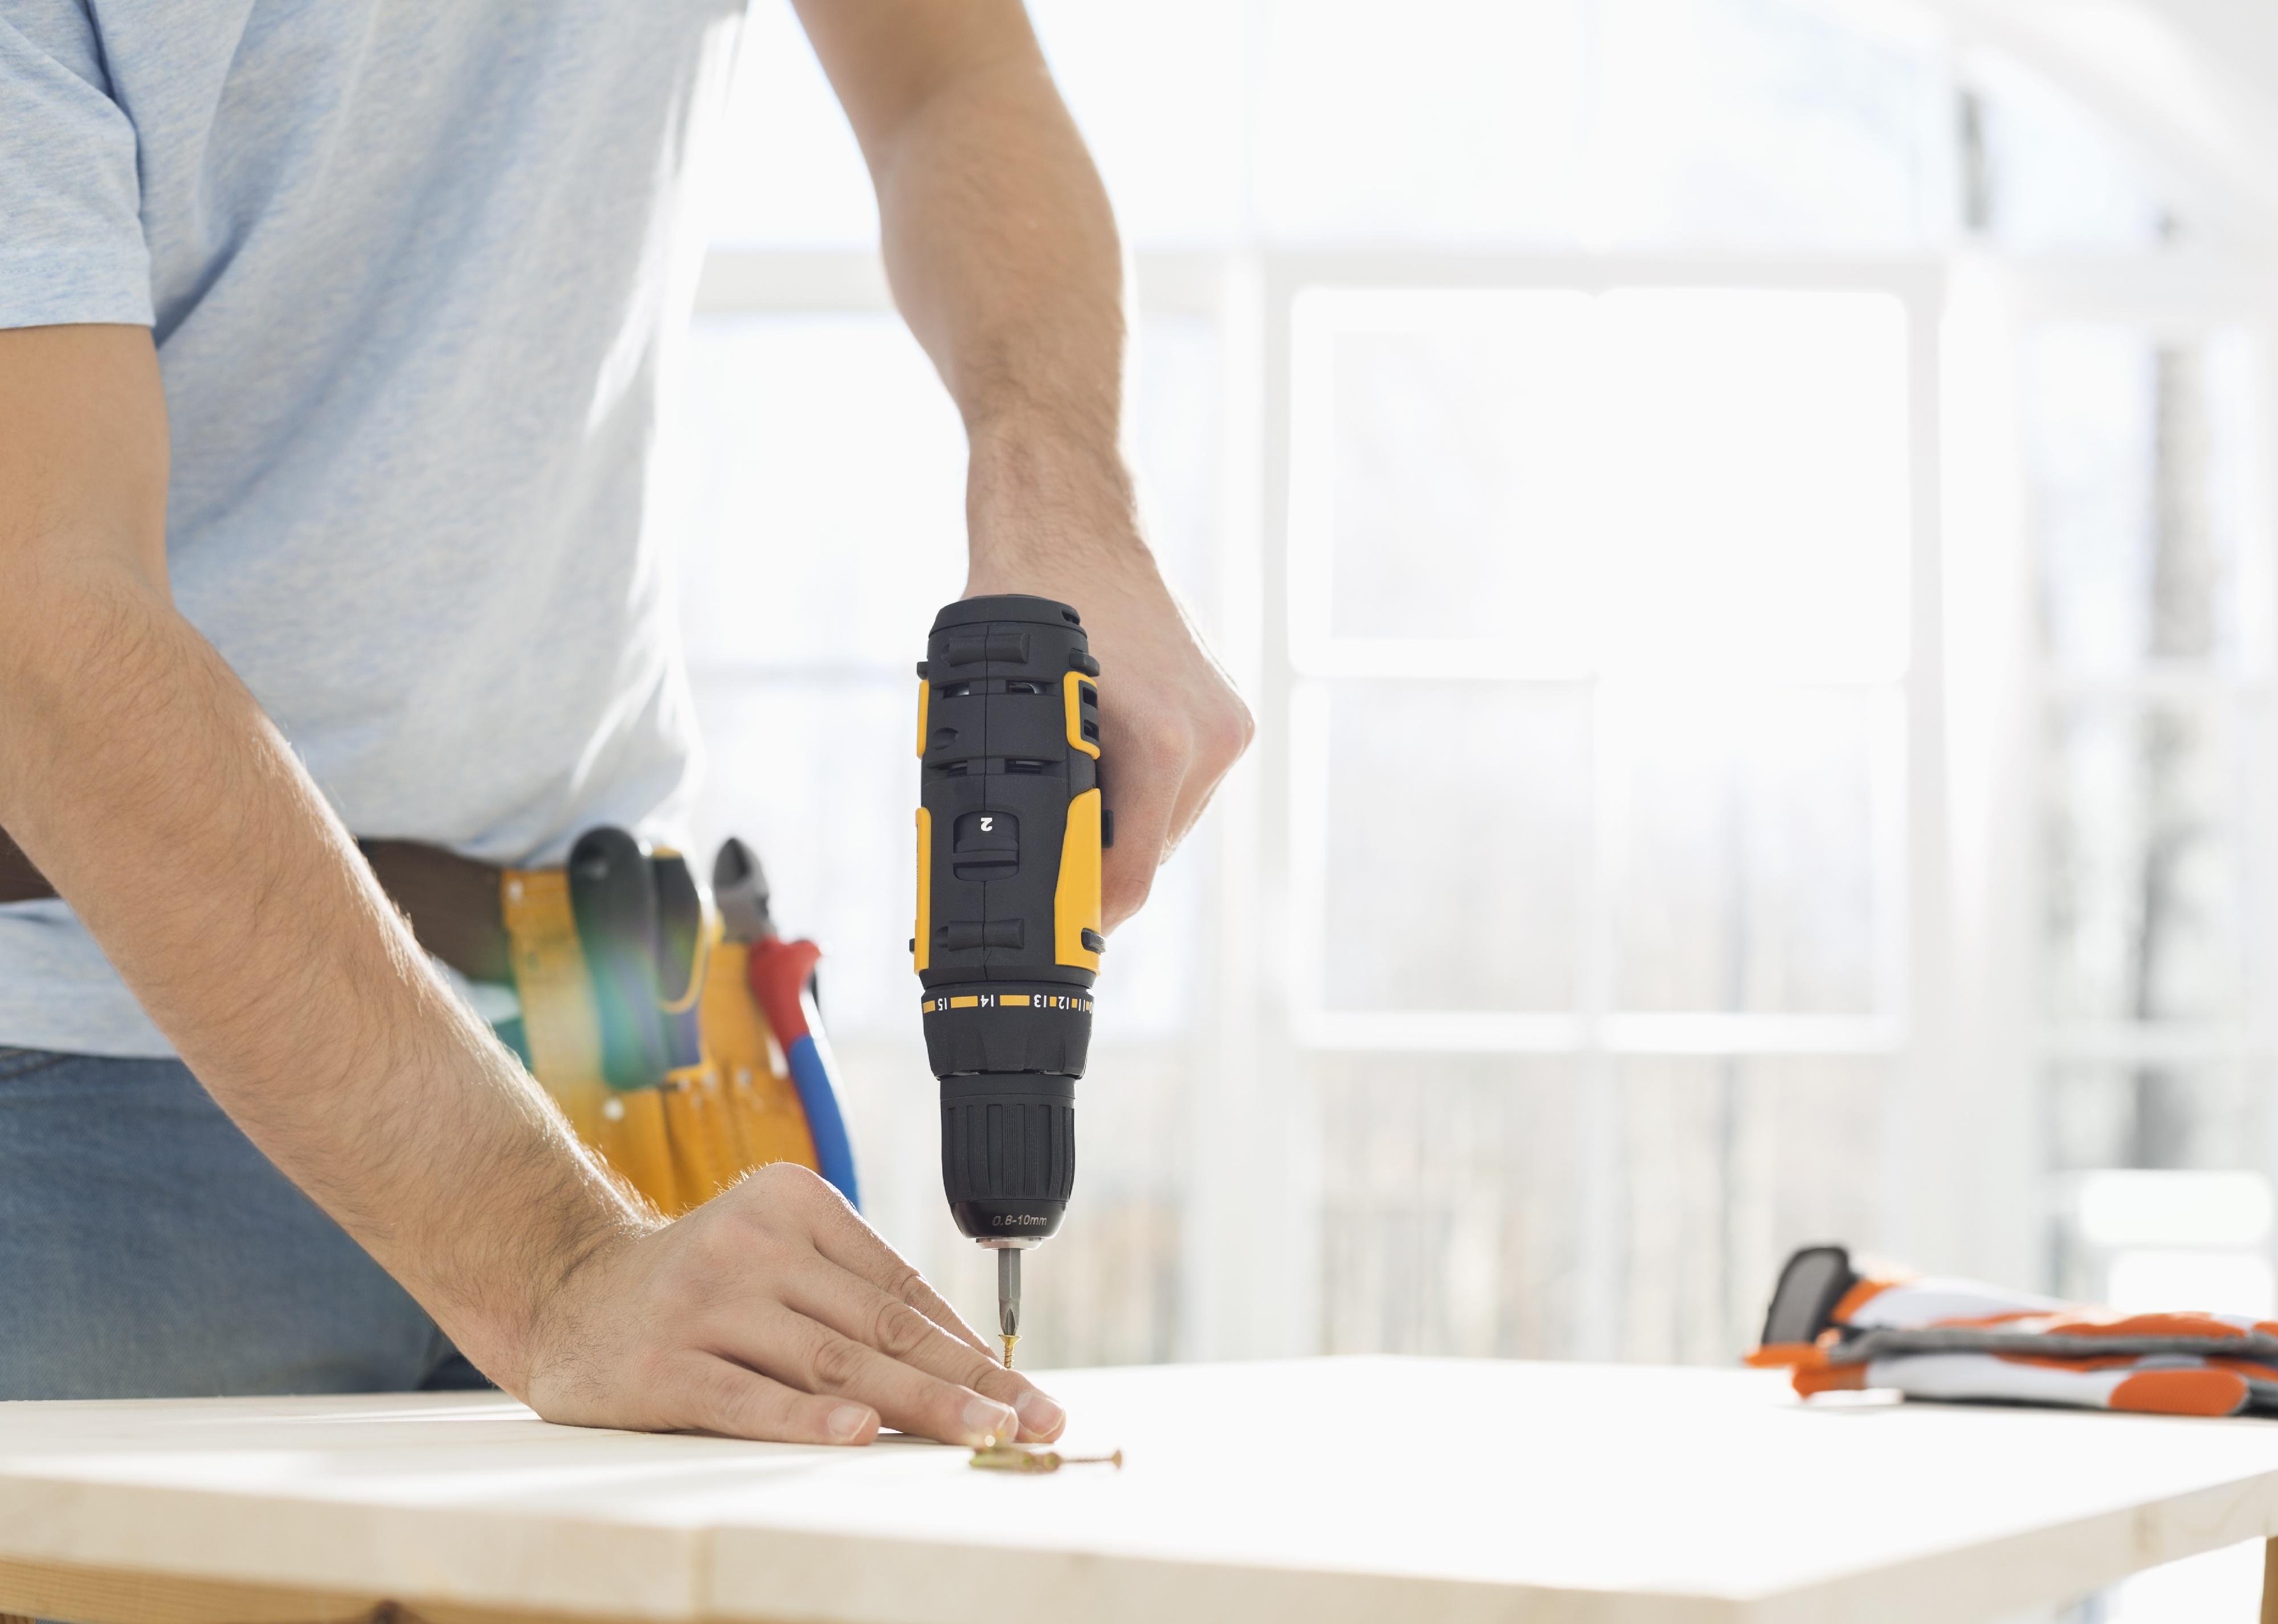
Current events can also affect the number of homeowners taking on remodels. Data from the U.S. Bureau of Labor Statistics and the U.S. Census Bureau reveals that sales at home improvement stores and professional remodeling companies recovered quickly after the onset of the COVID-19 pandemic. Though these businesses experienced an initial dip, the resurgence in popularity likely reflects the number of people looking for projects to take on around the house while sheltering in place.
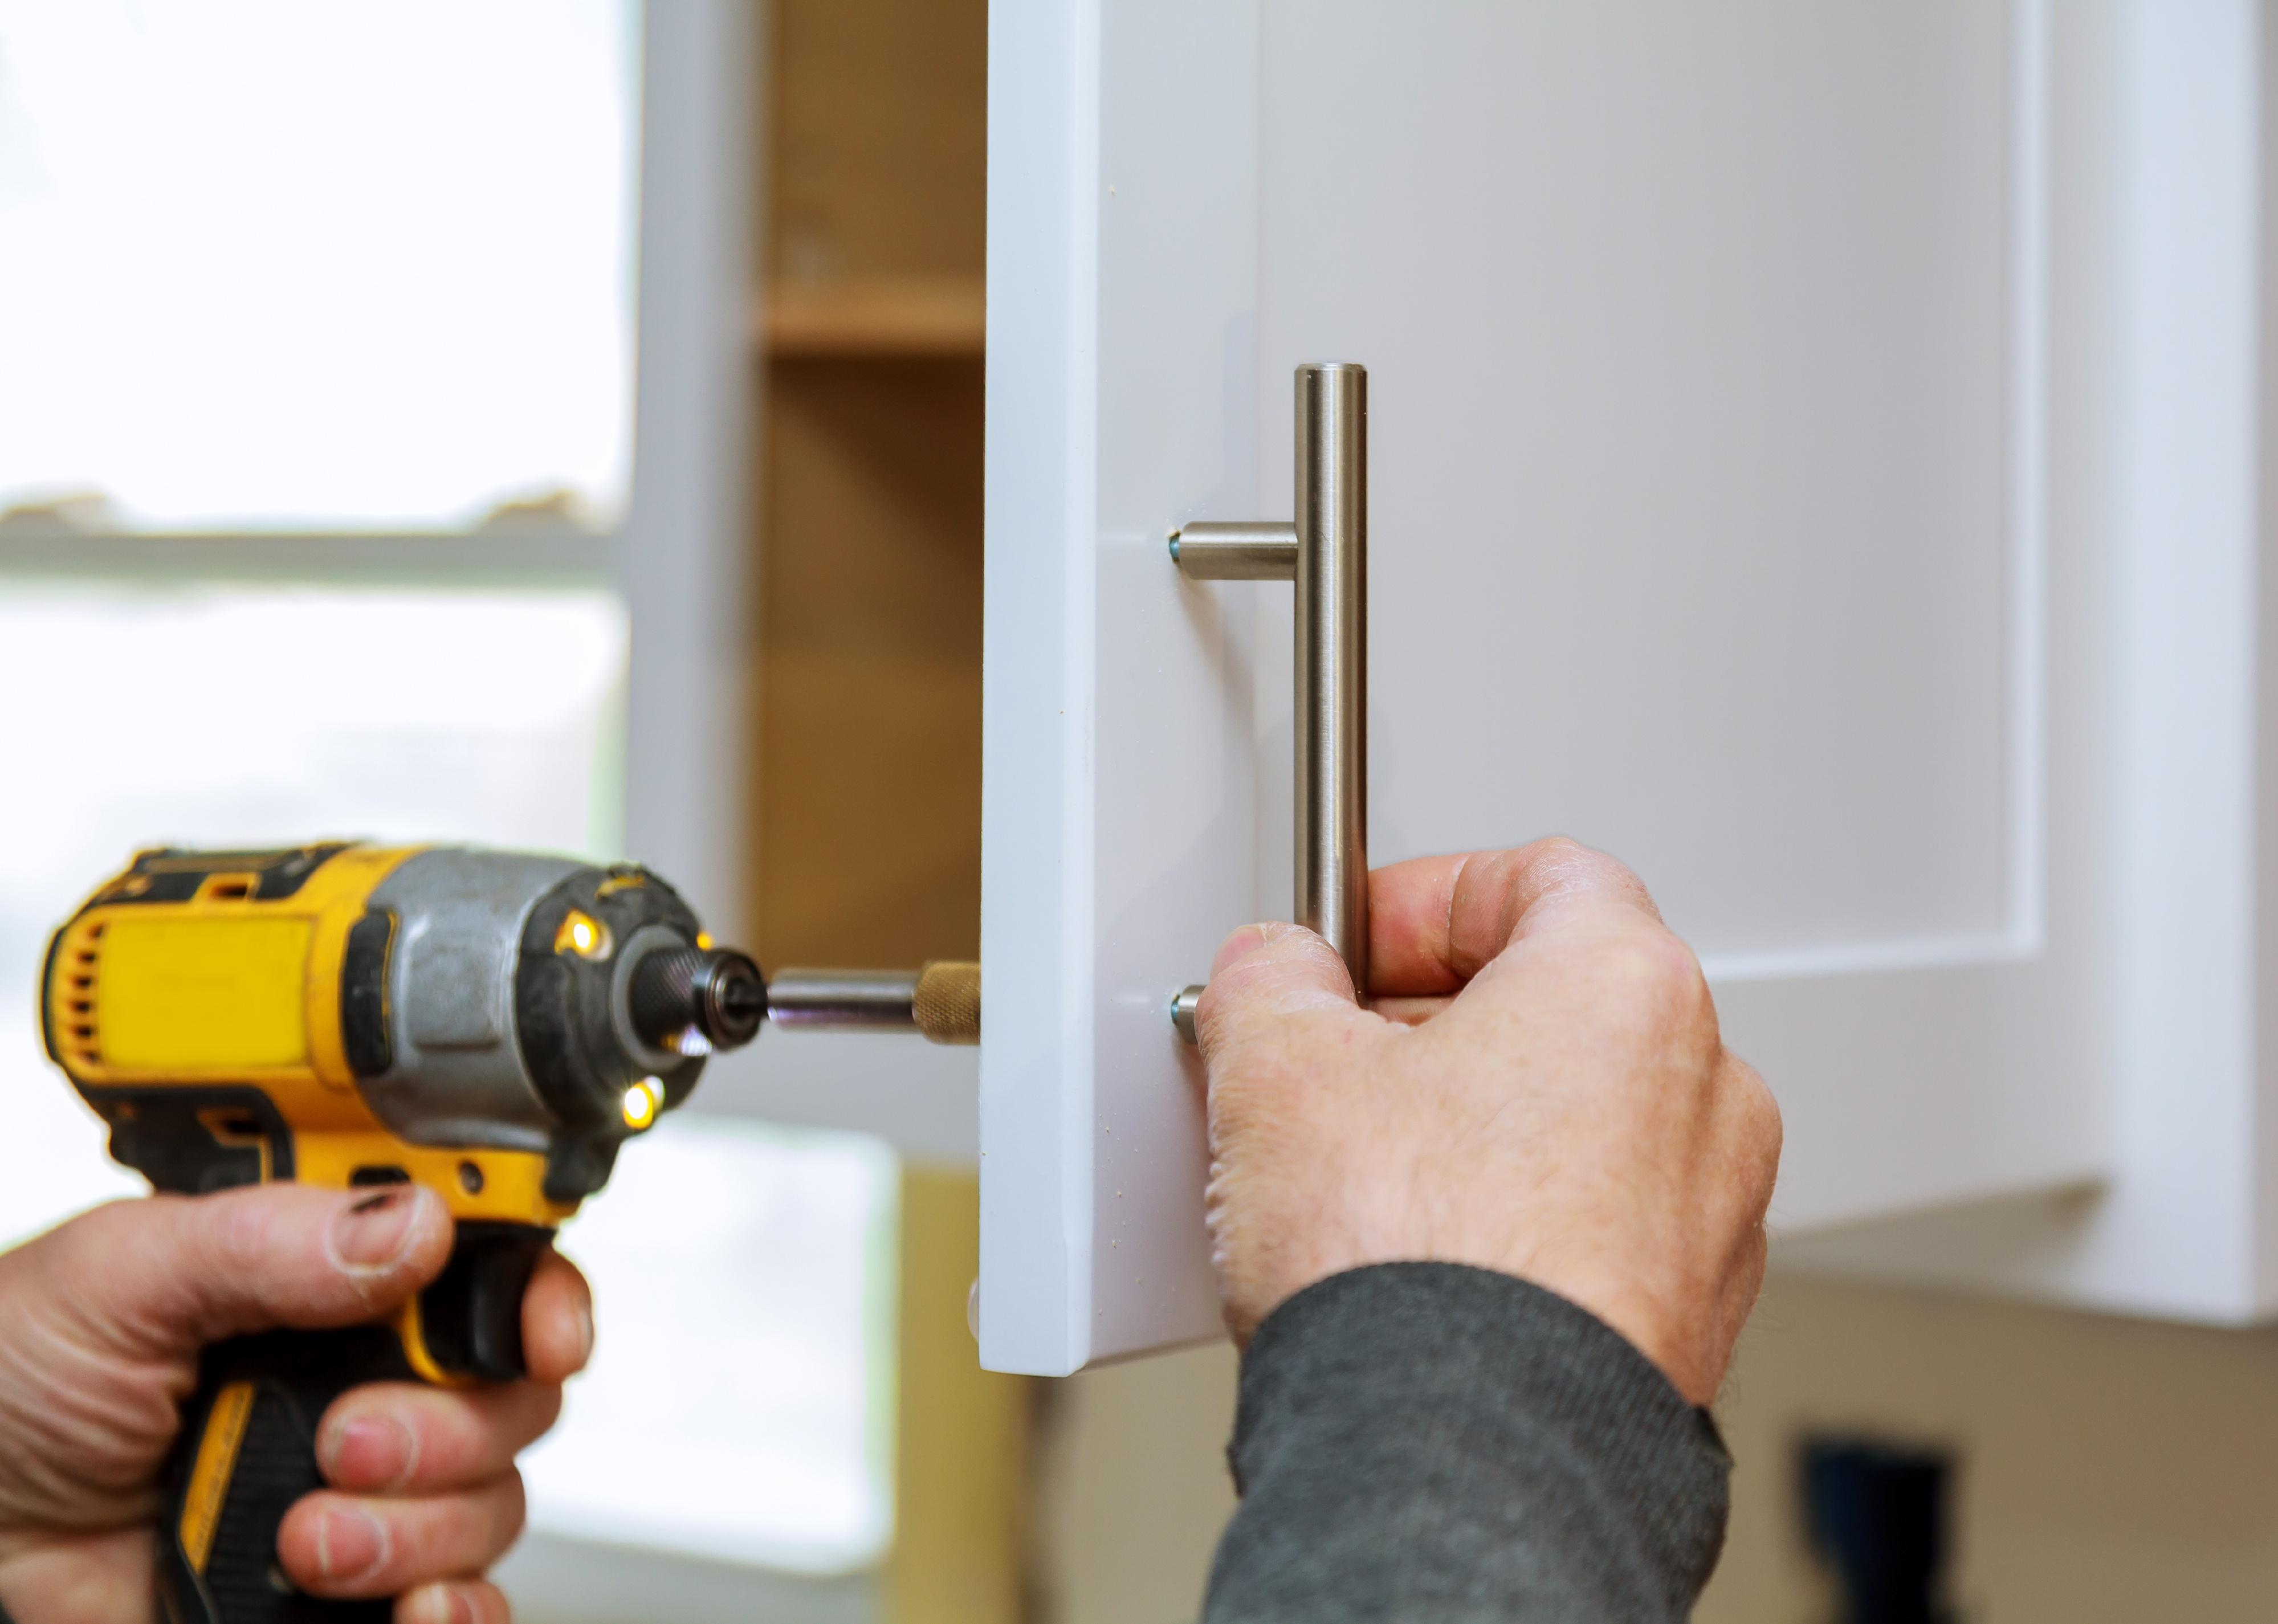
Of course, remodeling is nothing new: Americans have spent more than $7 trillion on home improvements since 1996. The cost of materials and labor due to rising inflation, supply chain delays, and inventory shortages are just some of the challenges homeowners face today. To understand how home improvement spending has changed over the past 25 years, Angi collected data from the Census Bureau's American Retail Trade Survey in 2020 and its sales data from retailers in the "building materials and garden equipment and supplies dealers" segment. The sales amounts were adjusted to reflect 2020 dollars using Consumer Price Index figures from the Federal Reserve Bank of Minneapolis.