Stacker Studio

California small businesses thrive in these counties

Written by:
August 11, 2023
Canva

This story originally appeared on altLINE and was produced and distributed in partnership with Stacker Studio.

California small businesses thrive in these counties

In 2021, the IRS received a whopping 5.4 million business applications—an all-time high since the U.S. government began tracking this data in 2004. The year with the second-highest number of new business applications? 2020. Today, small businesses employ nearly half of the nation's workers, according to a Chamber of Commerce report.

It's fair to say that the past few years have been banner years for small businesses, but what about regional differences? The business climate in a small town in Texas is likely not the same as a small town in Connecticut. The Chamber of Commerce report found that the Midwest was the most business-friendly region, thanks to the relatively low cost of living, well-educated workforce, and regulations lowering taxes and easing zoning restrictions for businesses.

Of course, the East and West coasts also have plenty to offer, from California's Silicon Valley and Hollywood studios to New York's financial hub to Massachusetts' prominence in the aerospace, defense, and information technology industries. A few states—including Delaware, Wyoming, and Nevada—even allow you to incorporate your business within their borders without ever setting foot there.

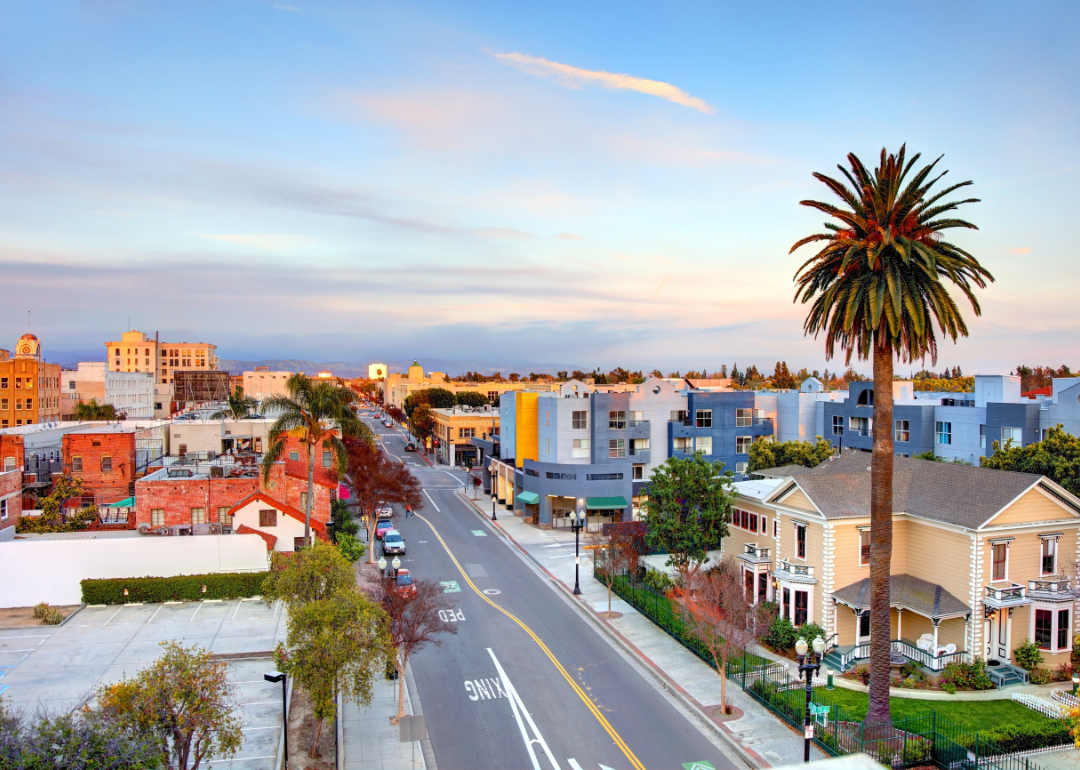
For even more specific data, let's take it a step further by analyzing counties. Are certain counties more friendly to small businesses than others? To pinpoint the areas where small businesses abound, altLINE used Census Bureau data to find the counties in California with the highest concentration of small businesses in 2021, calculated as small establishments per 1,000 residents. Small establishments are defined as those with fewer than 500 employees. Counties with fewer than 1,000 residents were excluded from the analysis, as well as counties for which the Census Bureau didn't have population estimates.

Another important factor to consider: States where nonresidents are allowed to incorporate businesses will also have a higher ratio of small businesses to residents since not all small businesses are actually operated by people living in that state.

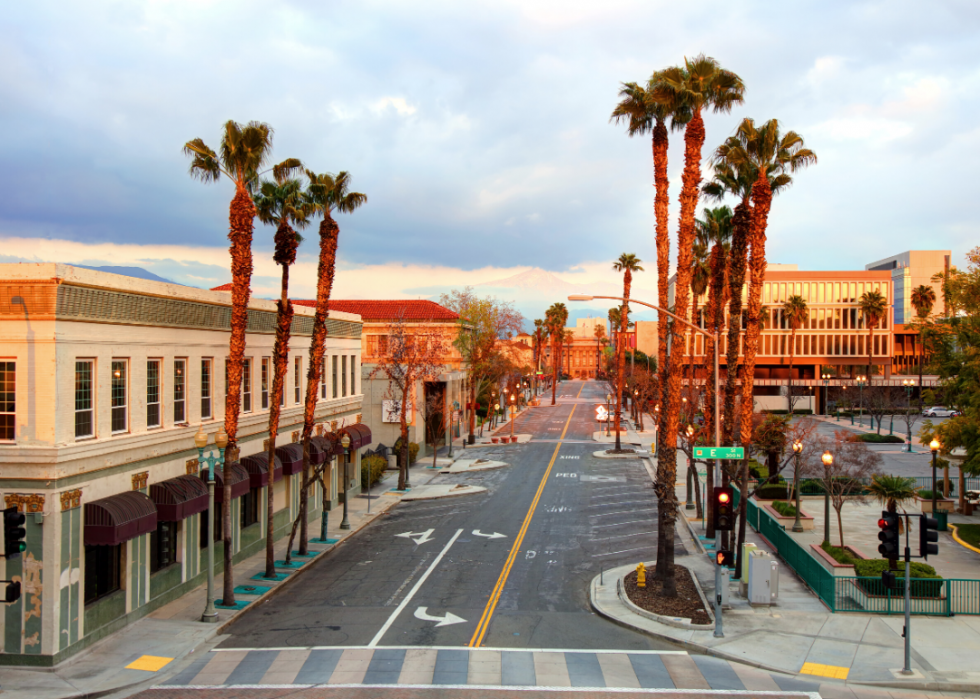
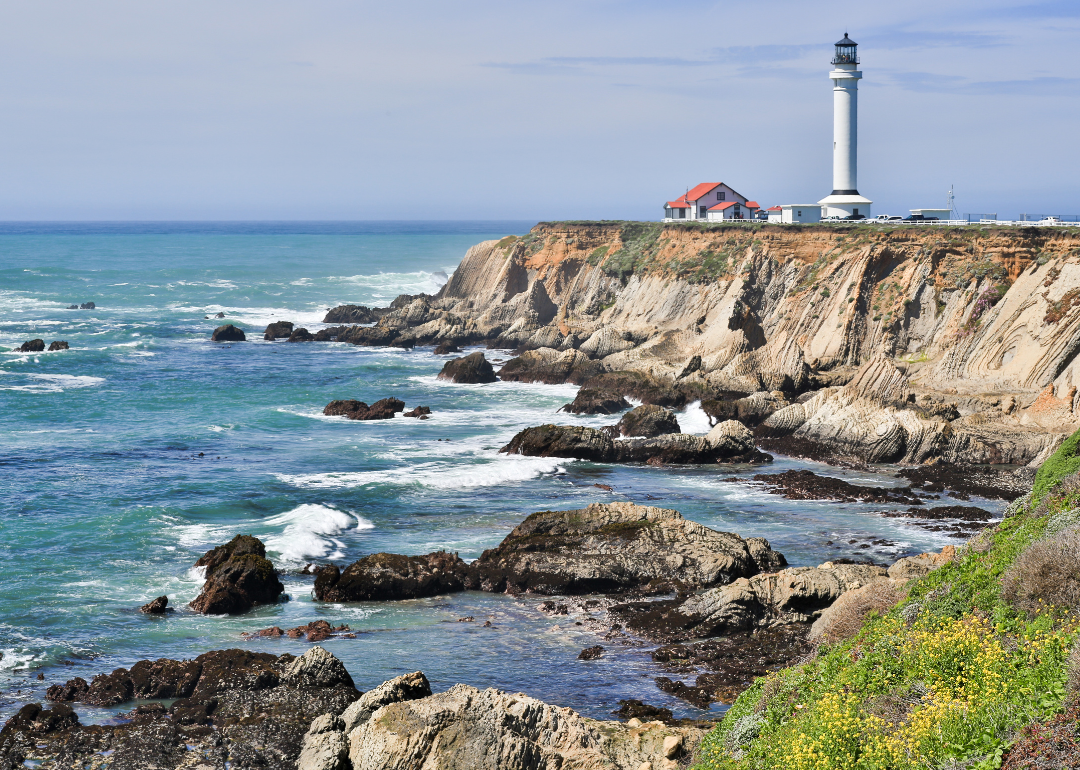
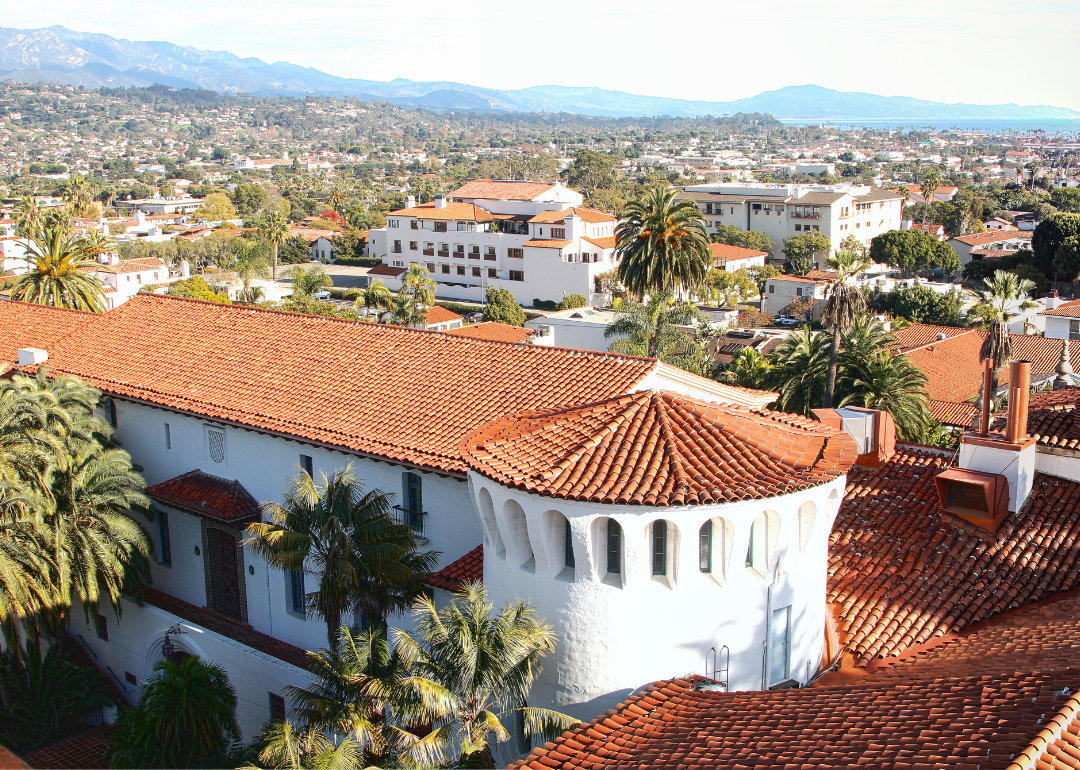
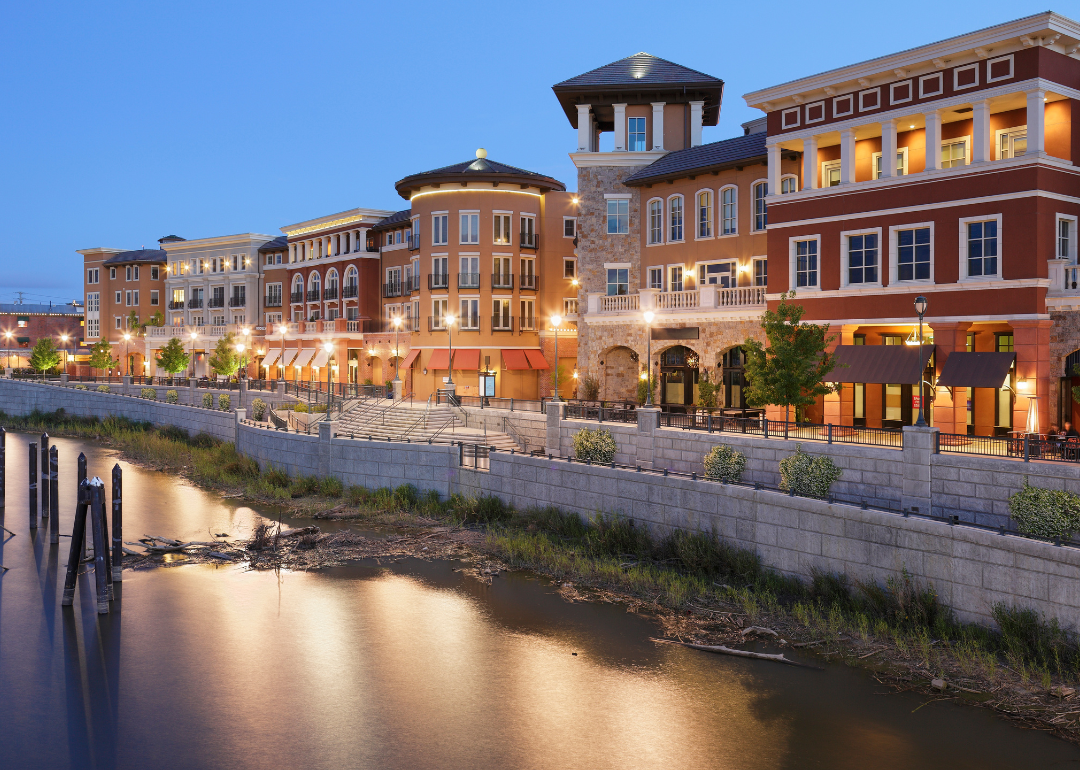
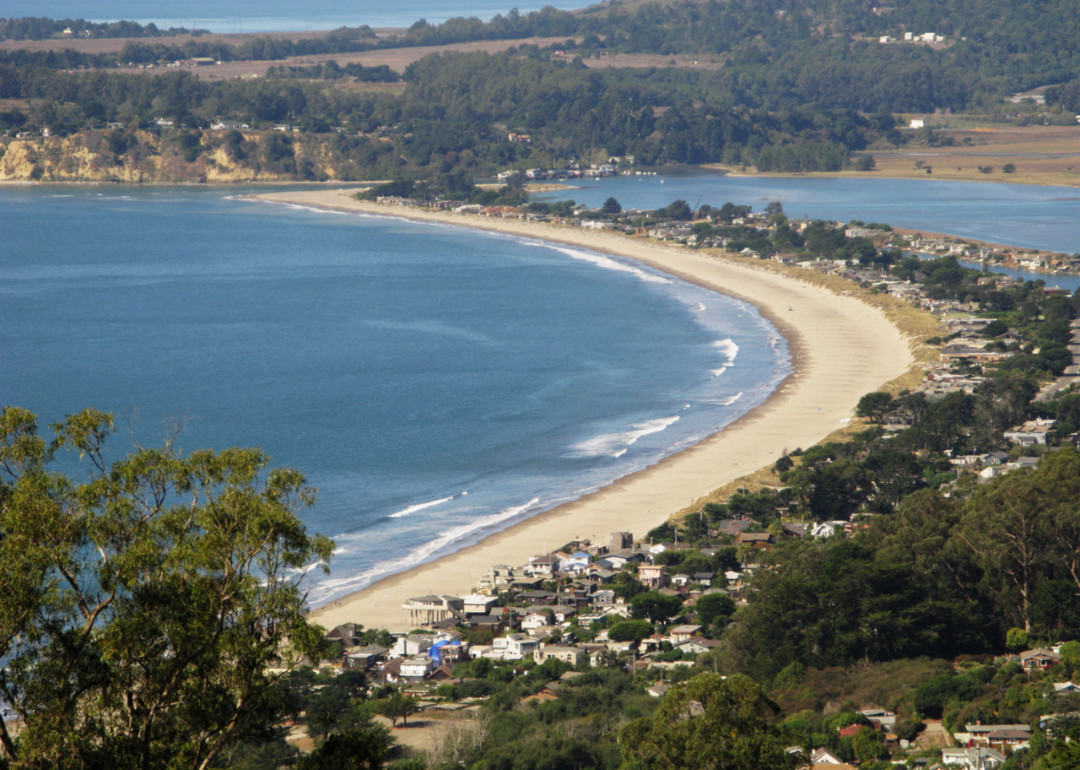
Taking a close look at the type of counties that topped the list in each state also reveals some interesting trends. World-class vacation destinations are well represented on the lists of each state, perhaps because tourists are looking to get a sense of how the locals live through small businesses like restaurants, bakeries, bars, and boutiques.

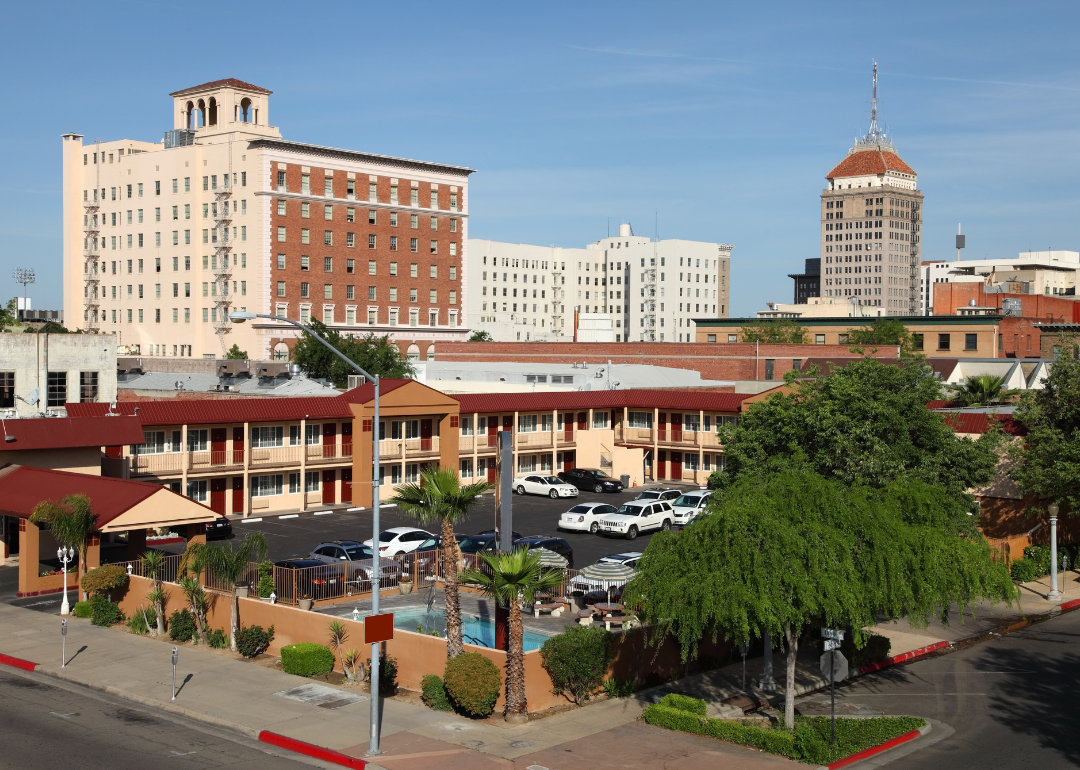
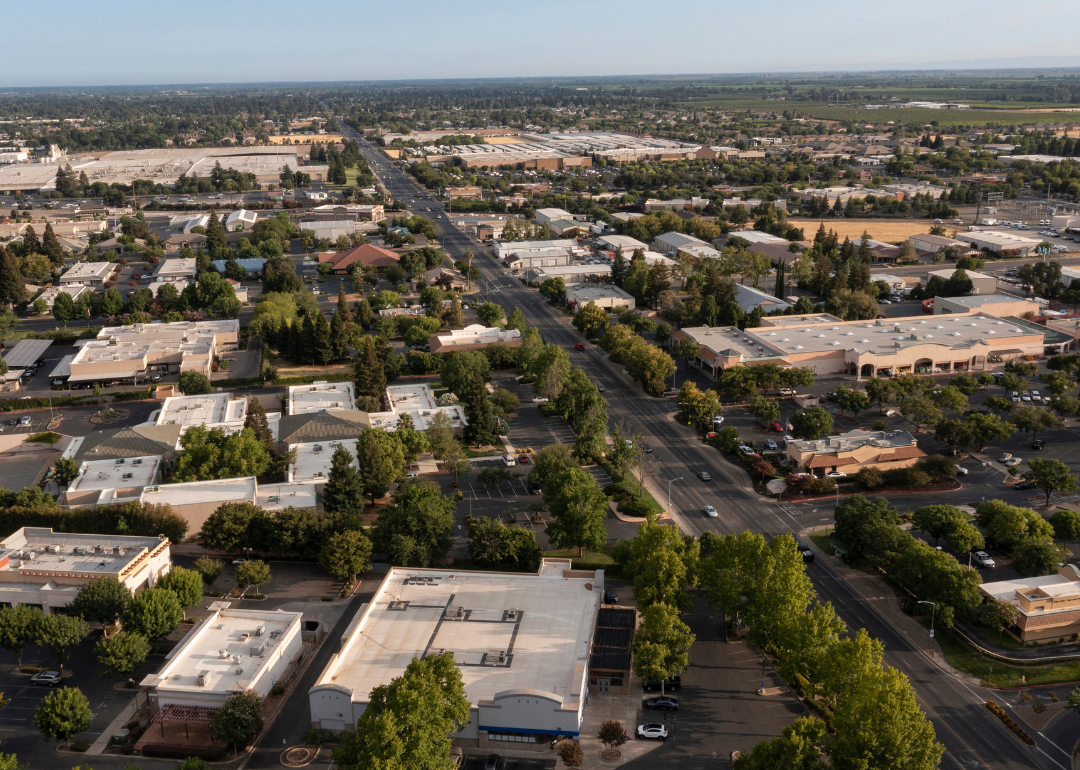
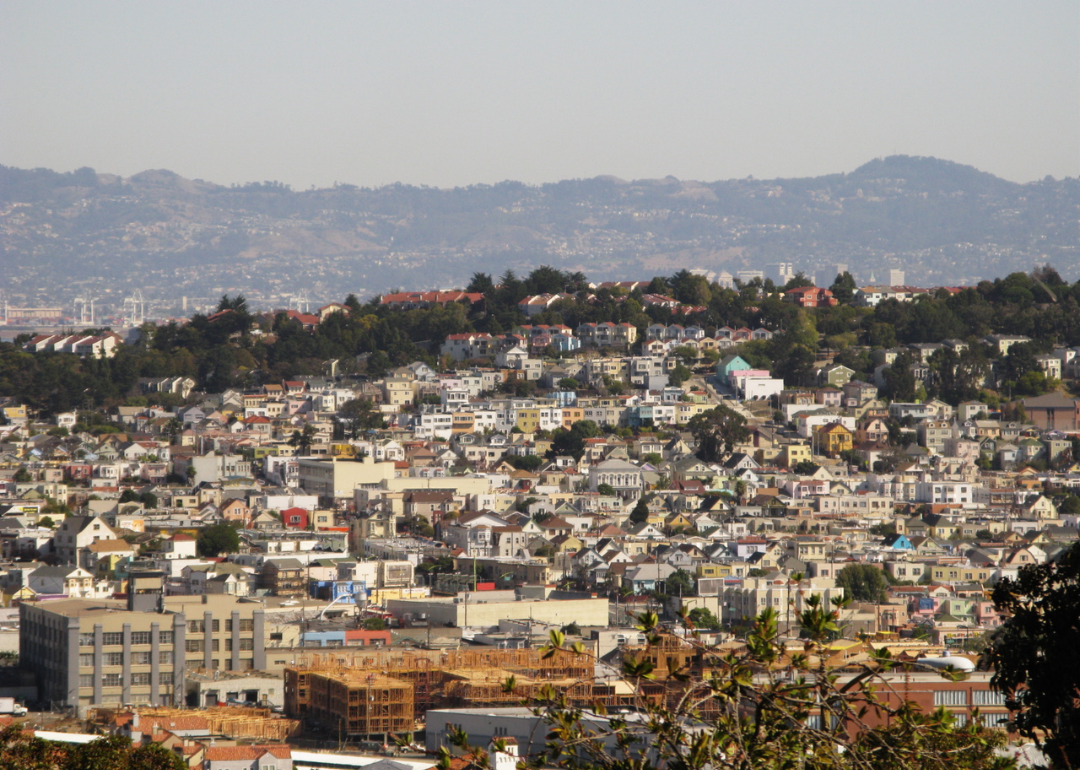
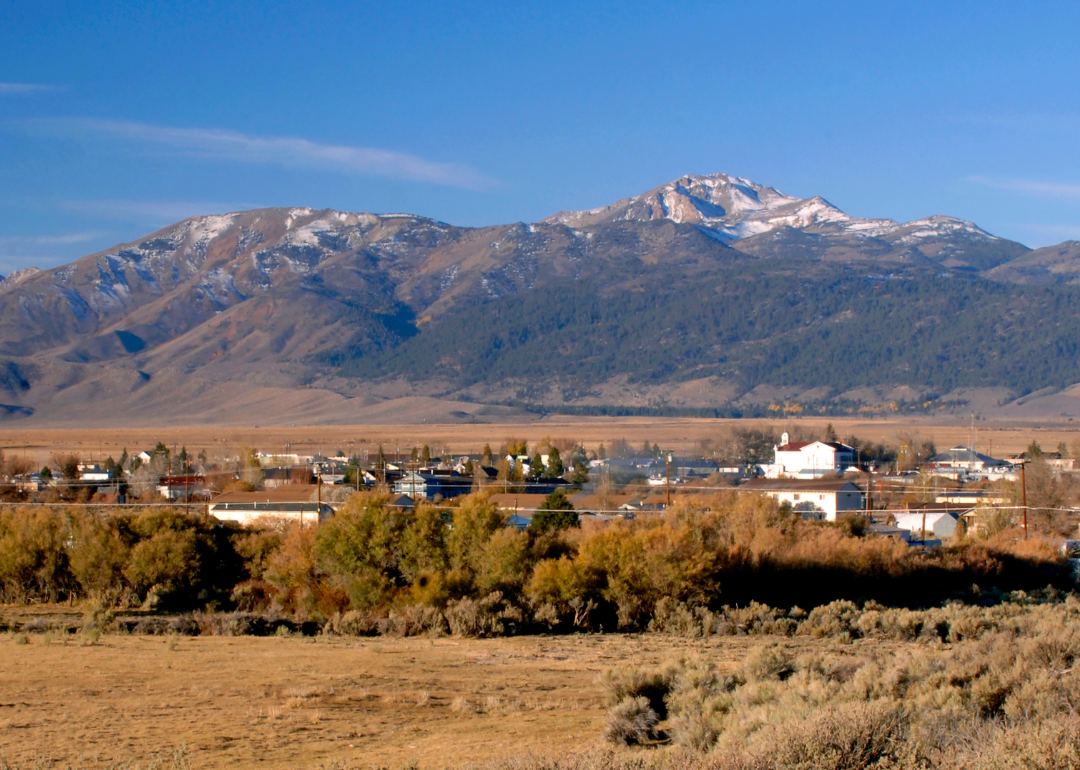
While the top counties in each state do include a few major cities, less populated counties with smaller towns are much more common. Although most of the nation's small businesses are located in major metropolitan areas, those that are located in rural areas tend to be more stable—possibly due to loyalty from local residents or the absence of competition from large corporations.

Keep reading to discover the counties in California with the highest concentration of small businesses, and see how it compares across 50 states. It just might give you inspiration for your next endeavor.

This story features data reporting by Paxtyn Merten, writing by Annalise Mantz, and is part of a series utilizing data automation across 50 states.

1 / 58
Canva

#58. Yuba County

- Total small business establishments: 833 (10.0 per 1,000 residents)
- Share of establishments that are small: 99.8%
- 2021 population: 83,216

2 / 58
Canva

#57. Kings County

- Total small business establishments: 1,720 (11.3 per 1,000 residents)
- Share of establishments that are small: 99.7%
- 2021 population: 152,679

3 / 58
Canva

#56. Merced County

- Total small business establishments: 3,335 (11.7 per 1,000 residents)
- Share of establishments that are small: 99.9%
- 2021 population: 284,458

4 / 58
Canva

#55. Lassen County

- Total small business establishments: 397 (12.5 per 1,000 residents)
- Share of establishments that are small: 100.0%
- 2021 population: 31,813

5 / 58
Canva

#54. Madera County

- Total small business establishments: 2,158 (13.6 per 1,000 residents)
- Share of establishments that are small: 99.8%
- 2021 population: 158,910

6 / 58
Canva

#53. Tulare County

- Total small business establishments: 6,755 (14.2 per 1,000 residents)
- Share of establishments that are small: 99.9%
- 2021 population: 476,946

7 / 58
Canva

#52. Imperial County

- Total small business establishments: 2,580 (14.4 per 1,000 residents)
- Share of establishments that are small: 99.8%
- 2021 population: 179,215

8 / 58
Canva

#51. Del Norte County

- Total small business establishments: 408 (14.8 per 1,000 residents)
- Share of establishments that are small: 99.5%
- 2021 population: 27,553

9 / 58
Canva

#50. Kern County

- Total small business establishments: 13,706 (15.0 per 1,000 residents)
- Share of establishments that are small: 99.8%
- 2021 population: 912,351

10 / 58
Canva

#49. Tehama County

- Total small business establishments: 1,008 (15.4 per 1,000 residents)
- Share of establishments that are small: 99.9%
- 2021 population: 65,380

11 / 58
Canva

#48. San Benito County

- Total small business establishments: 1,044 (15.7 per 1,000 residents)
- Share of establishments that are small: 99.7%
- 2021 population: 66,675

12 / 58
Gibson Outdoor Photo // Shutterstock

#47. Trinity County

- Total small business establishments: 252 (15.7 per 1,000 residents)
- Share of establishments that are small: 98.8%
- 2021 population: 16,061

13 / 58
Canva

#46. Lake County

- Total small business establishments: 1,092 (15.9 per 1,000 residents)
- Share of establishments that are small: 100.0%
- 2021 population: 68,584

14 / 58
Canva

#45. San Joaquin County

- Total small business establishments: 12,674 (16.1 per 1,000 residents)
- Share of establishments that are small: 99.8%
- 2021 population: 788,140

15 / 58
Canva

#44. Solano County

- Total small business establishments: 7,411 (16.5 per 1,000 residents)
- Share of establishments that are small: 99.8%
- 2021 population: 450,350

16 / 58
CL Shebley // Shutterstock

#43. Glenn County

- Total small business establishments: 485 (16.9 per 1,000 residents)
- Share of establishments that are small: 99.6%
- 2021 population: 28,664

17 / 58
Canva

#42. Stanislaus County

- Total small business establishments: 9,594 (17.4 per 1,000 residents)
- Share of establishments that are small: 99.8%
- 2021 population: 552,851

18 / 58
Canva

#41. Riverside County

- Total small business establishments: 43,213 (17.6 per 1,000 residents)
- Share of establishments that are small: 99.8%
- 2021 population: 2,453,178

19 / 58
Canva

#40. Colusa County

- Total small business establishments: 392 (17.9 per 1,000 residents)
- Share of establishments that are small: 99.5%
- 2021 population: 21,913

20 / 58
Canva

#39. Fresno County

- Total small business establishments: 18,159 (17.9 per 1,000 residents)
- Share of establishments that are small: 99.8%
- 2021 population: 1,012,992

21 / 58
Canva

#38. Modoc County

- Total small business establishments: 155 (18.1 per 1,000 residents)
- Share of establishments that are small: 98.7%
- 2021 population: 8,571

22 / 58
Canva

#37. San Bernardino County

- Total small business establishments: 39,711 (18.1 per 1,000 residents)
- Share of establishments that are small: 99.7%
- 2021 population: 2,192,882

23 / 58
Canva

#36. Mariposa County

- Total small business establishments: 318 (18.6 per 1,000 residents)
- Share of establishments that are small: 99.4%
- 2021 population: 17,107

24 / 58
Canva

#35. Amador County

- Total small business establishments: 816 (19.8 per 1,000 residents)
- Share of establishments that are small: 99.8%
- 2021 population: 41,144

25 / 58
Canva

#34. Sacramento County

- Total small business establishments: 32,131 (20.2 per 1,000 residents)
- Share of establishments that are small: 99.8%
- 2021 population: 1,588,106

26 / 58
Canva

#33. Monterey County

- Total small business establishments: 8,937 (20.4 per 1,000 residents)
- Share of establishments that are small: 99.8%
- 2021 population: 437,249

27 / 58
Canva

#32. Yolo County

- Total small business establishments: 4,362 (20.5 per 1,000 residents)
- Share of establishments that are small: 99.8%
- 2021 population: 213,039

28 / 58
Canva

#31. Calaveras County

- Total small business establishments: 947 (20.5 per 1,000 residents)
- Share of establishments that are small: 99.9%
- 2021 population: 46,219

29 / 58
Matt Gush // Shutterstock

#30. Sutter County

- Total small business establishments: 2,044 (20.6 per 1,000 residents)
- Share of establishments that are small: 100.0%
- 2021 population: 99,038

30 / 58
Canva

#29. Contra Costa County

- Total small business establishments: 25,150 (21.6 per 1,000 residents)
- Share of establishments that are small: 99.8%
- 2021 population: 1,163,298

31 / 58
Canva

#28. Butte County

- Total small business establishments: 4,610 (22.4 per 1,000 residents)
- Share of establishments that are small: 99.9%
- 2021 population: 206,190

32 / 58
StephanieFarrell // Shutterstock

#27. Tuolumne County

- Total small business establishments: 1,245 (22.6 per 1,000 residents)
- Share of establishments that are small: 99.8%
- 2021 population: 55,065

33 / 58
Canva

#26. Sierra County

- Total small business establishments: 77 (23.4 per 1,000 residents)
- Share of establishments that are small: 100.0%
- 2021 population: 3,295

34 / 58
Canva

#25. Humboldt County

- Total small business establishments: 3,180 (23.6 per 1,000 residents)
- Share of establishments that are small: 100.0%
- 2021 population: 134,836

35 / 58
Canva

#24. Siskiyou County

- Total small business establishments: 1,050 (23.9 per 1,000 residents)
- Share of establishments that are small: 99.7%
- 2021 population: 44,026

36 / 58
Canva

#23. Shasta County

- Total small business establishments: 4,512 (24.8 per 1,000 residents)
- Share of establishments that are small: 99.9%
- 2021 population: 181,981

37 / 58
Canva

#22. El Dorado County

- Total small business establishments: 4,815 (24.9 per 1,000 residents)
- Share of establishments that are small: 99.8%
- 2021 population: 193,590

38 / 58
Canva

#21. Alameda County

- Total small business establishments: 41,348 (25.2 per 1,000 residents)
- Share of establishments that are small: 99.7%
- 2021 population: 1,643,837

39 / 58
Uladzik Kryhin // Shutterstock

#20. Santa Clara County

- Total small business establishments: 48,524 (25.7 per 1,000 residents)
- Share of establishments that are small: 99.5%
- 2021 population: 1,886,595

40 / 58
Canva

#19. Inyo County

- Total small business establishments: 490 (25.9 per 1,000 residents)
- Share of establishments that are small: 99.8%
- 2021 population: 18,927

41 / 58
Canva

#18. Ventura County

- Total small business establishments: 22,132 (26.4 per 1,000 residents)
- Share of establishments that are small: 99.9%
- 2021 population: 839,358

42 / 58
Canva

#17. Mendocino County

- Total small business establishments: 2,434 (26.8 per 1,000 residents)
- Share of establishments that are small: 99.9%
- 2021 population: 91,003

43 / 58
Canva

#16. Santa Cruz County

- Total small business establishments: 7,073 (27.2 per 1,000 residents)
- Share of establishments that are small: 99.9%
- 2021 population: 260,495

44 / 58
Canva

#15. San Diego County

- Total small business establishments: 90,078 (27.5 per 1,000 residents)
- Share of establishments that are small: 99.8%
- 2021 population: 3,274,954

45 / 58
Canva

#14. Santa Barbara County

- Total small business establishments: 12,102 (27.7 per 1,000 residents)
- Share of establishments that are small: 99.9%
- 2021 population: 437,434

46 / 58
Canva

#13. Placer County

- Total small business establishments: 11,666 (28.3 per 1,000 residents)
- Share of establishments that are small: 99.8%
- 2021 population: 412,789

47 / 58
Canva

#12. San Mateo County

- Total small business establishments: 21,327 (28.9 per 1,000 residents)
- Share of establishments that are small: 99.6%
- 2021 population: 739,060

48 / 58
Canva

#11. Sonoma County

- Total small business establishments: 14,383 (29.7 per 1,000 residents)
- Share of establishments that are small: 99.9%
- 2021 population: 484,315

49 / 58
Canva

#10. Los Angeles County

- Total small business establishments: 296,746 (30.2 per 1,000 residents)
- Share of establishments that are small: 99.8%
- 2021 population: 9,811,842

50 / 58
Canva

#9. Plumas County

- Total small business establishments: 614 (30.8 per 1,000 residents)
- Share of establishments that are small: 99.8%
- 2021 population: 19,940

51 / 58
Canva

#8. Nevada County

- Total small business establishments: 3,224 (31.2 per 1,000 residents)
- Share of establishments that are small: 99.8%
- 2021 population: 103,457

52 / 58
Canva

#7. San Luis Obispo County

- Total small business establishments: 8,716 (31.2 per 1,000 residents)
- Share of establishments that are small: 99.9%
- 2021 population: 279,298

53 / 58
Canva

#6. Napa County

- Total small business establishments: 4,400 (32.3 per 1,000 residents)
- Share of establishments that are small: 99.9%
- 2021 population: 136,206

54 / 58
Canva

#5. Orange County

- Total small business establishments: 103,620 (32.8 per 1,000 residents)
- Share of establishments that are small: 99.8%
- 2021 population: 3,161,005

55 / 58
Canva

#4. Alpine County

- Total small business establishments: 44 (35.6 per 1,000 residents)
- Share of establishments that are small: 93.6%
- 2021 population: 1,235

56 / 58
Canva

#3. Marin County

- Total small business establishments: 9,991 (38.6 per 1,000 residents)
- Share of establishments that are small: 99.9%
- 2021 population: 259,162

57 / 58
Canva

#2. San Francisco

- Total small business establishments: 33,937 (41.8 per 1,000 residents)
- Share of establishments that are small: 99.5%
- 2021 population: 811,253

58 / 58
Canva

#1. Mono County

- Total small business establishments: 658 (49.6 per 1,000 residents)
- Share of establishments that are small: 99.4%
- 2021 population: 13,261

Trending Now