Places with the fastest growing home prices in Contra Costa County, CA

Written by:
November 17, 2022
ungvar // Shutterstock

Places with the fastest growing home prices in Contra Costa County, CA

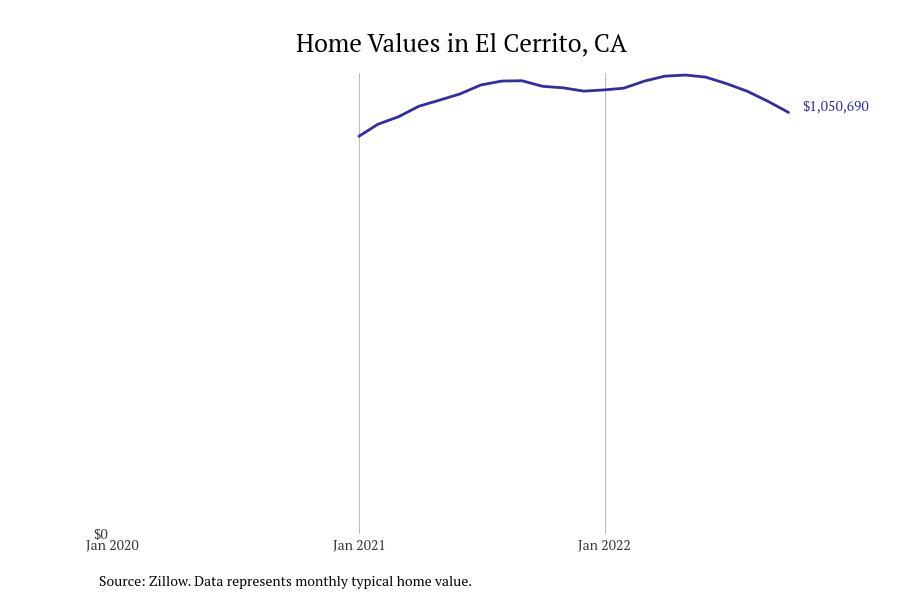
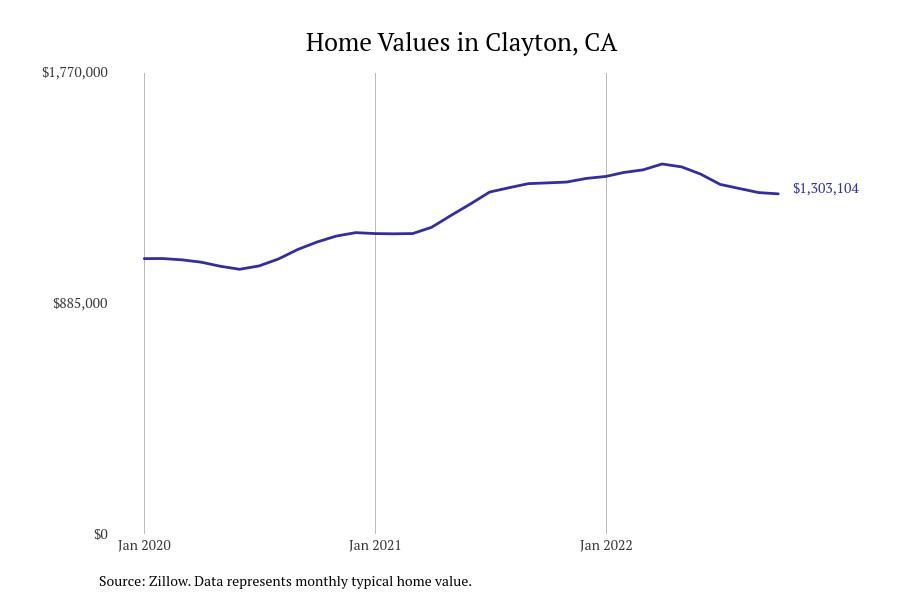
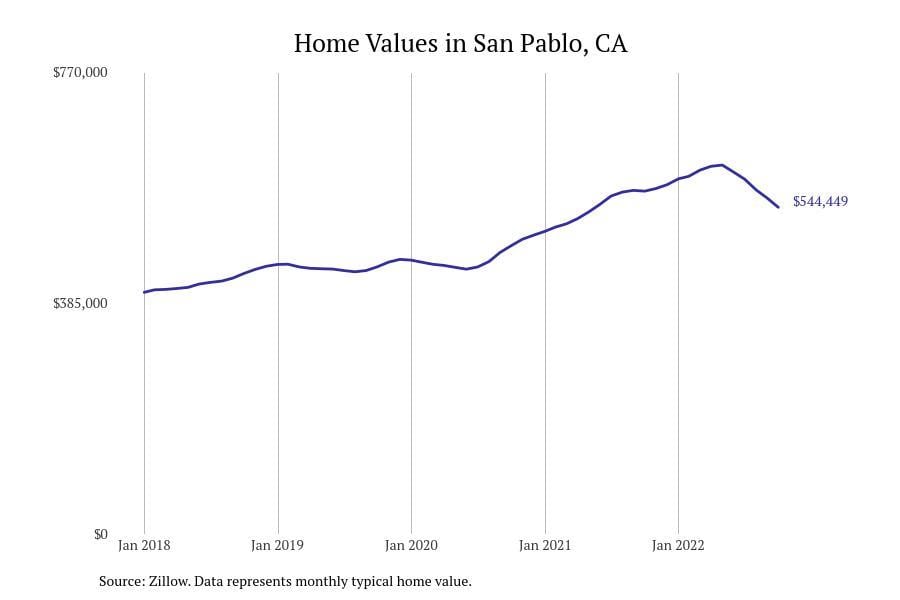
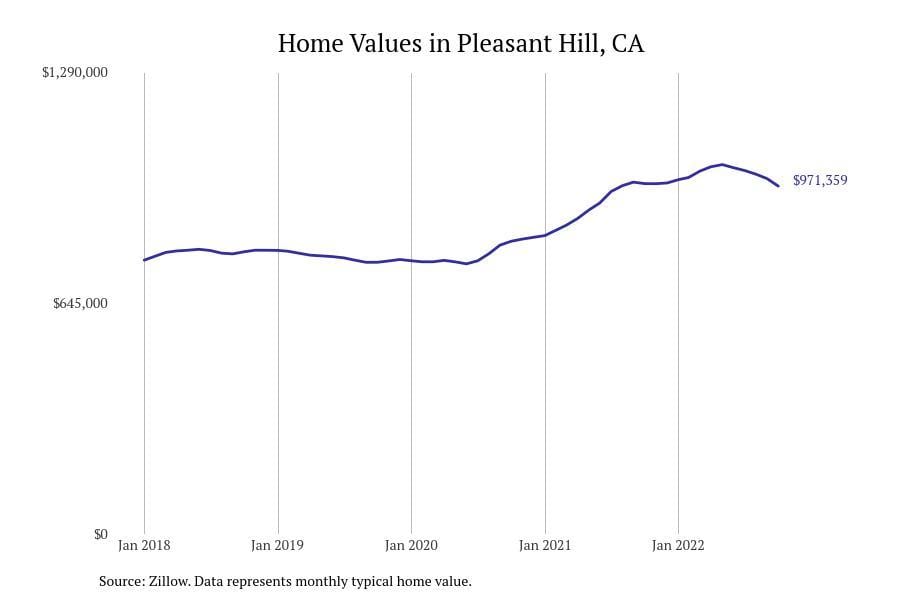
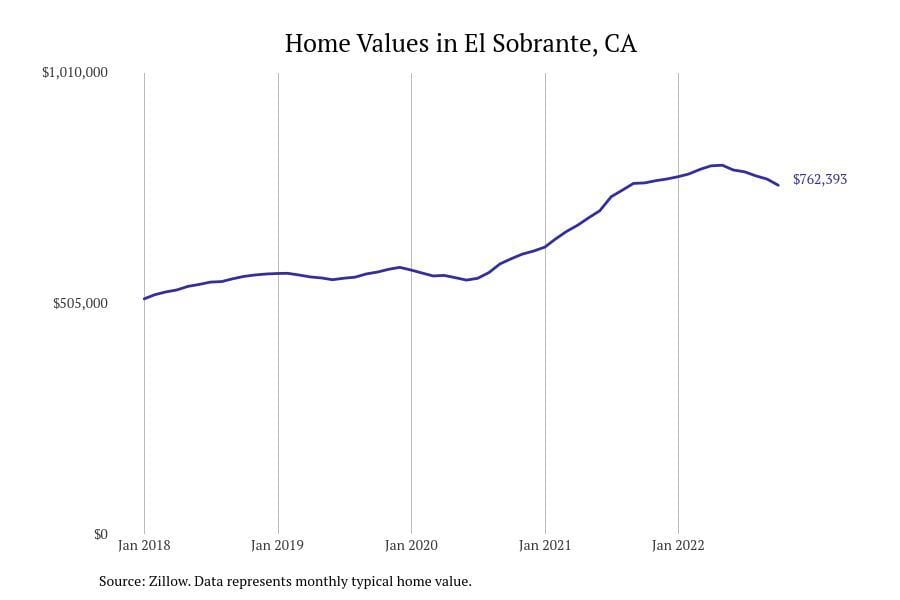
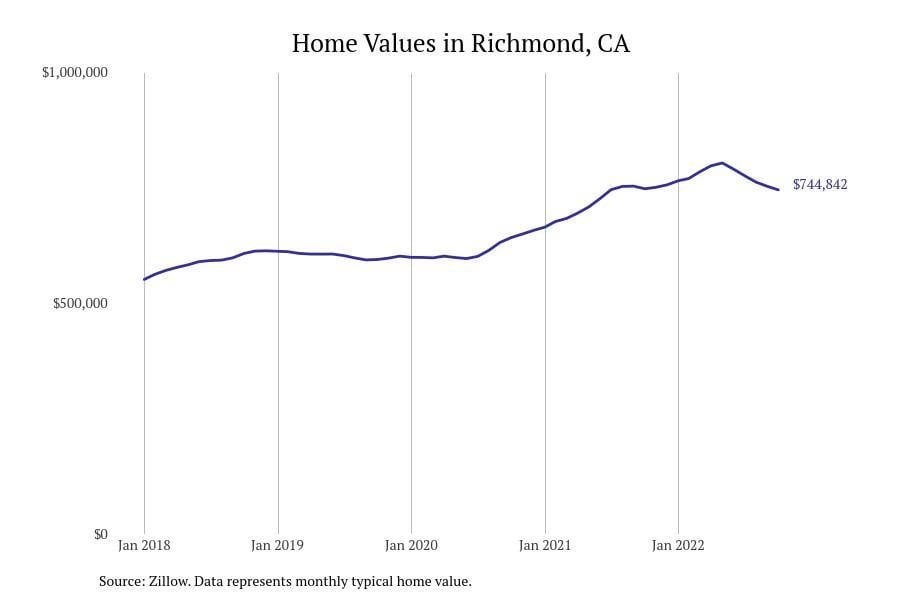
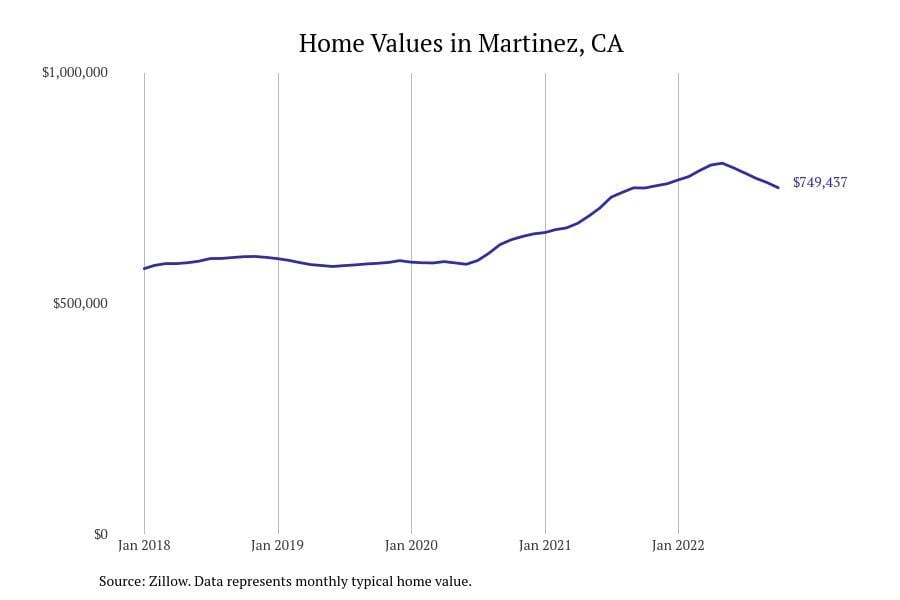
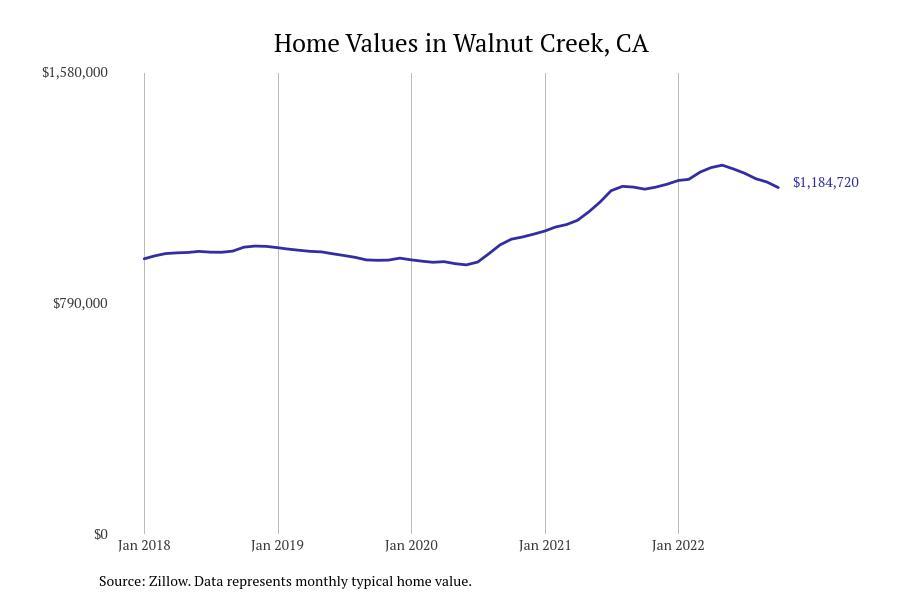
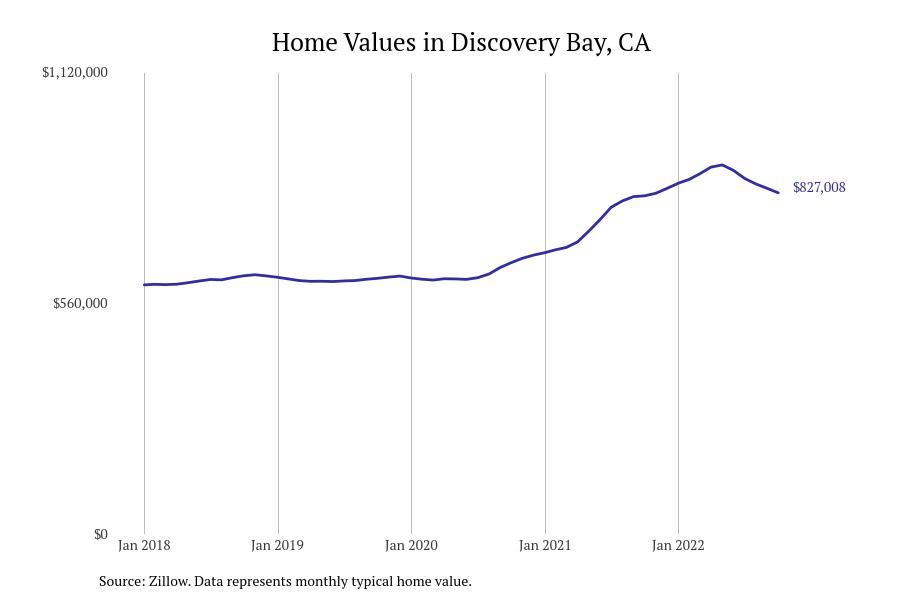
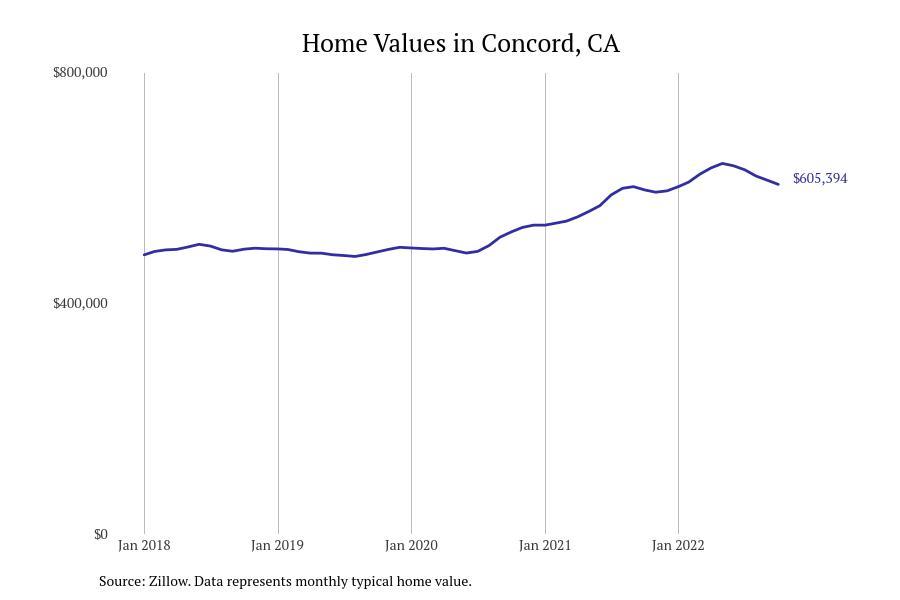
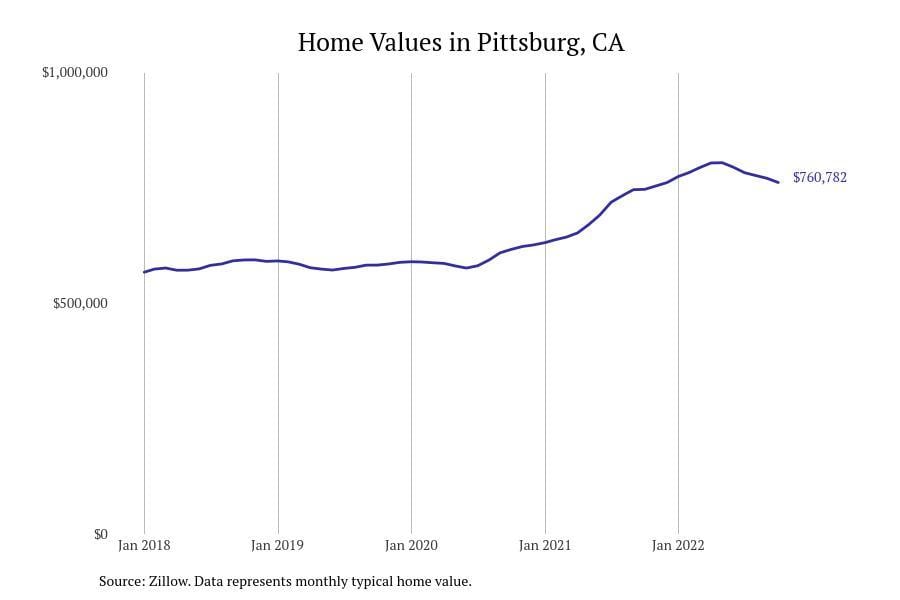
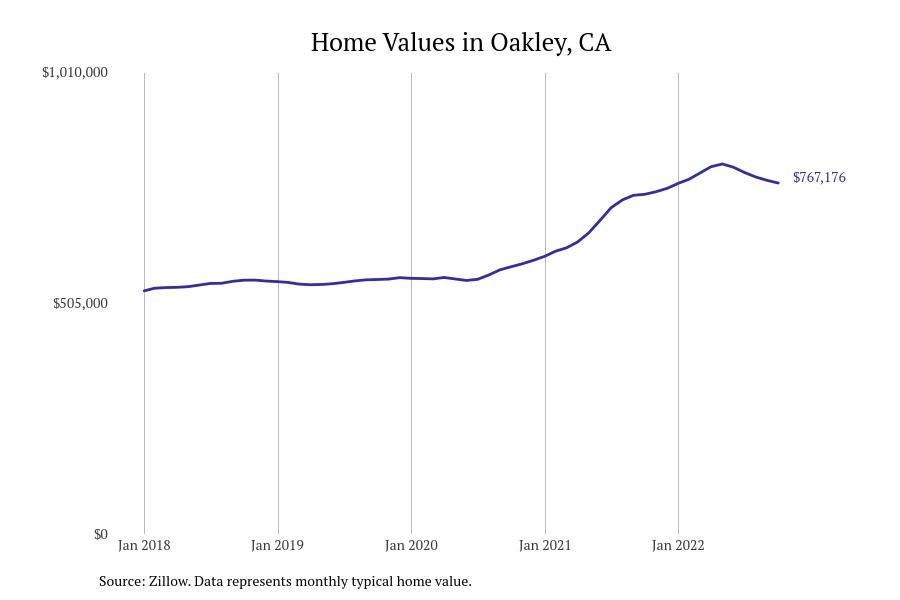
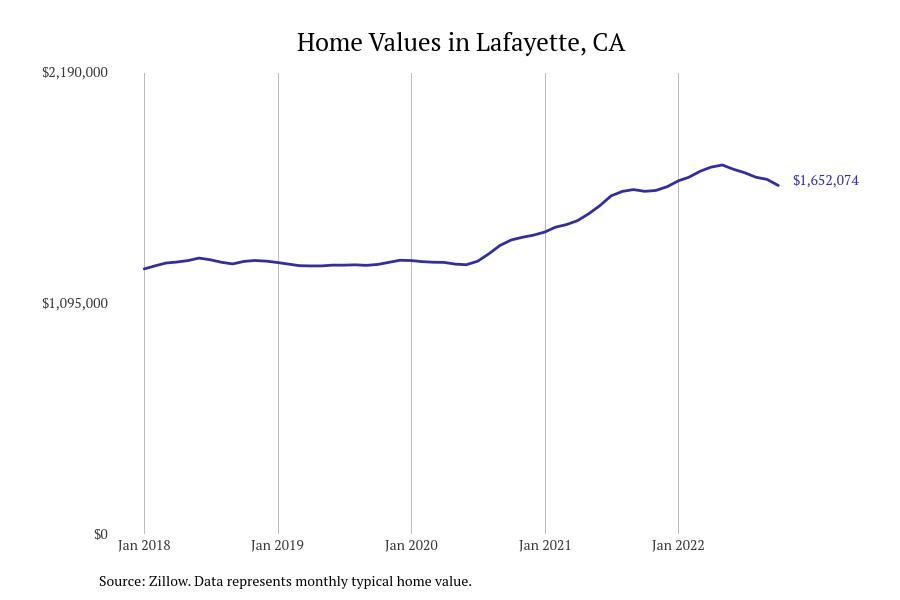
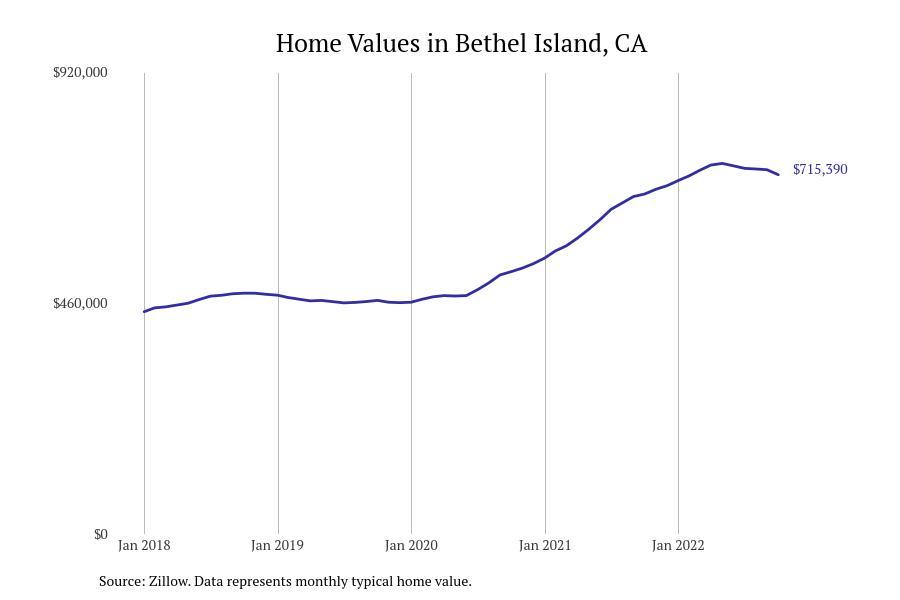
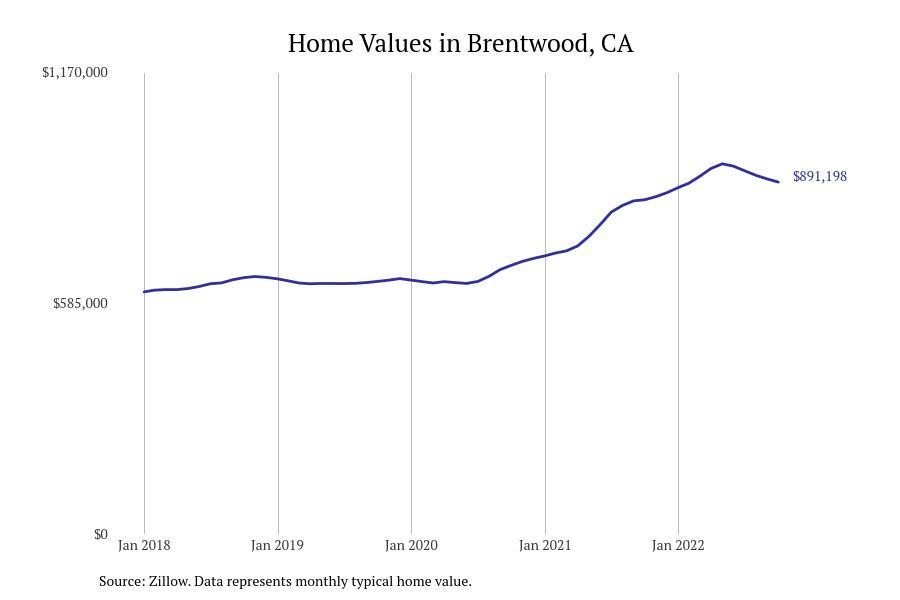
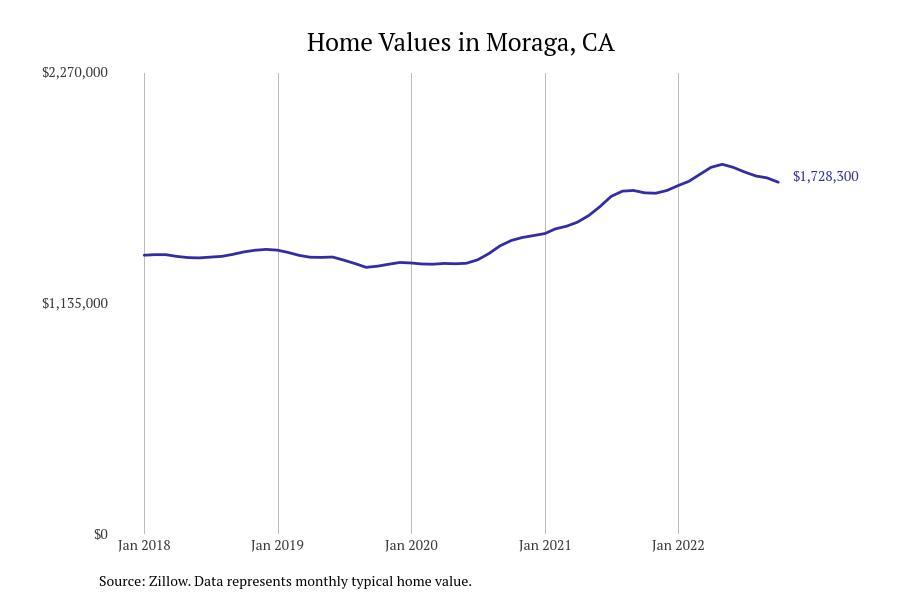
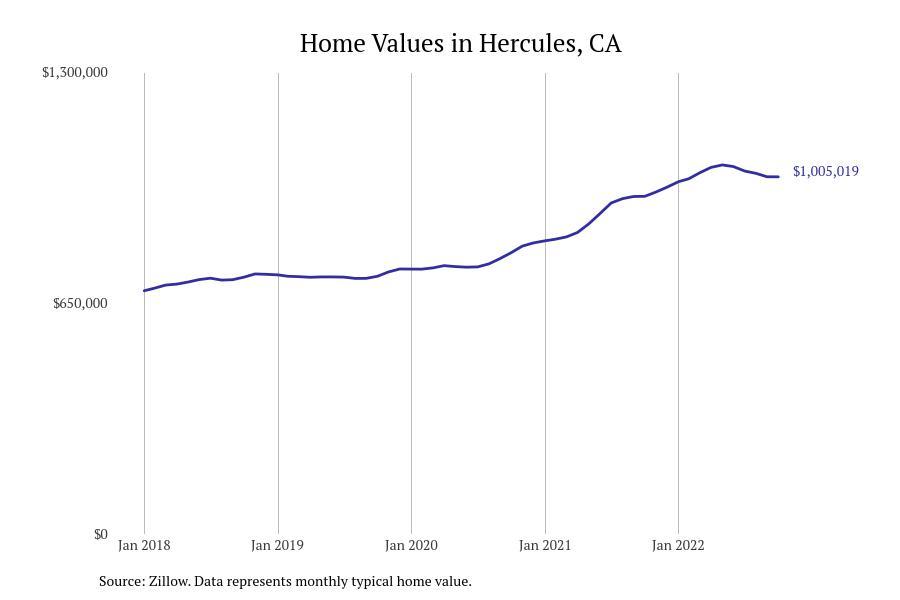
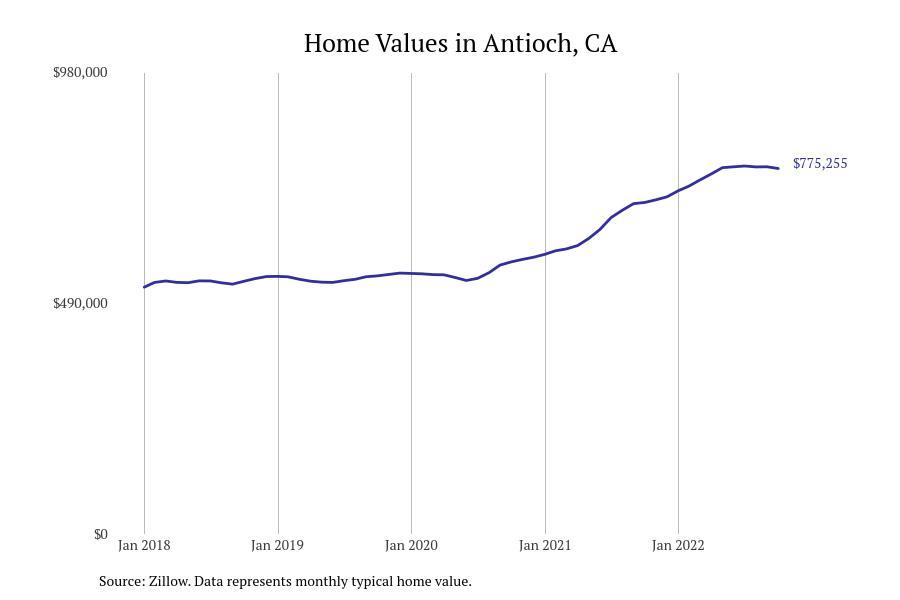
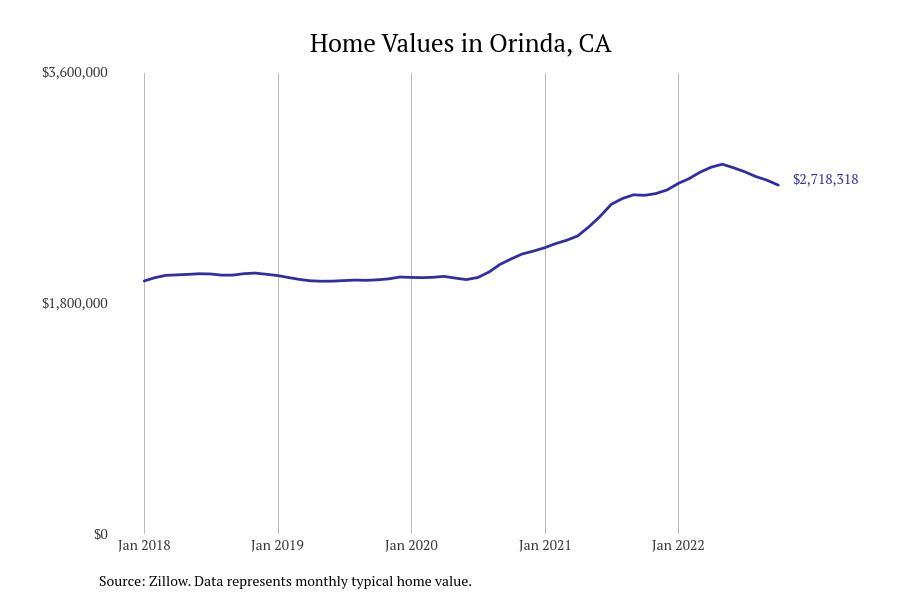
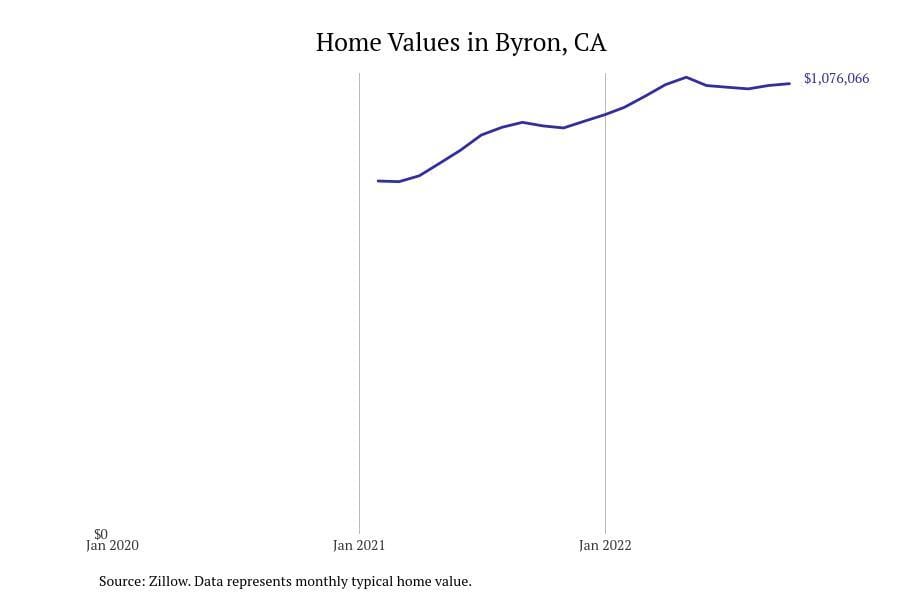
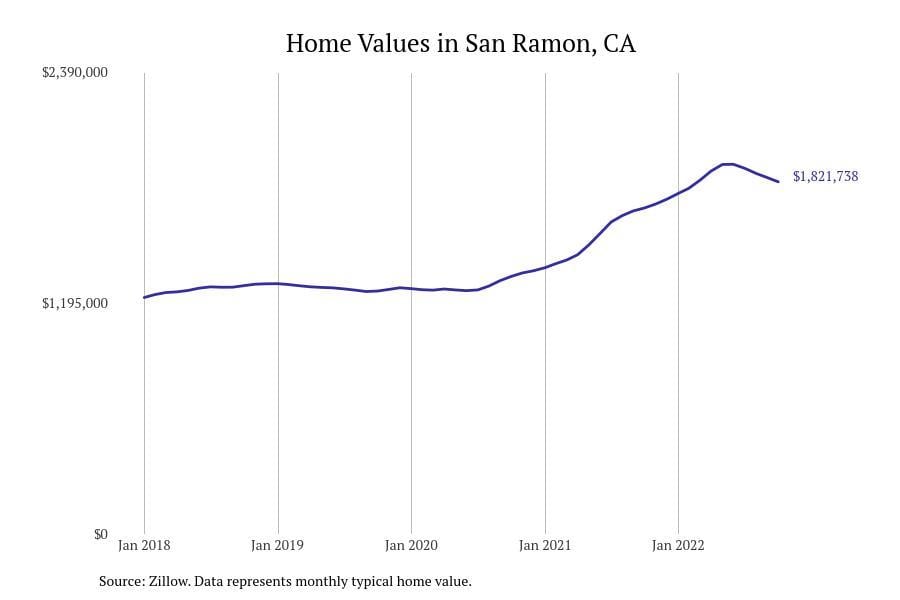
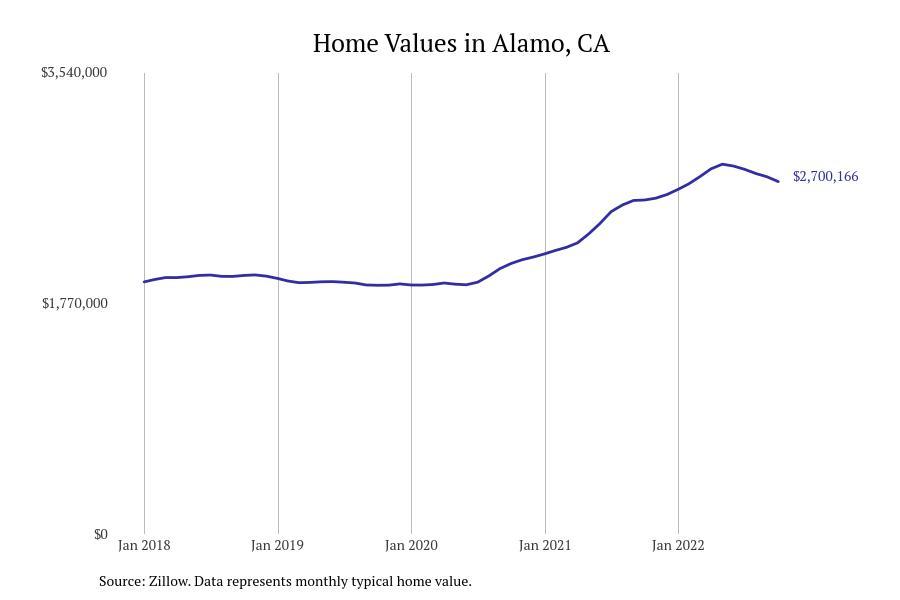
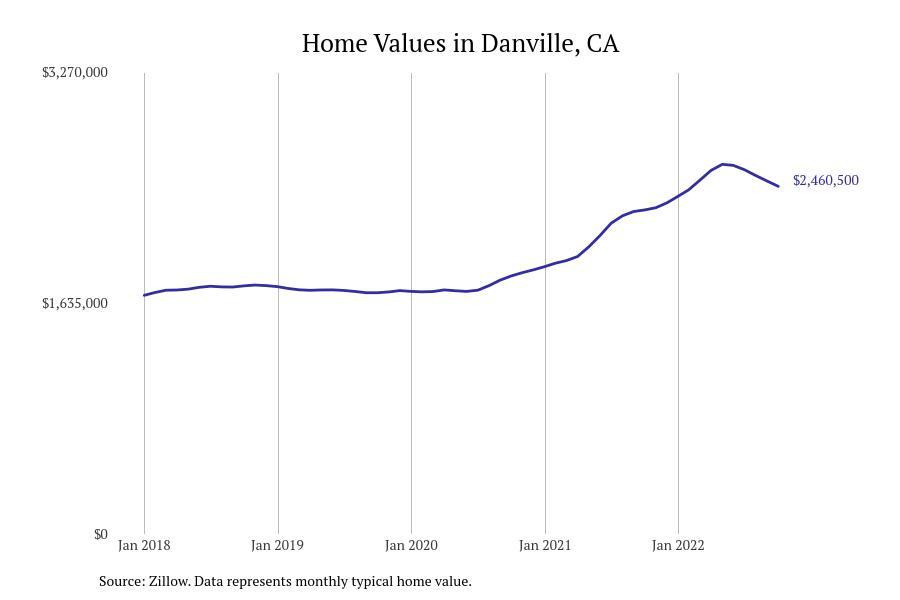
Stacker compiled a list of places with the fastest growing home prices in Contra Costa County, CA using data from Zillow. Places are ranked by the dollar change Zillow Home Values Index for all homes from October 2021 to October 2022. The ZVHI represents a seasonally adjusted price for the middle market for all homes. All 23 cities and towns with data available were included in the list. Charts for each place show the monthly typical home value since January 2018.

1 / 23
Stacker

#23. El Cerrito, CA

- 1-year price change: -5.8% (-$64,943)
- 5-year price change: data not available
- Typical home value: $1,050,690

2 / 23
Stacker

#22. Clayton, CA

- 1-year price change: -3.1% (-$42,099)
- 5-year price change: data not available
- Typical home value: $1,303,104

3 / 23
Stacker

#21. San Pablo, CA

- 1-year price change: -4.7% (-$26,970)
- 5-year price change: +37.9%
- Typical home value: $544,449

4 / 23
Stacker

#20. Pleasant Hill, CA

- 1-year price change: -0.7% (-$6,938)
- 5-year price change: +30.7%
- Typical home value: $971,359

5 / 23
Stacker

#19. El Sobrante, CA

- 1-year price change: -0.7% (-$5,169)
- 5-year price change: +49.4%
- Typical home value: $762,393

6 / 23
Stacker

#18. Richmond, CA

- 1-year price change: -0.3% (-$2,387)
- 5-year price change: +39.2%
- Typical home value: $744,842

7 / 23
Stacker

#17. Martinez, CA

- 1-year price change: +0.1% (+$541)
- 5-year price change: +33.6%
- Typical home value: $749,437

8 / 23
Stacker

#16. Walnut Creek, CA

- 1-year price change: +0.5% (+$5,436)
- 5-year price change: +28.1%
- Typical home value: $1,184,720

9 / 23
Stacker

#15. Discovery Bay, CA

- 1-year price change: +0.9% (+$7,085)
- 5-year price change: +39.3%
- Typical home value: $827,008

10 / 23
Stacker

#14. Concord, CA

- 1-year price change: +1.6% (+$9,666)
- 5-year price change: +28.1%
- Typical home value: $605,394

11 / 23
Stacker

#13. Pittsburg, CA

- 1-year price change: +2.0% (+$14,789)
- 5-year price change: +38.5%
- Typical home value: $760,782

12 / 23
Stacker

#12. Oakley, CA

- 1-year price change: +3.3% (+$24,544)
- 5-year price change: +47.7%
- Typical home value: $767,176

13 / 23
Stacker

#11. Lafayette, CA

- 1-year price change: +1.7% (+$27,727)
- 5-year price change: +34.2%
- Typical home value: $1,652,074

14 / 23
Stacker

#10. Bethel Island, CA

- 1-year price change: +5.7% (+$38,262)
- 5-year price change: +65.3%
- Typical home value: $715,390

15 / 23
Stacker

#9. Brentwood, CA

- 1-year price change: +5.3% (+$44,697)
- 5-year price change: +47.9%
- Typical home value: $891,198

16 / 23
Stacker

#8. Moraga, CA

- 1-year price change: +3.1% (+$52,143)
- 5-year price change: +28.9%
- Typical home value: $1,728,300

17 / 23
Stacker

#7. Hercules, CA

- 1-year price change: +5.8% (+$54,841)
- 5-year price change: +51.9%
- Typical home value: $1,005,019

18 / 23
Stacker

#6. Antioch, CA

- 1-year price change: +10.2% (+$71,980)
- 5-year price change: +53.5%
- Typical home value: $775,255

19 / 23
Stacker

#5. Orinda, CA

- 1-year price change: +3.0% (+$79,058)
- 5-year price change: +41.1%
- Typical home value: $2,718,318

20 / 23
Stacker

#4. Byron, CA

- 1-year price change: +10.4% (+$101,011)
- 5-year price change: data not available
- Typical home value: $1,076,066

21 / 23
Stacker

#3. San Ramon, CA

- 1-year price change: +8.0% (+$134,654)
- 5-year price change: +53.8%
- Typical home value: $1,821,738

22 / 23
Stacker

#2. Alamo, CA

- 1-year price change: +5.5% (+$140,848)
- 5-year price change: +42.4%
- Typical home value: $2,700,166

23 / 23
Stacker

#1. Danville, CA

- 1-year price change: +7.3% (+$166,639)
- 5-year price change: +49.0%
- Typical home value: $2,460,500

Trending Now