Counties with the most bridges in dire need of repair in California
One in three U.S. bridges is in need of repair or replacement, according to data from the American Road & Transportation Builders Association, including 29% of interstate bridges. The cost to make these repairs is estimated to be in excess of $54 billion.
Stacker investigated which counties in California have the most bridges in dire need of repair using data from the Federal Highway Administration. The data is accurate as of June 15, 2022. Counties are ranked by percent of bridges in "poor" condition and ties are broken by percent square meters of bridges in poor condition. Counties that have no bridges or have no bridges in poor condition are excluded from the list.
- Bridges in poor condition: 9.1% (3 of 33 bridges)
- Square meters of bridges in poor condition: 10.3% (617 of 5,993 square meters of bridges)
2 / 20
Canva
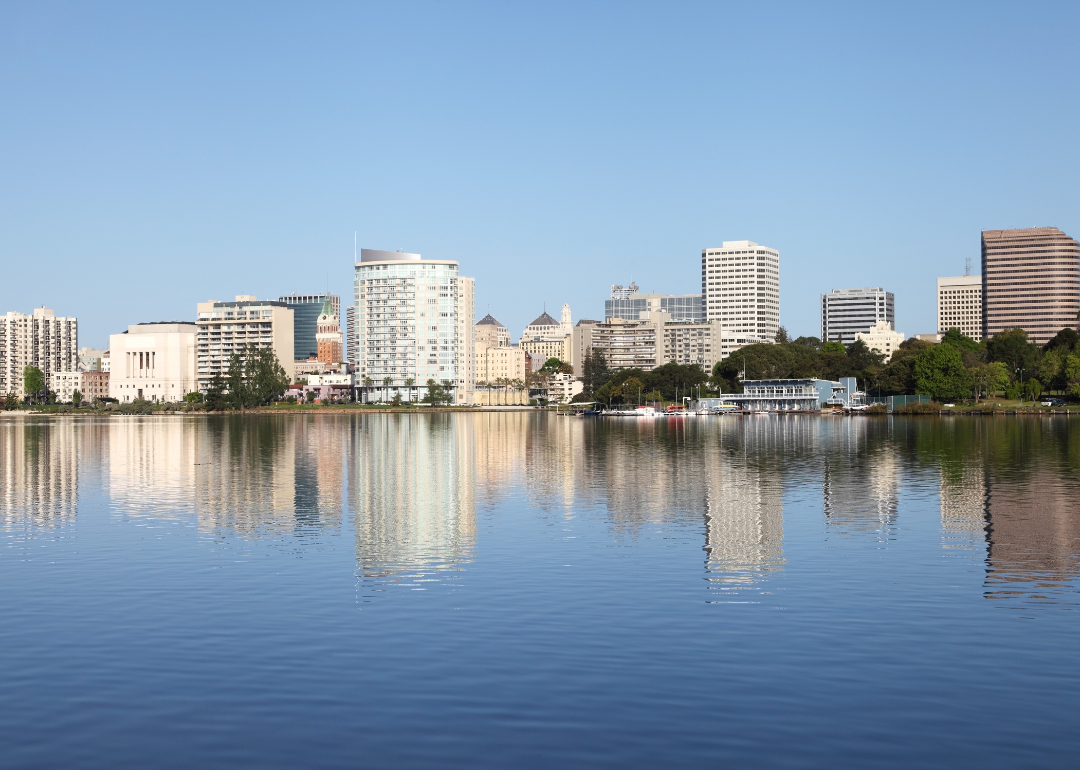
#19. Alameda County
- Bridges in poor condition: 9.4% (61 of 651 bridges)
- Square meters of bridges in poor condition: 7.8% (117,075 of 1,510,028 square meters of bridges)
3 / 20
Canva
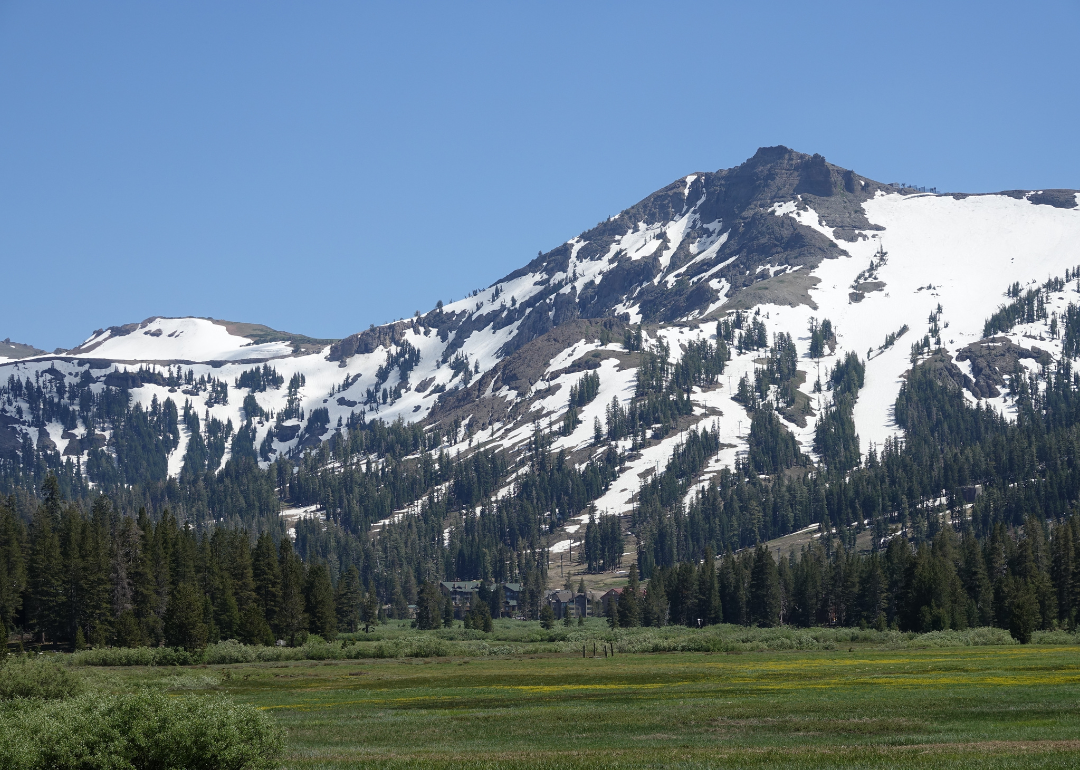
#18. Lassen County
- Bridges in poor condition: 9.4% (10 of 106 bridges)
- Square meters of bridges in poor condition: 6.4% (1,811 of 28,292 square meters of bridges)
4 / 20
Canva
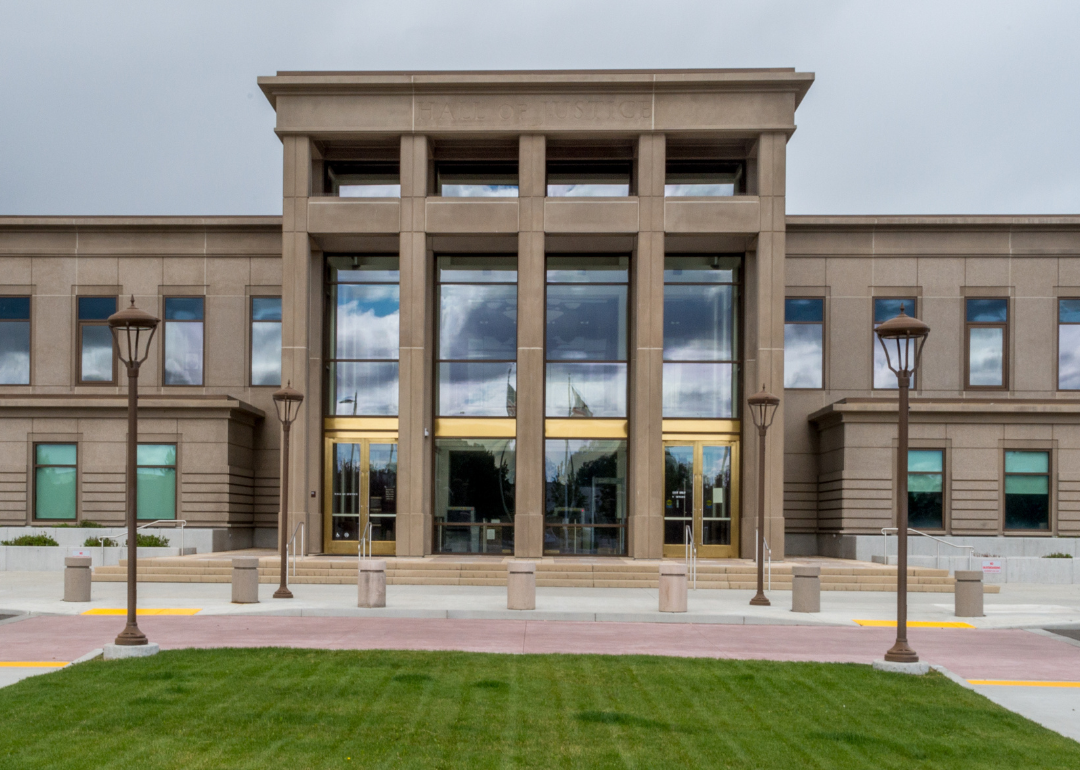
#17. San Mateo County
- Bridges in poor condition: 9.6% (35 of 363 bridges)
- Square meters of bridges in poor condition: 35.1% (343,436 of 979,074 square meters of bridges)
5 / 20
Canva
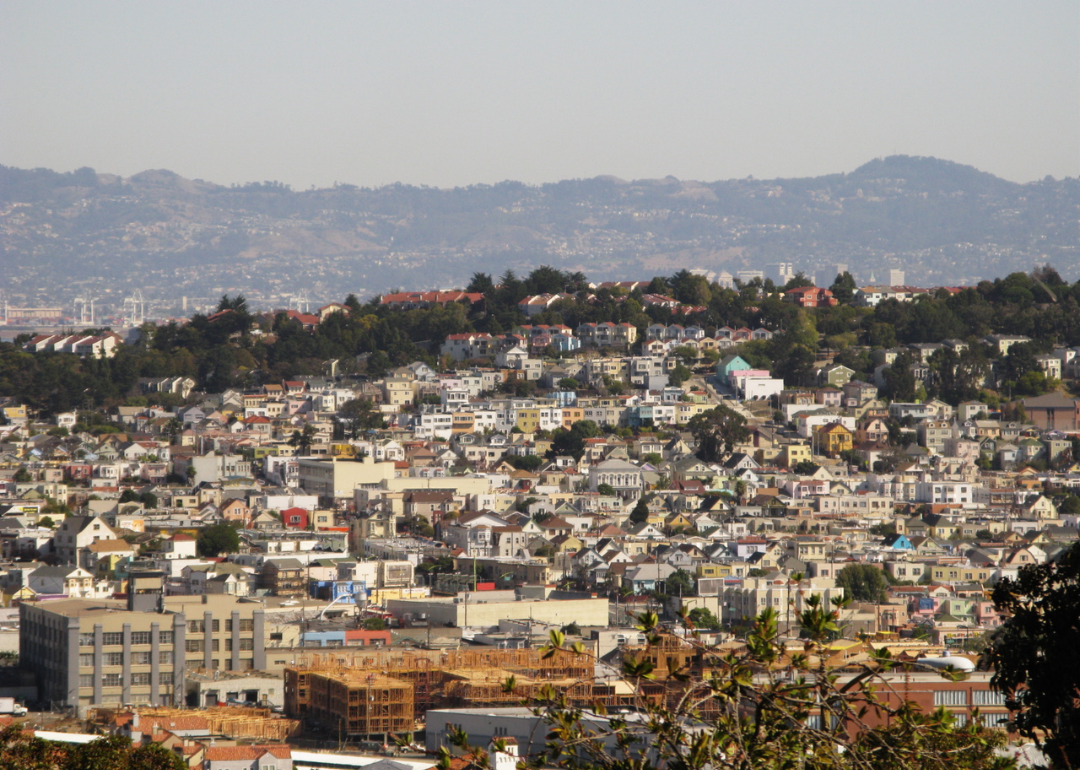
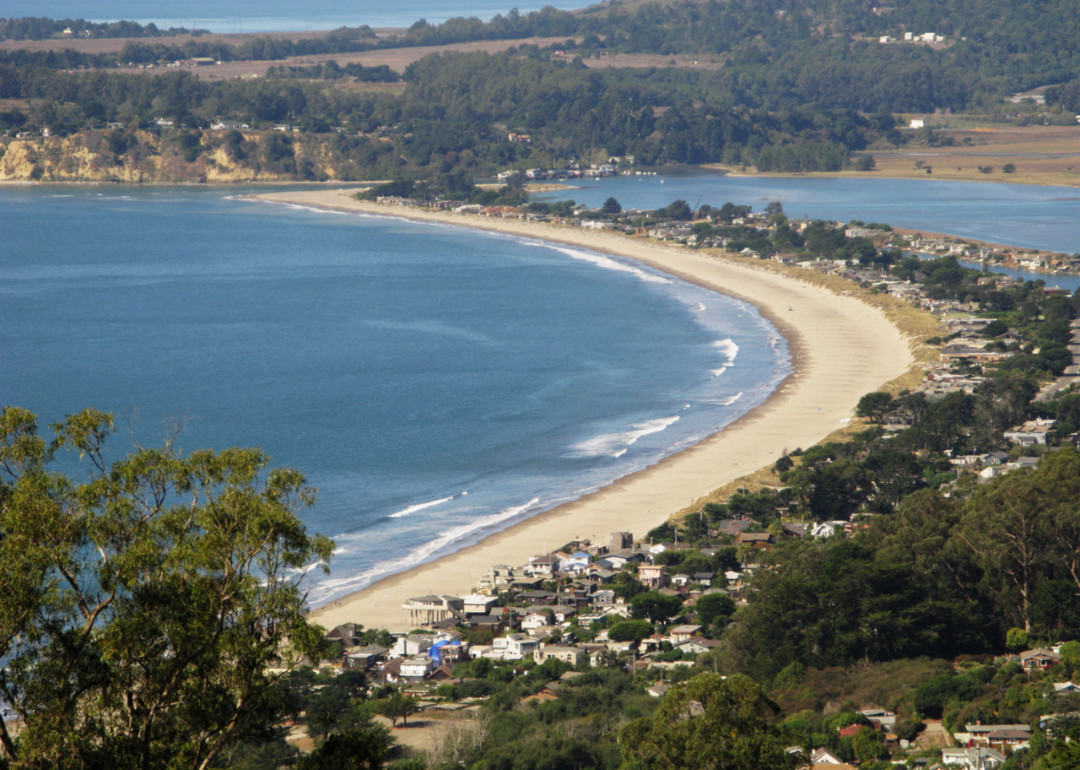
#16. Marin County
- Bridges in poor condition: 9.8% (20 of 204 bridges)
- Square meters of bridges in poor condition: 6.5% (19,523 of 302,470 square meters of bridges)
- Bridges in poor condition: 10.0% (21 of 210 bridges)
- Square meters of bridges in poor condition: 10.7% (7,568 of 70,885 square meters of bridges)
7 / 20
Canva
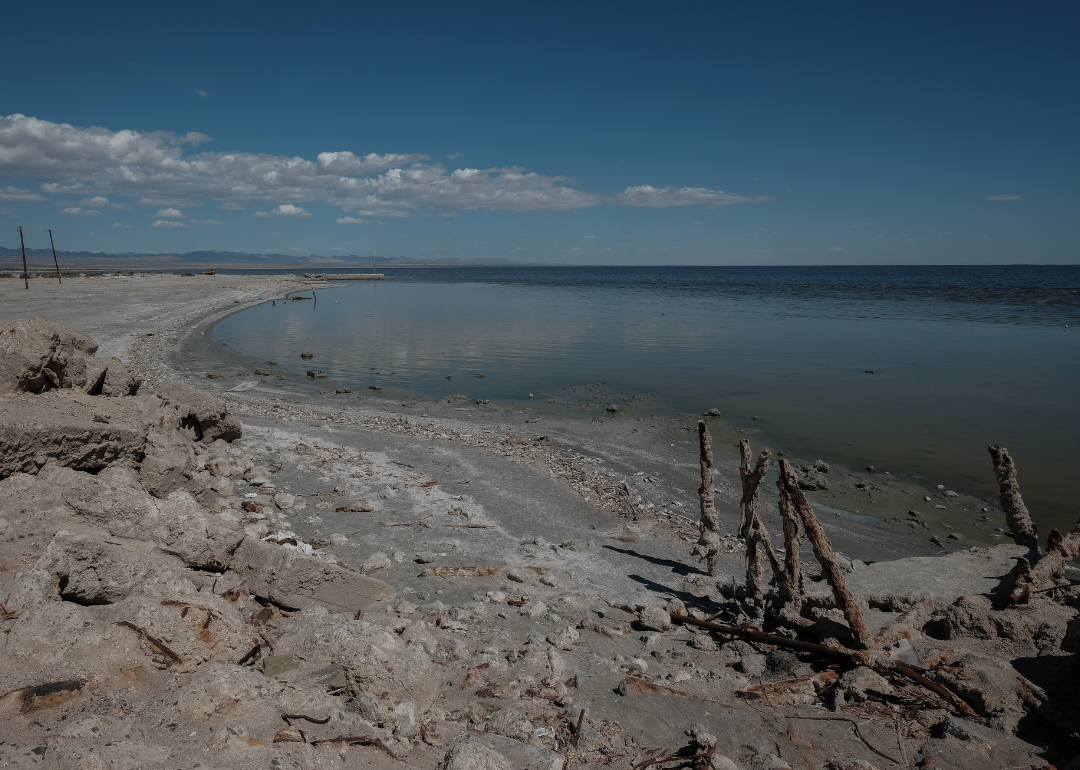
#14. Imperial County
- Bridges in poor condition: 10.2% (46 of 452 bridges)
- Square meters of bridges in poor condition: 11.5% (25,806 of 224,765 square meters of bridges)
8 / 20
Canva
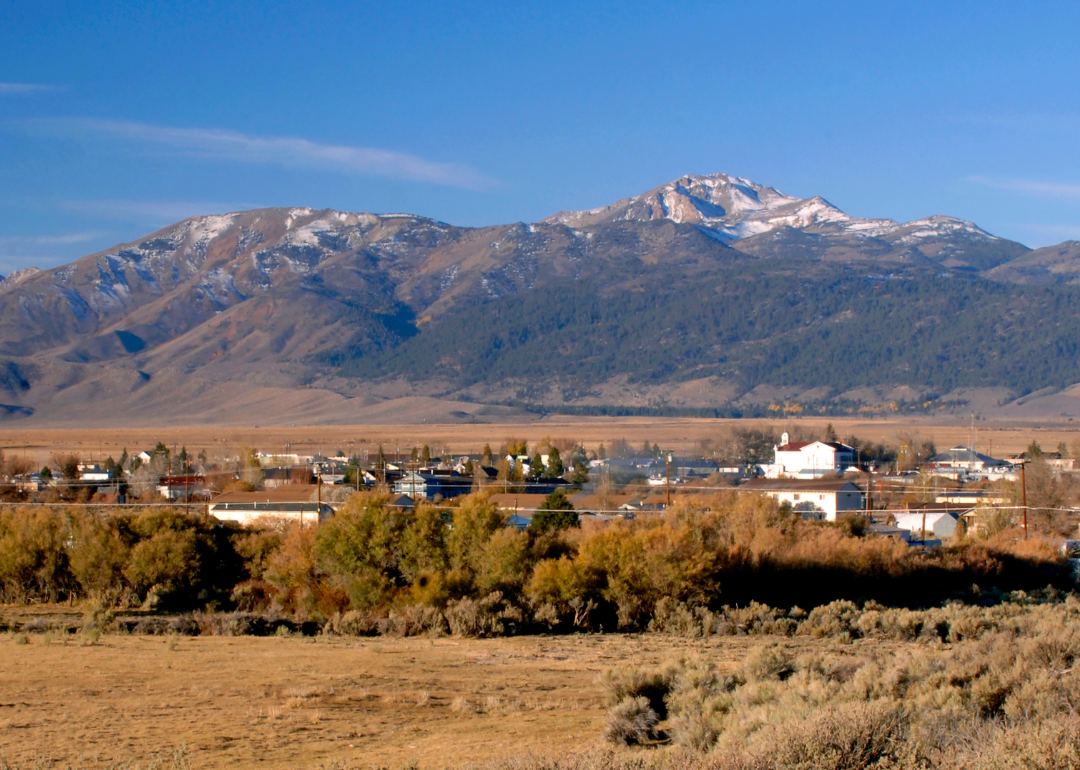
#13. Mono County
- Bridges in poor condition: 10.2% (5 of 49 bridges)
- Square meters of bridges in poor condition: 6.1% (607 of 10,003 square meters of bridges)
9 / 20
Canva
#12. San Benito County
- Bridges in poor condition: 10.7% (8 of 75 bridges)
- Square meters of bridges in poor condition: 10.6% (3,999 of 37,756 square meters of bridges)
10 / 20
Canva
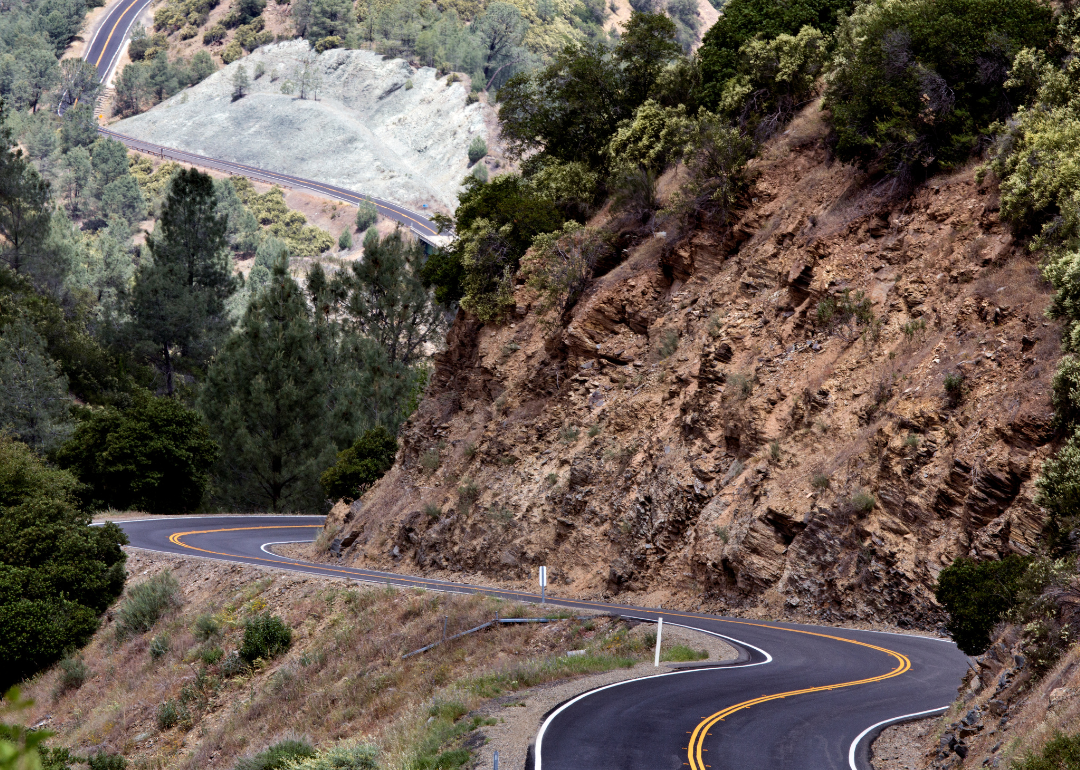
#11. Mariposa County
- Bridges in poor condition: 10.9% (12 of 110 bridges)
- Square meters of bridges in poor condition: 5.4% (1,464 of 27,258 square meters of bridges)
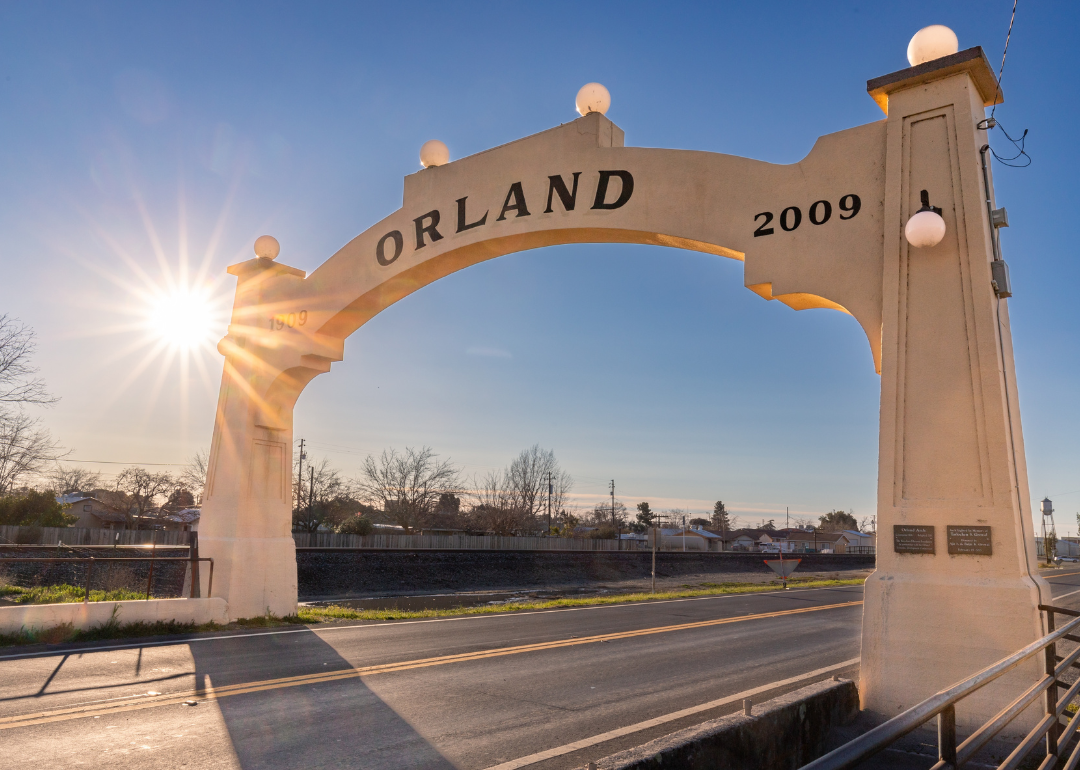
- Bridges in poor condition: 12.0% (29 of 242 bridges)
- Square meters of bridges in poor condition: 24.7% (25,639 of 103,811 square meters of bridges)
12 / 20
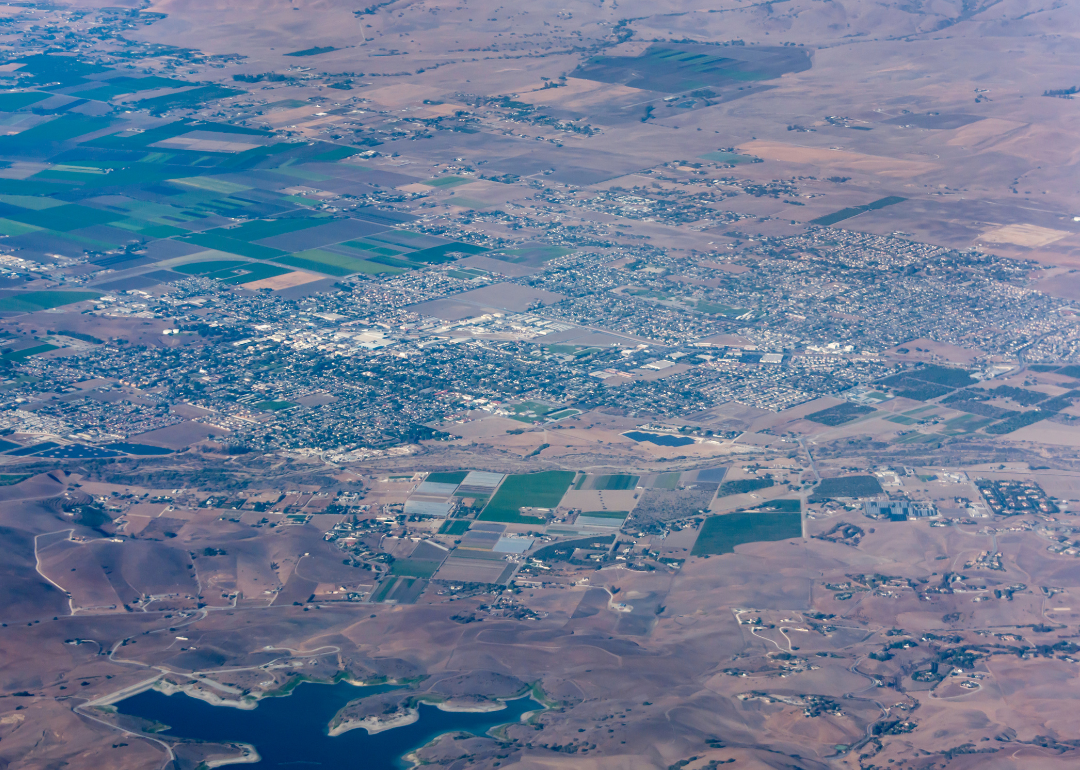
Matt Gush // Shutterstock
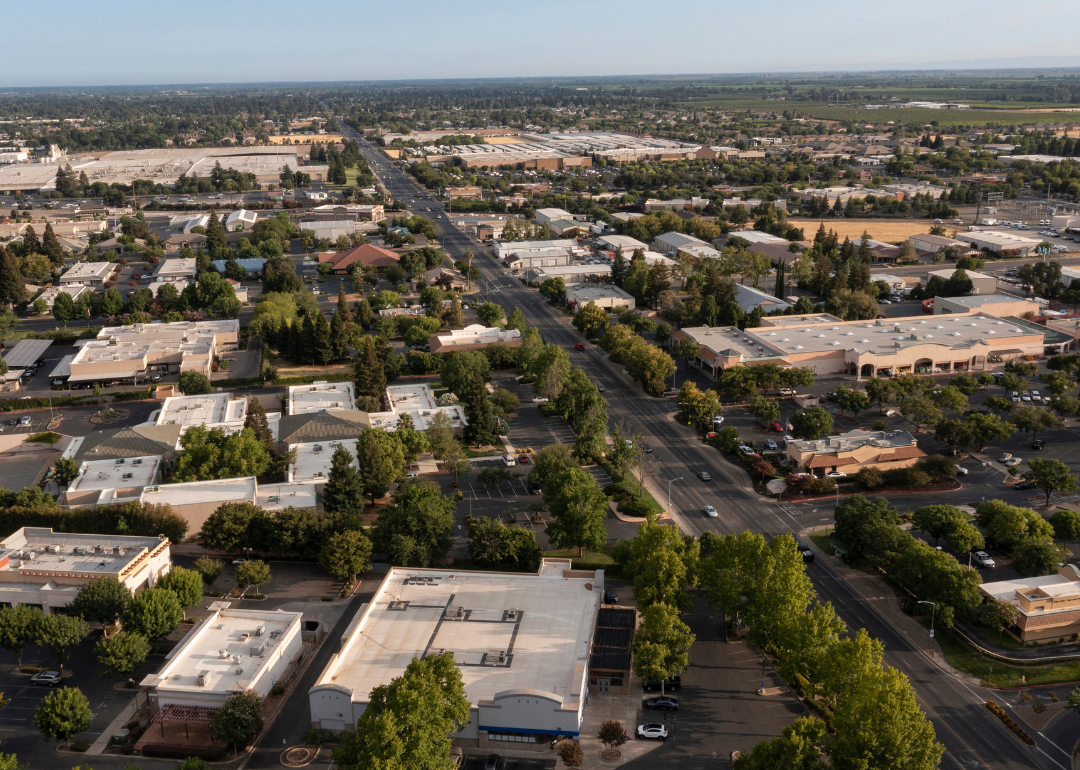
#9. Sutter County
- Bridges in poor condition: 12.3% (15 of 122 bridges)
- Square meters of bridges in poor condition: 14.0% (22,830 of 163,024 square meters of bridges)
13 / 20
Canva
#8. Nevada County
- Bridges in poor condition: 12.6% (17 of 135 bridges)
- Square meters of bridges in poor condition: 9.4% (9,923 of 105,710 square meters of bridges)
14 / 20
Canva
#7. Del Norte County
- Bridges in poor condition: 12.6% (12 of 95 bridges)
- Square meters of bridges in poor condition: 2.6% (1,614 of 60,936 square meters of bridges)
15 / 20
Canva
#6. Sierra County
- Bridges in poor condition: 13.1% (8 of 61 bridges)
- Square meters of bridges in poor condition: 6.6% (838 of 12,678 square meters of bridges)
- Bridges in poor condition: 13.4% (86 of 643 bridges)
- Square meters of bridges in poor condition: 14.8% (100,907 of 684,051 square meters of bridges)
17 / 20
Canva
#4. Madera County
- Bridges in poor condition: 14.0% (34 of 243 bridges)
- Square meters of bridges in poor condition: 8.8% (14,481 of 165,016 square meters of bridges)
18 / 20
Canva
#3. Stanislaus County
- Bridges in poor condition: 15.0% (57 of 380 bridges)
- Square meters of bridges in poor condition: 18.5% (45,713 of 247,413 square meters of bridges)
19 / 20
Canva
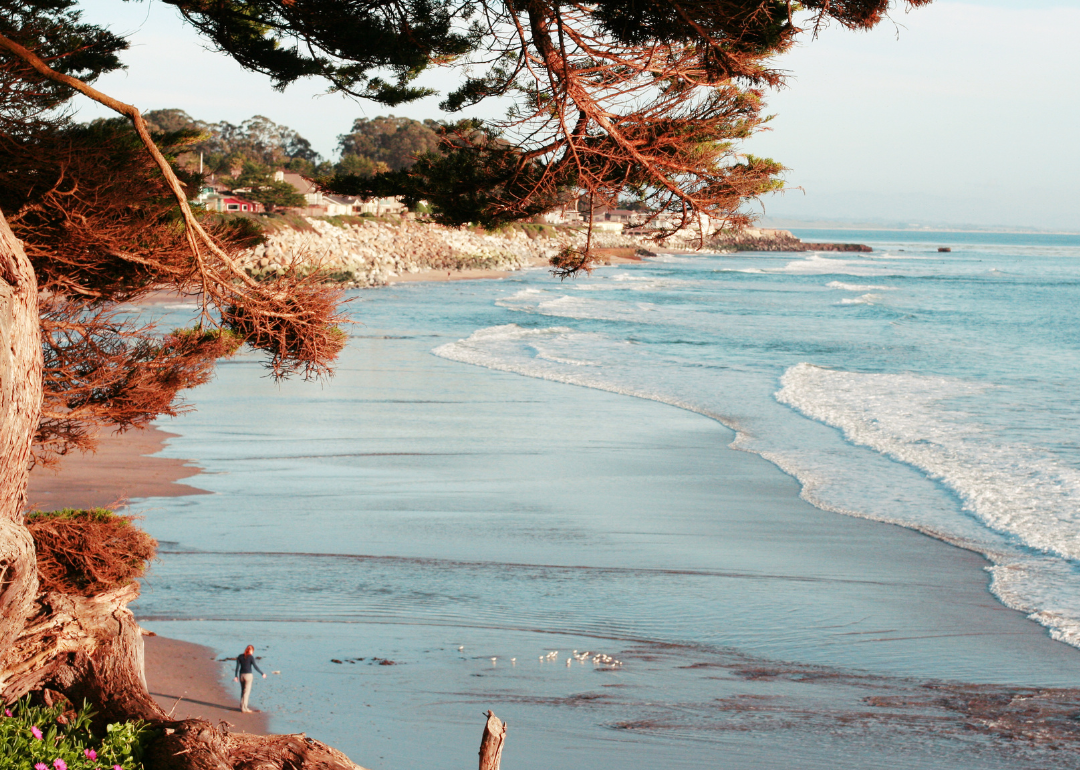
#2. Santa Cruz County
- Bridges in poor condition: 16.6% (32 of 193 bridges)
- Square meters of bridges in poor condition: 9.4% (10,846 of 115,316 square meters of bridges)
20 / 20
Canva
#1. Amador County
- Bridges in poor condition: 23.0% (14 of 61 bridges)
- Square meters of bridges in poor condition: 15.4% (3,847 of 24,985 square meters of bridges)