Counties with the most super commuters in Colorado
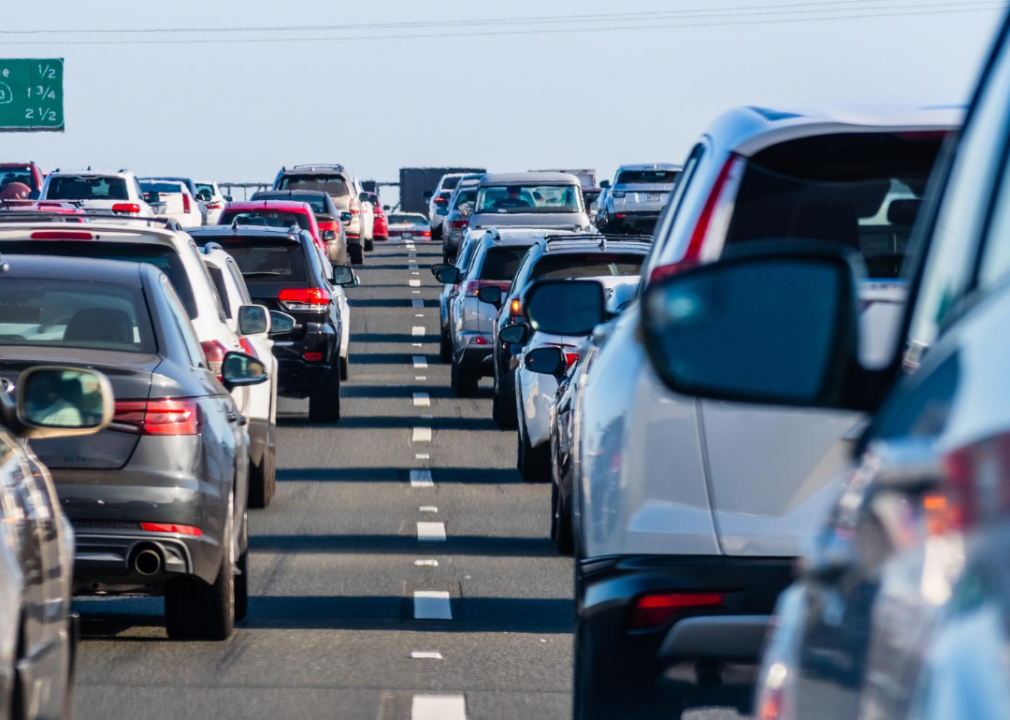
There are more than 283 million vehicles on the road in the United States, and many of those cars, trucks, vans, and motorcycles are used to ferry people to and from their homes and jobs during their daily commutes. A small but growing number of people are walking and biking to work, particularly in compact college towns. Many more take public transportation, especially in major cities like New York, Chicago, San Francisco, Washington D.C., Boston, and Seattle—but nationwide, public transit accounts for only about 5% of daily commutes.
The overwhelming majority of people still drive to and from work every day, and the vast majority of those car commuters drive alone—fewer than 10% of Americans carpool. According to the U.S. Census Bureau, the average one-way commute in the United States has grown to a record 26.9 minutes. That's just shy of an hour a day that average Americans squander behind the wheel, not at home with their families, and instead, burning gas and putting miles on their cars.
For some Americans, however, the commute to work is far from average. A phenomenon known as super commuting has emerged and grown in recent years. Super commuters spend 90 minutes or more—each way—chasing their paychecks every day. The biggest percentage of super commuters work in the extraction industry, with workers pursuing lucrative jobs in remote mines, oil fields, and other energy operations. Many more, however, have been priced out of expensive housing in urban metro areas where high-paying jobs are located, far away from their less-expensive county of residence.
Stacker compiled a list of counties with the most super commuters in Colorado using data from the U.S. Census Bureau. Counties are ranked by the highest percent of workers with a commute over 90 minutes, based on 2020 5-year estimates. Keep reading to see where in your state people are spending the most time going to and from work every day.
#50. Gunnison County
--- 60+ minute commute: 2.3%
- Average commute time: 15.4 minutes
--- 10.4 minutes shorter than state average
- Left for work from 12 a.m. to 6 a.m.: 8.4%
- Worked outside county of residence: 4.9%
- Means of transportation: drove alone (58.0%), carpooled (12.5%), walked to work (15.2%), public transportation (5.3%), worked from home (5.7%)
#49. Phillips County
--- 60+ minute commute: 3.0%
- Average commute time: 16.3 minutes
--- 9.5 minutes shorter than state average
- Left for work from 12 a.m. to 6 a.m.: 20.9%
- Worked outside county of residence: 19.4%
- Means of transportation: drove alone (71.9%), carpooled (17.5%), walked to work (5.0%), public transportation (0.0%), worked from home (5.2%)
#48. Boulder County
--- 60+ minute commute: 6.2%
- Average commute time: 23.5 minutes
--- 2.3 minutes shorter than state average
- Left for work from 12 a.m. to 6 a.m.: 7.8%
- Worked outside county of residence: 18.7%
- Means of transportation: drove alone (62.7%), carpooled (7.0%), walked to work (4.6%), public transportation (4.8%), worked from home (16.1%)
#47. Moffat County
--- 60+ minute commute: 15.6%
- Average commute time: 25.2 minutes
--- 0.6 minutes shorter than state average
- Left for work from 12 a.m. to 6 a.m.: 18.4%
- Worked outside county of residence: 35.6%
- Means of transportation: drove alone (72.7%), carpooled (21.4%), walked to work (1.6%), public transportation (0.5%), worked from home (3.2%)
#46. Conejos County
--- 60+ minute commute: 2.2%
- Average commute time: 24.4 minutes
--- 1.4 minutes shorter than state average
- Left for work from 12 a.m. to 6 a.m.: 8.8%
- Worked outside county of residence: 41.3%
- Means of transportation: drove alone (68.0%), carpooled (17.5%), walked to work (2.0%), public transportation (0.0%), worked from home (11.4%)
#45. Denver
--- 60+ minute commute: 5.3%
- Average commute time: 25.7 minutes
--- 0.1 minutes shorter than state average
- Left for work from 12 a.m. to 6 a.m.: 10.3%
- Worked outside county of residence: 34.4%
- Means of transportation: drove alone (66.1%), carpooled (7.3%), walked to work (4.7%), public transportation (6.2%), worked from home (12.4%)
#44. Summit County
--- 60+ minute commute: 4.8%
- Average commute time: 18.5 minutes
--- 7.3 minutes shorter than state average
- Left for work from 12 a.m. to 6 a.m.: 10.7%
- Worked outside county of residence: 4.0%
- Means of transportation: drove alone (66.6%), carpooled (5.5%), walked to work (6.2%), public transportation (7.6%), worked from home (12.6%)
#43. Routt County
--- 60+ minute commute: 3.3%
- Average commute time: 19.2 minutes
--- 6.6 minutes shorter than state average
- Left for work from 12 a.m. to 6 a.m.: 8.3%
- Worked outside county of residence: 3.2%
- Means of transportation: drove alone (68.2%), carpooled (7.7%), walked to work (3.8%), public transportation (2.9%), worked from home (12.5%)
#42. La Plata County
--- 60+ minute commute: 4.5%
- Average commute time: 21.7 minutes
--- 4.1 minutes shorter than state average
- Left for work from 12 a.m. to 6 a.m.: 10.2%
- Worked outside county of residence: 2.2%
- Means of transportation: drove alone (71.3%), carpooled (7.2%), walked to work (5.2%), public transportation (0.8%), worked from home (11.8%)
#41. Jefferson County
--- 60+ minute commute: 7.5%
- Average commute time: 27.8 minutes
--- 2.0 minutes longer than state average
- Left for work from 12 a.m. to 6 a.m.: 12.4%
- Worked outside county of residence: 46.4%
- Means of transportation: drove alone (75.1%), carpooled (6.8%), walked to work (1.5%), public transportation (2.9%), worked from home (12.2%)
#40. Douglas County
--- 60+ minute commute: 7.5%
- Average commute time: 27.7 minutes
--- 1.9 minutes longer than state average
- Left for work from 12 a.m. to 6 a.m.: 10.7%
- Worked outside county of residence: 48.1%
- Means of transportation: drove alone (74.1%), carpooled (5.9%), walked to work (1.3%), public transportation (1.6%), worked from home (16.0%)
#39. Saguache County
--- 60+ minute commute: 4.6%
- Average commute time: 21.4 minutes
--- 4.4 minutes shorter than state average
- Left for work from 12 a.m. to 6 a.m.: 9.5%
- Worked outside county of residence: 29.8%
- Means of transportation: drove alone (65.7%), carpooled (14.8%), walked to work (4.6%), public transportation (0.4%), worked from home (13.9%)
#38. Huerfano County
--- 60+ minute commute: 7.7%
- Average commute time: 20.5 minutes
--- 5.3 minutes shorter than state average
- Left for work from 12 a.m. to 6 a.m.: 12.5%
- Worked outside county of residence: 9.3%
- Means of transportation: drove alone (69.4%), carpooled (5.8%), walked to work (5.5%), public transportation (0.2%), worked from home (17.9%)
#37. Arapahoe County
--- 60+ minute commute: 7.7%
- Average commute time: 28.2 minutes
--- 2.4 minutes longer than state average
- Left for work from 12 a.m. to 6 a.m.: 13.5%
- Worked outside county of residence: 47.5%
- Means of transportation: drove alone (74.7%), carpooled (8.7%), walked to work (1.5%), public transportation (3.6%), worked from home (10.0%)
#36. Adams County
--- 60+ minute commute: 9.5%
- Average commute time: 29.8 minutes
--- 4.0 minutes longer than state average
- Left for work from 12 a.m. to 6 a.m.: 19.1%
- Worked outside county of residence: 57.6%
- Means of transportation: drove alone (76.1%), carpooled (10.9%), walked to work (1.2%), public transportation (3.4%), worked from home (7.2%)
#35. Mesa County
--- 60+ minute commute: 4.4%
- Average commute time: 18.9 minutes
--- 6.9 minutes shorter than state average
- Left for work from 12 a.m. to 6 a.m.: 12.3%
- Worked outside county of residence: 3.8%
- Means of transportation: drove alone (77.0%), carpooled (8.3%), walked to work (3.1%), public transportation (0.5%), worked from home (8.2%)
#34. Larimer County
--- 60+ minute commute: 7.1%
- Average commute time: 23.6 minutes
--- 2.2 minutes shorter than state average
- Left for work from 12 a.m. to 6 a.m.: 12.2%
- Worked outside county of residence: 14.8%
- Means of transportation: drove alone (73.0%), carpooled (7.3%), walked to work (2.8%), public transportation (1.4%), worked from home (11.7%)
#33. Crowley County
--- 60+ minute commute: 8.4%
- Average commute time: 21.3 minutes
--- 4.5 minutes shorter than state average
- Left for work from 12 a.m. to 6 a.m.: 11.2%
- Worked outside county of residence: 50.4%
- Means of transportation: drove alone (78.2%), carpooled (10.1%), walked to work (2.8%), public transportation (0.2%), worked from home (8.4%)
#32. Kiowa County
--- 60+ minute commute: 3.1%
- Average commute time: 15 minutes
--- 10.8 minutes shorter than state average
- Left for work from 12 a.m. to 6 a.m.: 9.5%
- Worked outside county of residence: 14.4%
- Means of transportation: drove alone (80.2%), carpooled (6.5%), walked to work (5.9%), public transportation (0.0%), worked from home (3.8%)
#31. Prowers County
--- 60+ minute commute: 4.7%
- Average commute time: 16.7 minutes
--- 9.1 minutes shorter than state average
- Left for work from 12 a.m. to 6 a.m.: 17.7%
- Worked outside county of residence: 8.5%
- Means of transportation: drove alone (84.0%), carpooled (6.5%), walked to work (1.4%), public transportation (0.0%), worked from home (5.5%)
#30. Weld County
--- 60+ minute commute: 10.6%
- Average commute time: 27.9 minutes
--- 2.1 minutes longer than state average
- Left for work from 12 a.m. to 6 a.m.: 20.4%
- Worked outside county of residence: 39.1%
- Means of transportation: drove alone (78.4%), carpooled (10.4%), walked to work (2.0%), public transportation (0.4%), worked from home (7.5%)
#29. El Paso County
--- 60+ minute commute: 5.7%
- Average commute time: 23.9 minutes
--- 1.9 minutes shorter than state average
- Left for work from 12 a.m. to 6 a.m.: 13.8%
- Worked outside county of residence: 5.5%
- Means of transportation: drove alone (75.2%), carpooled (10.2%), walked to work (3.4%), public transportation (0.7%), worked from home (9.1%)
#28. Eagle County
--- 60+ minute commute: 5.4%
- Average commute time: 23.3 minutes
--- 2.5 minutes shorter than state average
- Left for work from 12 a.m. to 6 a.m.: 7.7%
- Worked outside county of residence: 15.6%
- Means of transportation: drove alone (73.7%), carpooled (5.8%), walked to work (3.1%), public transportation (3.2%), worked from home (11.8%)
#27. Park County
--- 60+ minute commute: 20.6%
- Average commute time: 37.9 minutes
--- 12.1 minutes longer than state average
- Left for work from 12 a.m. to 6 a.m.: 19.9%
- Worked outside county of residence: 56.0%
- Means of transportation: drove alone (69.5%), carpooled (11.3%), walked to work (1.3%), public transportation (0.5%), worked from home (15.4%)
#26. Montezuma County
--- 60+ minute commute: 7.2%
- Average commute time: 20.1 minutes
--- 5.7 minutes shorter than state average
- Left for work from 12 a.m. to 6 a.m.: 10.7%
- Worked outside county of residence: 7.8%
- Means of transportation: drove alone (78.9%), carpooled (8.4%), walked to work (4.2%), public transportation (0.1%), worked from home (6.6%)
#25. Pueblo County
--- 60+ minute commute: 6.3%
- Average commute time: 22.2 minutes
--- 3.6 minutes shorter than state average
- Left for work from 12 a.m. to 6 a.m.: 16.8%
- Worked outside county of residence: 10.9%
- Means of transportation: drove alone (81.8%), carpooled (10.9%), walked to work (1.6%), public transportation (0.8%), worked from home (3.9%)
#24. Montrose County
--- 60+ minute commute: 6.3%
- Average commute time: 19 minutes
--- 6.8 minutes shorter than state average
- Left for work from 12 a.m. to 6 a.m.: 13.1%
- Worked outside county of residence: 12.7%
- Means of transportation: drove alone (77.5%), carpooled (10.2%), walked to work (2.4%), public transportation (0.5%), worked from home (8.1%)
#23. Archuleta County
--- 60+ minute commute: 8.3%
- Average commute time: 20.6 minutes
--- 5.2 minutes shorter than state average
- Left for work from 12 a.m. to 6 a.m.: 5.5%
- Worked outside county of residence: 7.3%
- Means of transportation: drove alone (70.4%), carpooled (11.7%), walked to work (3.0%), public transportation (0.1%), worked from home (13.5%)
#22. Las Animas County
--- 60+ minute commute: 6.9%
- Average commute time: 19 minutes
--- 6.8 minutes shorter than state average
- Left for work from 12 a.m. to 6 a.m.: 11.4%
- Worked outside county of residence: 4.3%
- Means of transportation: drove alone (68.9%), carpooled (15.8%), walked to work (4.4%), public transportation (0.6%), worked from home (8.0%)
#21. Logan County
--- 60+ minute commute: 5.1%
- Average commute time: 17 minutes
--- 8.8 minutes shorter than state average
- Left for work from 12 a.m. to 6 a.m.: 17.0%
- Worked outside county of residence: 10.2%
- Means of transportation: drove alone (73.0%), carpooled (12.3%), walked to work (3.5%), public transportation (2.6%), worked from home (7.8%)
#20. Gilpin County
--- 60+ minute commute: 29.5%
- Average commute time: 38.4 minutes
--- 12.6 minutes longer than state average
- Left for work from 12 a.m. to 6 a.m.: 16.9%
- Worked outside county of residence: 51.4%
- Means of transportation: drove alone (73.1%), carpooled (9.3%), walked to work (1.3%), public transportation (0.7%), worked from home (15.2%)
#19. Costilla County
--- 60+ minute commute: 5.4%
- Average commute time: 23.9 minutes
--- 1.9 minutes shorter than state average
- Left for work from 12 a.m. to 6 a.m.: 2.1%
- Worked outside county of residence: 33.5%
- Means of transportation: drove alone (65.7%), carpooled (23.5%), walked to work (4.6%), public transportation (0.0%), worked from home (6.2%)
#18. Rio Blanco County
--- 60+ minute commute: 6.7%
- Average commute time: 15.3 minutes
--- 10.5 minutes shorter than state average
- Left for work from 12 a.m. to 6 a.m.: 17.2%
- Worked outside county of residence: 5.0%
- Means of transportation: drove alone (75.4%), carpooled (11.5%), walked to work (4.9%), public transportation (0.4%), worked from home (5.9%)
#17. Grand County
--- 60+ minute commute: 6.8%
- Average commute time: 24.6 minutes
--- 1.2 minutes shorter than state average
- Left for work from 12 a.m. to 6 a.m.: 12.6%
- Worked outside county of residence: 10.1%
- Means of transportation: drove alone (66.3%), carpooled (8.1%), walked to work (5.7%), public transportation (3.7%), worked from home (14.5%)
#16. Lincoln County
--- 60+ minute commute: 9.2%
- Average commute time: 17.1 minutes
--- 8.7 minutes shorter than state average
- Left for work from 12 a.m. to 6 a.m.: 10.0%
- Worked outside county of residence: 11.4%
- Means of transportation: drove alone (74.3%), carpooled (11.6%), walked to work (3.5%), public transportation (0.0%), worked from home (8.3%)
#15. Otero County
--- 60+ minute commute: 7.3%
- Average commute time: 21.1 minutes
--- 4.7 minutes shorter than state average
- Left for work from 12 a.m. to 6 a.m.: 15.8%
- Worked outside county of residence: 15.1%
- Means of transportation: drove alone (77.3%), carpooled (12.8%), walked to work (2.4%), public transportation (0.1%), worked from home (3.9%)
#14. Lake County
--- 60+ minute commute: 16.3%
- Average commute time: 35.7 minutes
--- 9.9 minutes longer than state average
- Left for work from 12 a.m. to 6 a.m.: 17.0%
- Worked outside county of residence: 54.4%
- Means of transportation: drove alone (67.1%), carpooled (18.9%), walked to work (2.0%), public transportation (0.0%), worked from home (6.4%)
#13. Ouray County
--- 60+ minute commute: 14.8%
- Average commute time: 28.6 minutes
--- 2.8 minutes longer than state average
- Left for work from 12 a.m. to 6 a.m.: 7.0%
- Worked outside county of residence: 25.1%
- Means of transportation: drove alone (64.8%), carpooled (9.6%), walked to work (6.4%), public transportation (0.0%), worked from home (17.1%)
#12. Morgan County
--- 60+ minute commute: 7.8%
- Average commute time: 18.7 minutes
--- 7.1 minutes shorter than state average
- Left for work from 12 a.m. to 6 a.m.: 24.5%
- Worked outside county of residence: 9.9%
- Means of transportation: drove alone (76.5%), carpooled (15.2%), walked to work (1.6%), public transportation (0.1%), worked from home (5.8%)
#11. Fremont County
--- 60+ minute commute: 12.1%
- Average commute time: 25.7 minutes
--- 0.1 minutes shorter than state average
- Left for work from 12 a.m. to 6 a.m.: 17.8%
- Worked outside county of residence: 19.5%
- Means of transportation: drove alone (79.2%), carpooled (9.8%), walked to work (1.3%), public transportation (0.1%), worked from home (8.6%)
#10. Chaffee County
--- 60+ minute commute: 6.3%
- Average commute time: 18.8 minutes
--- 7.0 minutes shorter than state average
- Left for work from 12 a.m. to 6 a.m.: 9.9%
- Worked outside county of residence: 6.8%
- Means of transportation: drove alone (67.7%), carpooled (8.4%), walked to work (5.1%), public transportation (0.5%), worked from home (13.5%)
#9. Sedgwick County
--- 60+ minute commute: 8.1%
- Average commute time: 21.5 minutes
--- 4.3 minutes shorter than state average
- Left for work from 12 a.m. to 6 a.m.: 21.7%
- Worked outside county of residence: 9.4%
- Means of transportation: drove alone (71.2%), carpooled (12.0%), walked to work (6.7%), public transportation (0.0%), worked from home (8.7%)
#8. Washington County
--- 60+ minute commute: 9.4%
- Average commute time: 23.7 minutes
--- 2.1 minutes shorter than state average
- Left for work from 12 a.m. to 6 a.m.: 13.7%
- Worked outside county of residence: 31.6%
- Means of transportation: drove alone (71.0%), carpooled (11.8%), walked to work (4.6%), public transportation (0.0%), worked from home (11.6%)
#7. San Juan County
--- 60+ minute commute: 7.2%
- Average commute time: 14.8 minutes
--- 11.0 minutes shorter than state average
- Left for work from 12 a.m. to 6 a.m.: 16.8%
- Worked outside county of residence: 8.9%
- Means of transportation: drove alone (57.4%), carpooled (5.4%), walked to work (18.2%), public transportation (0.0%), worked from home (13.1%)
#6. Delta County
--- 60+ minute commute: 15.0%
- Average commute time: 29 minutes
--- 3.2 minutes longer than state average
- Left for work from 12 a.m. to 6 a.m.: 21.3%
- Worked outside county of residence: 25.8%
- Means of transportation: drove alone (72.0%), carpooled (12.8%), walked to work (3.0%), public transportation (0.6%), worked from home (10.9%)
#5. Teller County
--- 60+ minute commute: 14.5%
- Average commute time: 33.4 minutes
--- 7.6 minutes longer than state average
- Left for work from 12 a.m. to 6 a.m.: 16.4%
- Worked outside county of residence: 34.5%
- Means of transportation: drove alone (74.3%), carpooled (10.4%), walked to work (2.3%), public transportation (0.0%), worked from home (11.9%)
#4. Custer County
--- 60+ minute commute: 19.3%
- Average commute time: 30.6 minutes
--- 4.8 minutes longer than state average
- Left for work from 12 a.m. to 6 a.m.: 1.3%
- Worked outside county of residence: 32.2%
- Means of transportation: drove alone (74.9%), carpooled (2.3%), walked to work (4.2%), public transportation (0.0%), worked from home (18.4%)
#3. Elbert County
--- 60+ minute commute: 23.7%
- Average commute time: 42 minutes
--- 16.2 minutes longer than state average
- Left for work from 12 a.m. to 6 a.m.: 19.0%
- Worked outside county of residence: 66.3%
- Means of transportation: drove alone (79.0%), carpooled (7.9%), walked to work (1.2%), public transportation (0.2%), worked from home (10.9%)
#2. Garfield County
--- 60+ minute commute: 17.5%
- Average commute time: 31.7 minutes
--- 5.9 minutes longer than state average
- Left for work from 12 a.m. to 6 a.m.: 17.0%
- Worked outside county of residence: 23.2%
- Means of transportation: drove alone (67.9%), carpooled (14.0%), walked to work (3.4%), public transportation (3.6%), worked from home (8.2%)
#1. Jackson County
--- 60+ minute commute: 13.1%
- Average commute time: 26 minutes
--- 0.2 minutes longer than state average
- Left for work from 12 a.m. to 6 a.m.: 8.2%
- Worked outside county of residence: 7.9%
- Means of transportation: drove alone (52.6%), carpooled (7.4%), walked to work (15.1%), public transportation (0.0%), worked from home (20.5%)


