
How lifetime emissions of different energy sources stack up
This story originally appeared on Rocket Solar and was produced and distributed in partnership with Stacker Studio.
How lifetime emissions of different energy sources stack up
After six decades of experiments, scientists from the National Ignition Facility at the Lawrence Livermore National Laboratory in California announced an energy breakthrough in December 2022: a nuclear fusion reactor had produced more energy than was used to run it.
With nuclear fusion still years—and billions of dollars—away from being scalable, the current landscape of short-term clean energy production hasn't changed. Today, energy sector investments and research are mostly directed toward optimizing existing energy production methods, and reducing the carbon footprint they leave behind.
To determine the carbon footprint of these current energy sources, researchers conduct a life-cycle assessment, a quantitative analysis of the environmental aspects of a product or process. Life-cycle assessments determine how much greenhouse gas emissions a source of energy produces throughout its life span, from "cradle to grave."
Rocket Solar analyzed data from the National Renewable Energy Laboratory to see how greenhouse gas emissions differ among energy sources throughout their life cycle. NREL performed a systematic review of approximately 3,000 published life-cycle assessment studies to quantify a consistent metric for comparing different energy technologies.
To compare the various kinds of energy sources, data metrics from these studies were compared by measuring greenhouse gas emissions produced from processes including resource extraction; construction and delivery; operation and maintenance; and disposal and recycling. Each energy source was ranked by the amount of CO2 equivalent grams used through its entire life cycle.
Renewable energy sources don't generate emissions during their 'ongoing combustion' phase
In the energy industry, there are four generalized life-cycle phases of greenhouse gas emission generation, though some may widely differ from one technology to another. The life cycle starts with the upstream phase, which is when extraction begins for all materials needed to assemble the machinery and infrastructure required to produce the energy.
The second phase is production, which is the activation and management of a fuel source such as wind, water, or heat. After these fuel sources are activated and begin creating energy, it enters the third phase, which is called combustion. The downstream phase comes last, which is the disposal or recycling of all material used throughout the life-cycle process.
The carbon emission output during each stage can vary greatly depending on the type of energy. For example, fuel combustion during the third life-cycle stage emits the majority of greenhouse gases from fossil-fueled technologies. Meanwhile, emissions from nuclear and renewable energy processes occur more during the upstream stage—the first phase when initial materials are extracted.
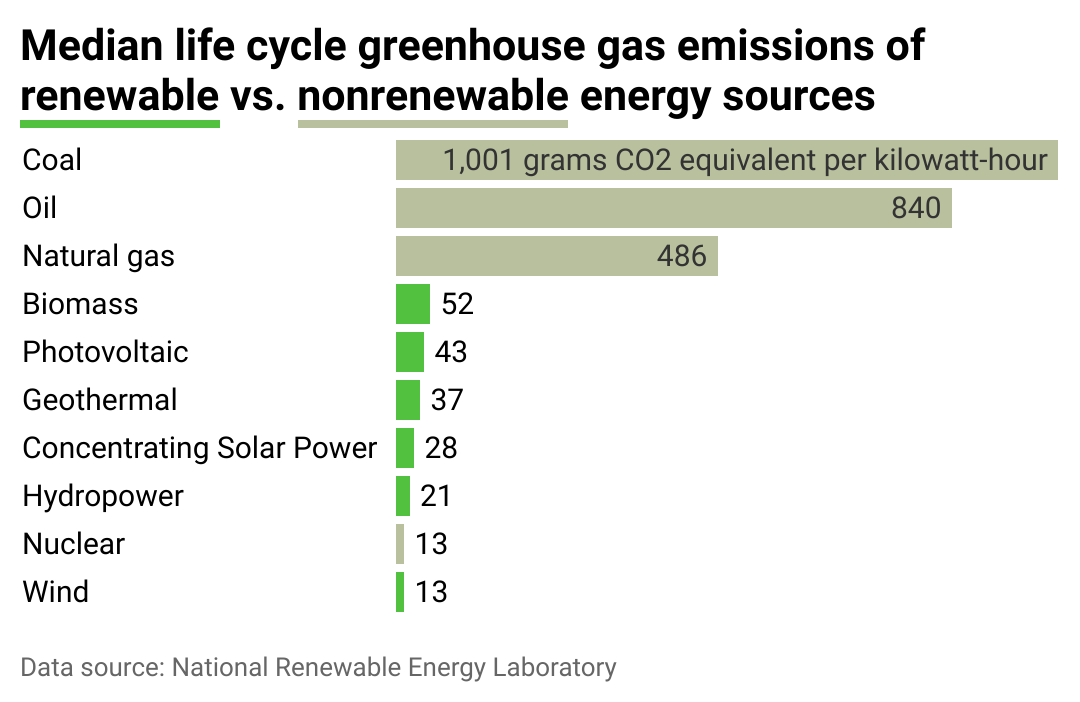
The metric used to quantify the environmental footprint of a product or process is CO2 equivalent (CO2e). This is a measurement that bundles several greenhouse gases (not only carbon dioxide) to be represented as a single number. When comparing the C02 equivalent of the 10 most common energy sources, the data shows that emissions from renewable electricity generation are lower than those from fossil fuels. Read on to learn more about how these 10 types of energy rank by the total carbon emissions, and which phase of their life cycle emits the most.

#1. Wind (renewable)
- Total life cycle emissions: 13.0 grams CO2 equivalent per kilowatt-hour
--- One-time upstream: 12.0 grams
--- Ongoing combustion: Not applicable
--- Ongoing noncombustion: 0.74 grams
--- One-time downstream: 0.34 grams
Harnessing the wind, an inexhaustible resource, to produce energy requires the installation of dozens of towers and turbines either on land or offshore. The giant structures have become part of the countryside and marine landscapes in recent years, causing either indifference or discontent among rural and coastal populations. It's a fact that wind farms produce clean energy; nonetheless, the extraction of the materials for the structures (steel, fiberglass, resin, plastic, iron, copper, and aluminum), and the energy used to build them, are the least environmentally friendly phase of the life cycle of this type of power production.
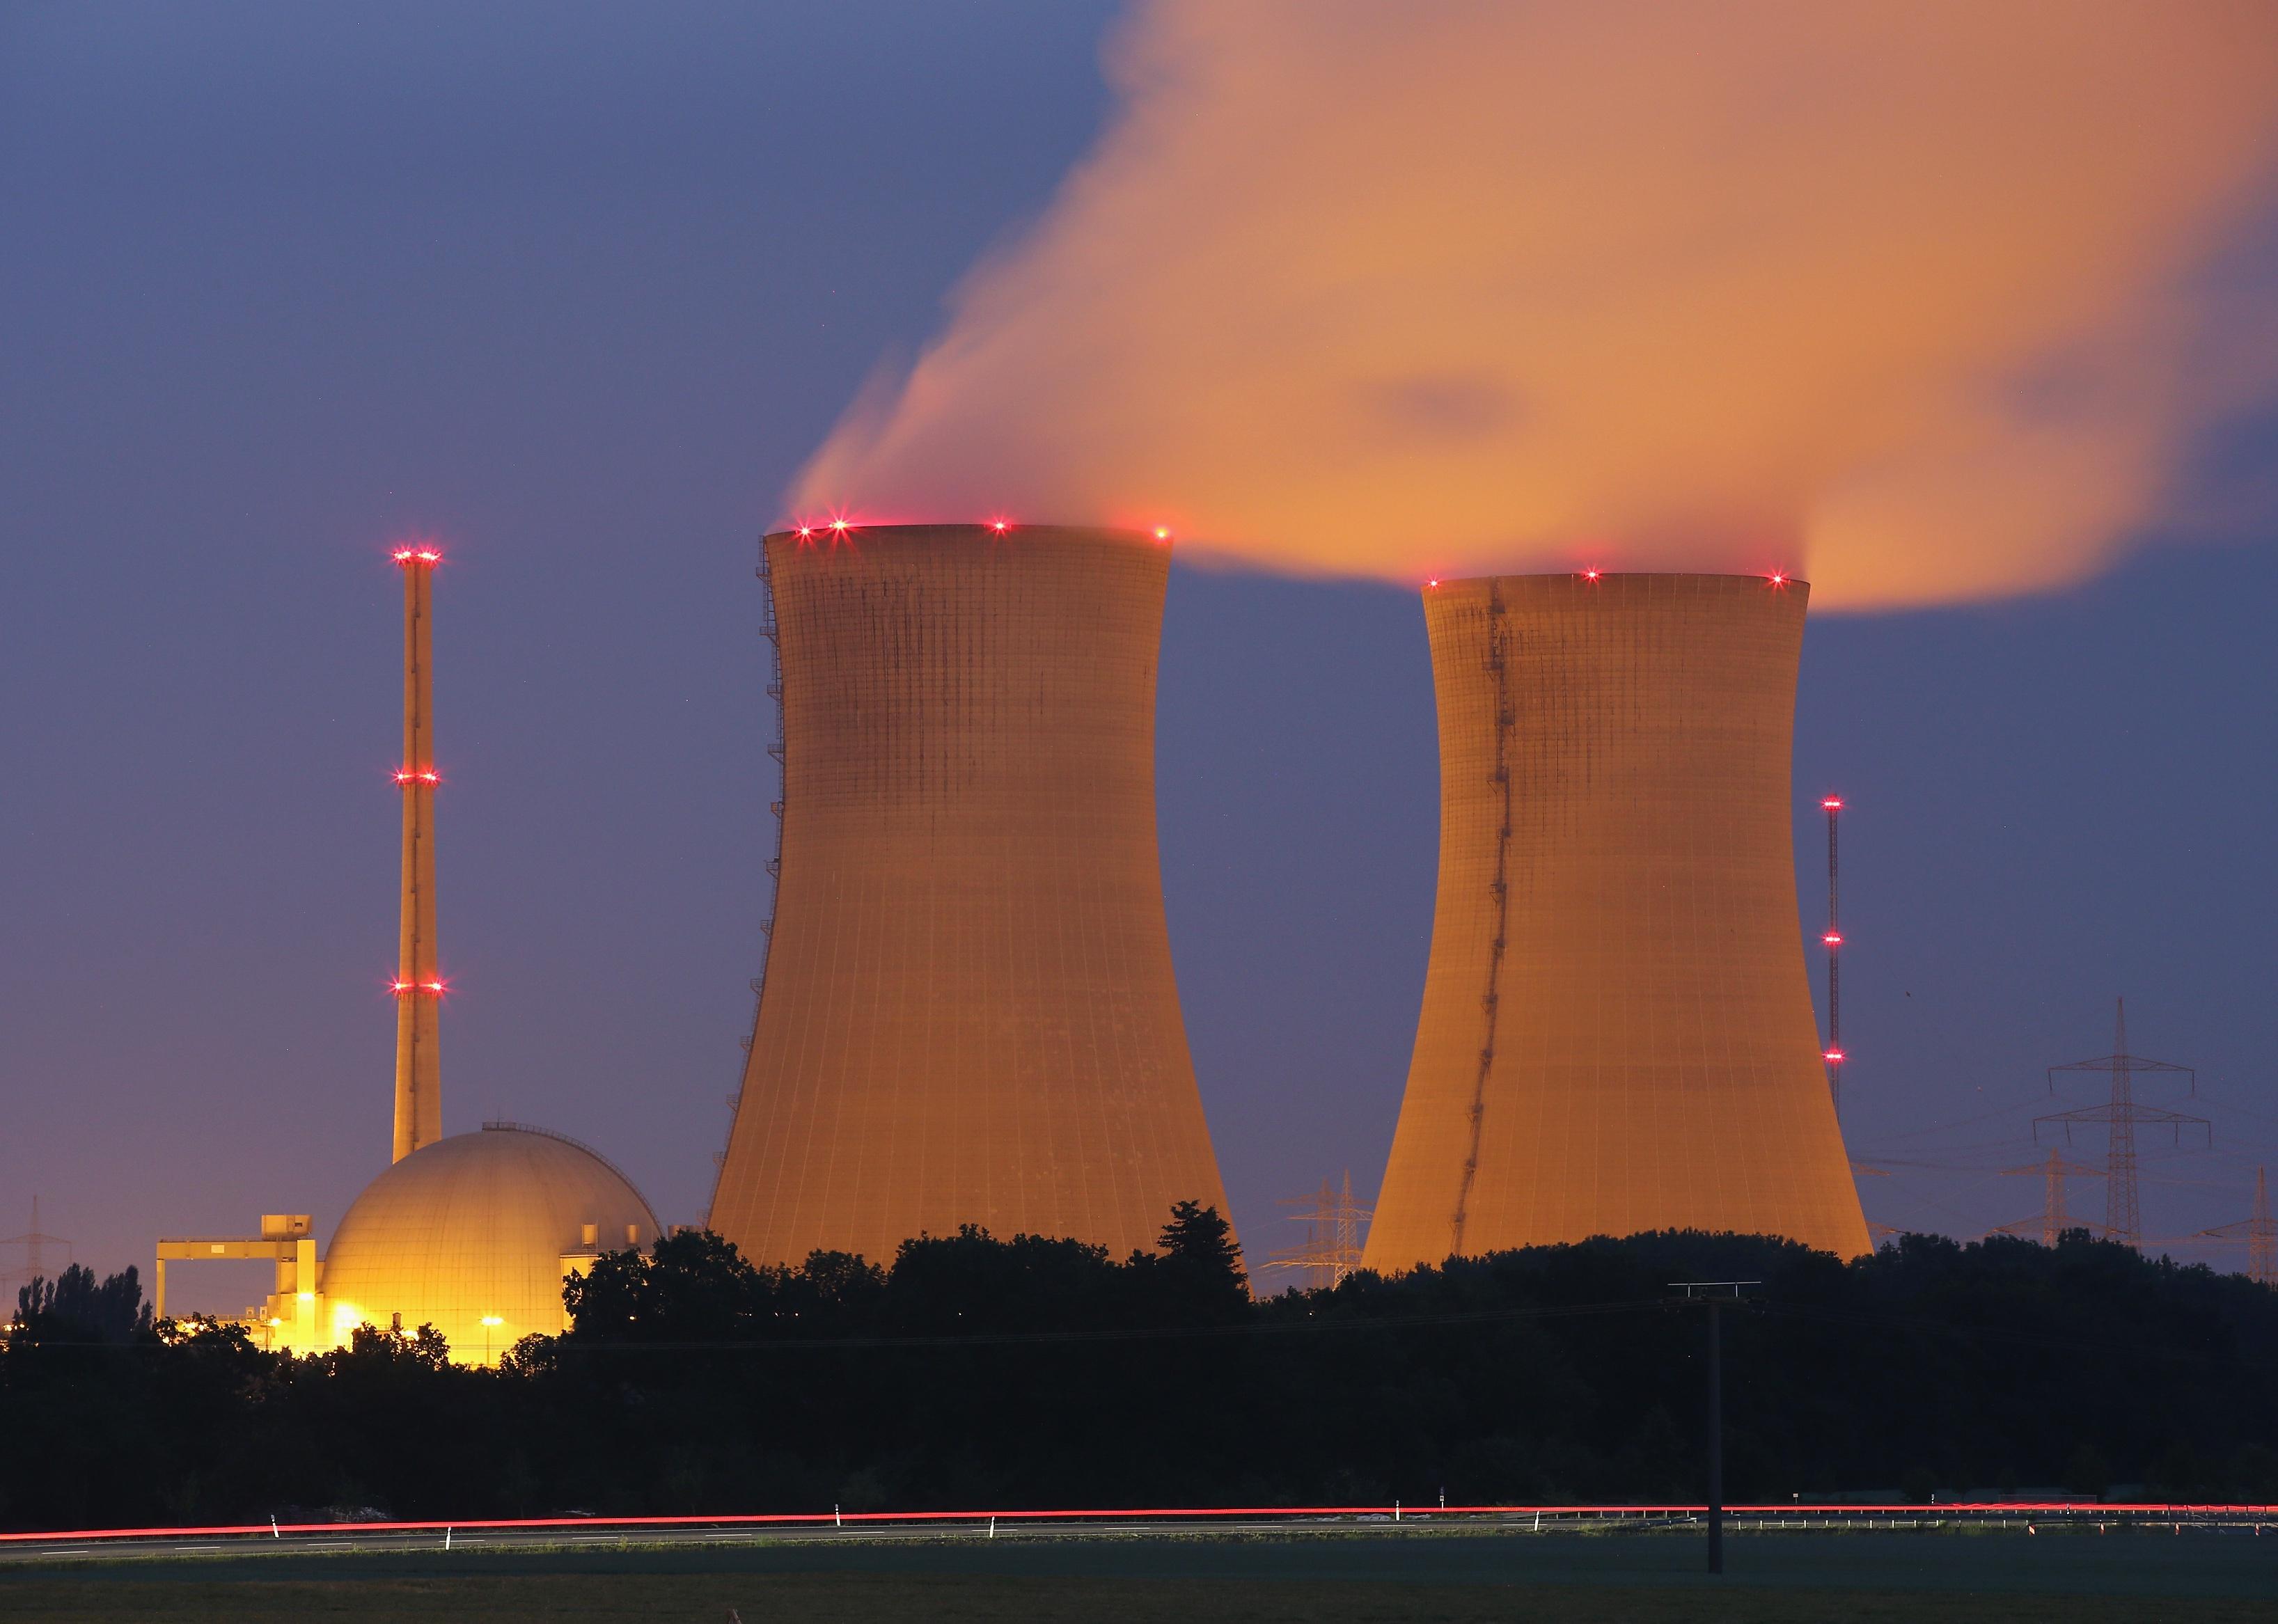
#2. Nuclear (nonrenewable)
- Total life cycle emissions: 13.0 grams CO2 equivalent per kilowatt-hour
--- One-time upstream: 2.0 grams
--- Ongoing combustion: Not applicable
--- Ongoing noncombustion: 12 grams
--- One-time downstream: 0.7 grams
Thanks to nuclear power, the United States avoided over 471 million metric tons of carbon dioxide emissions in 2020, according to the Nuclear Energy Institute. Nuclear fission power is a constant and reliable energy source with relatively low production costs. Despite certain high-profile disasters such as Chernobyl and Fukushima, nuclear power is considered highly safe. The concerns surrounding its operation process arise over the use of uranium—a highly radioactive nonrenewable resource—that must be meticulously handled and disposed.

#3. Hydropower (renewable)
- Total life cycle emissions: 21.0 grams CO2 equivalent per kilowatt-hour
--- One-time upstream: 6.2 grams
--- Ongoing combustion: Not applicable
--- Ongoing noncombustion: 1.9 grams
--- One-time downstream: 0.004 grams
Unlike other types of renewable and clean energy, hydropower provides a stable and constant source of electricity. The power it produces does not depend on rain but rather on the rainwater previously stored in reservoirs. To build dams and hydraulic energy stations, the natural course of rivers is modified, harming the ecosystems of freshwater fauna and the land it originally irrigated. A sizable investment and considerable amounts of time are required to build the facilities. Once in service, the energy produced is cheap and reliable, provided a natural disaster does not interfere with the process.
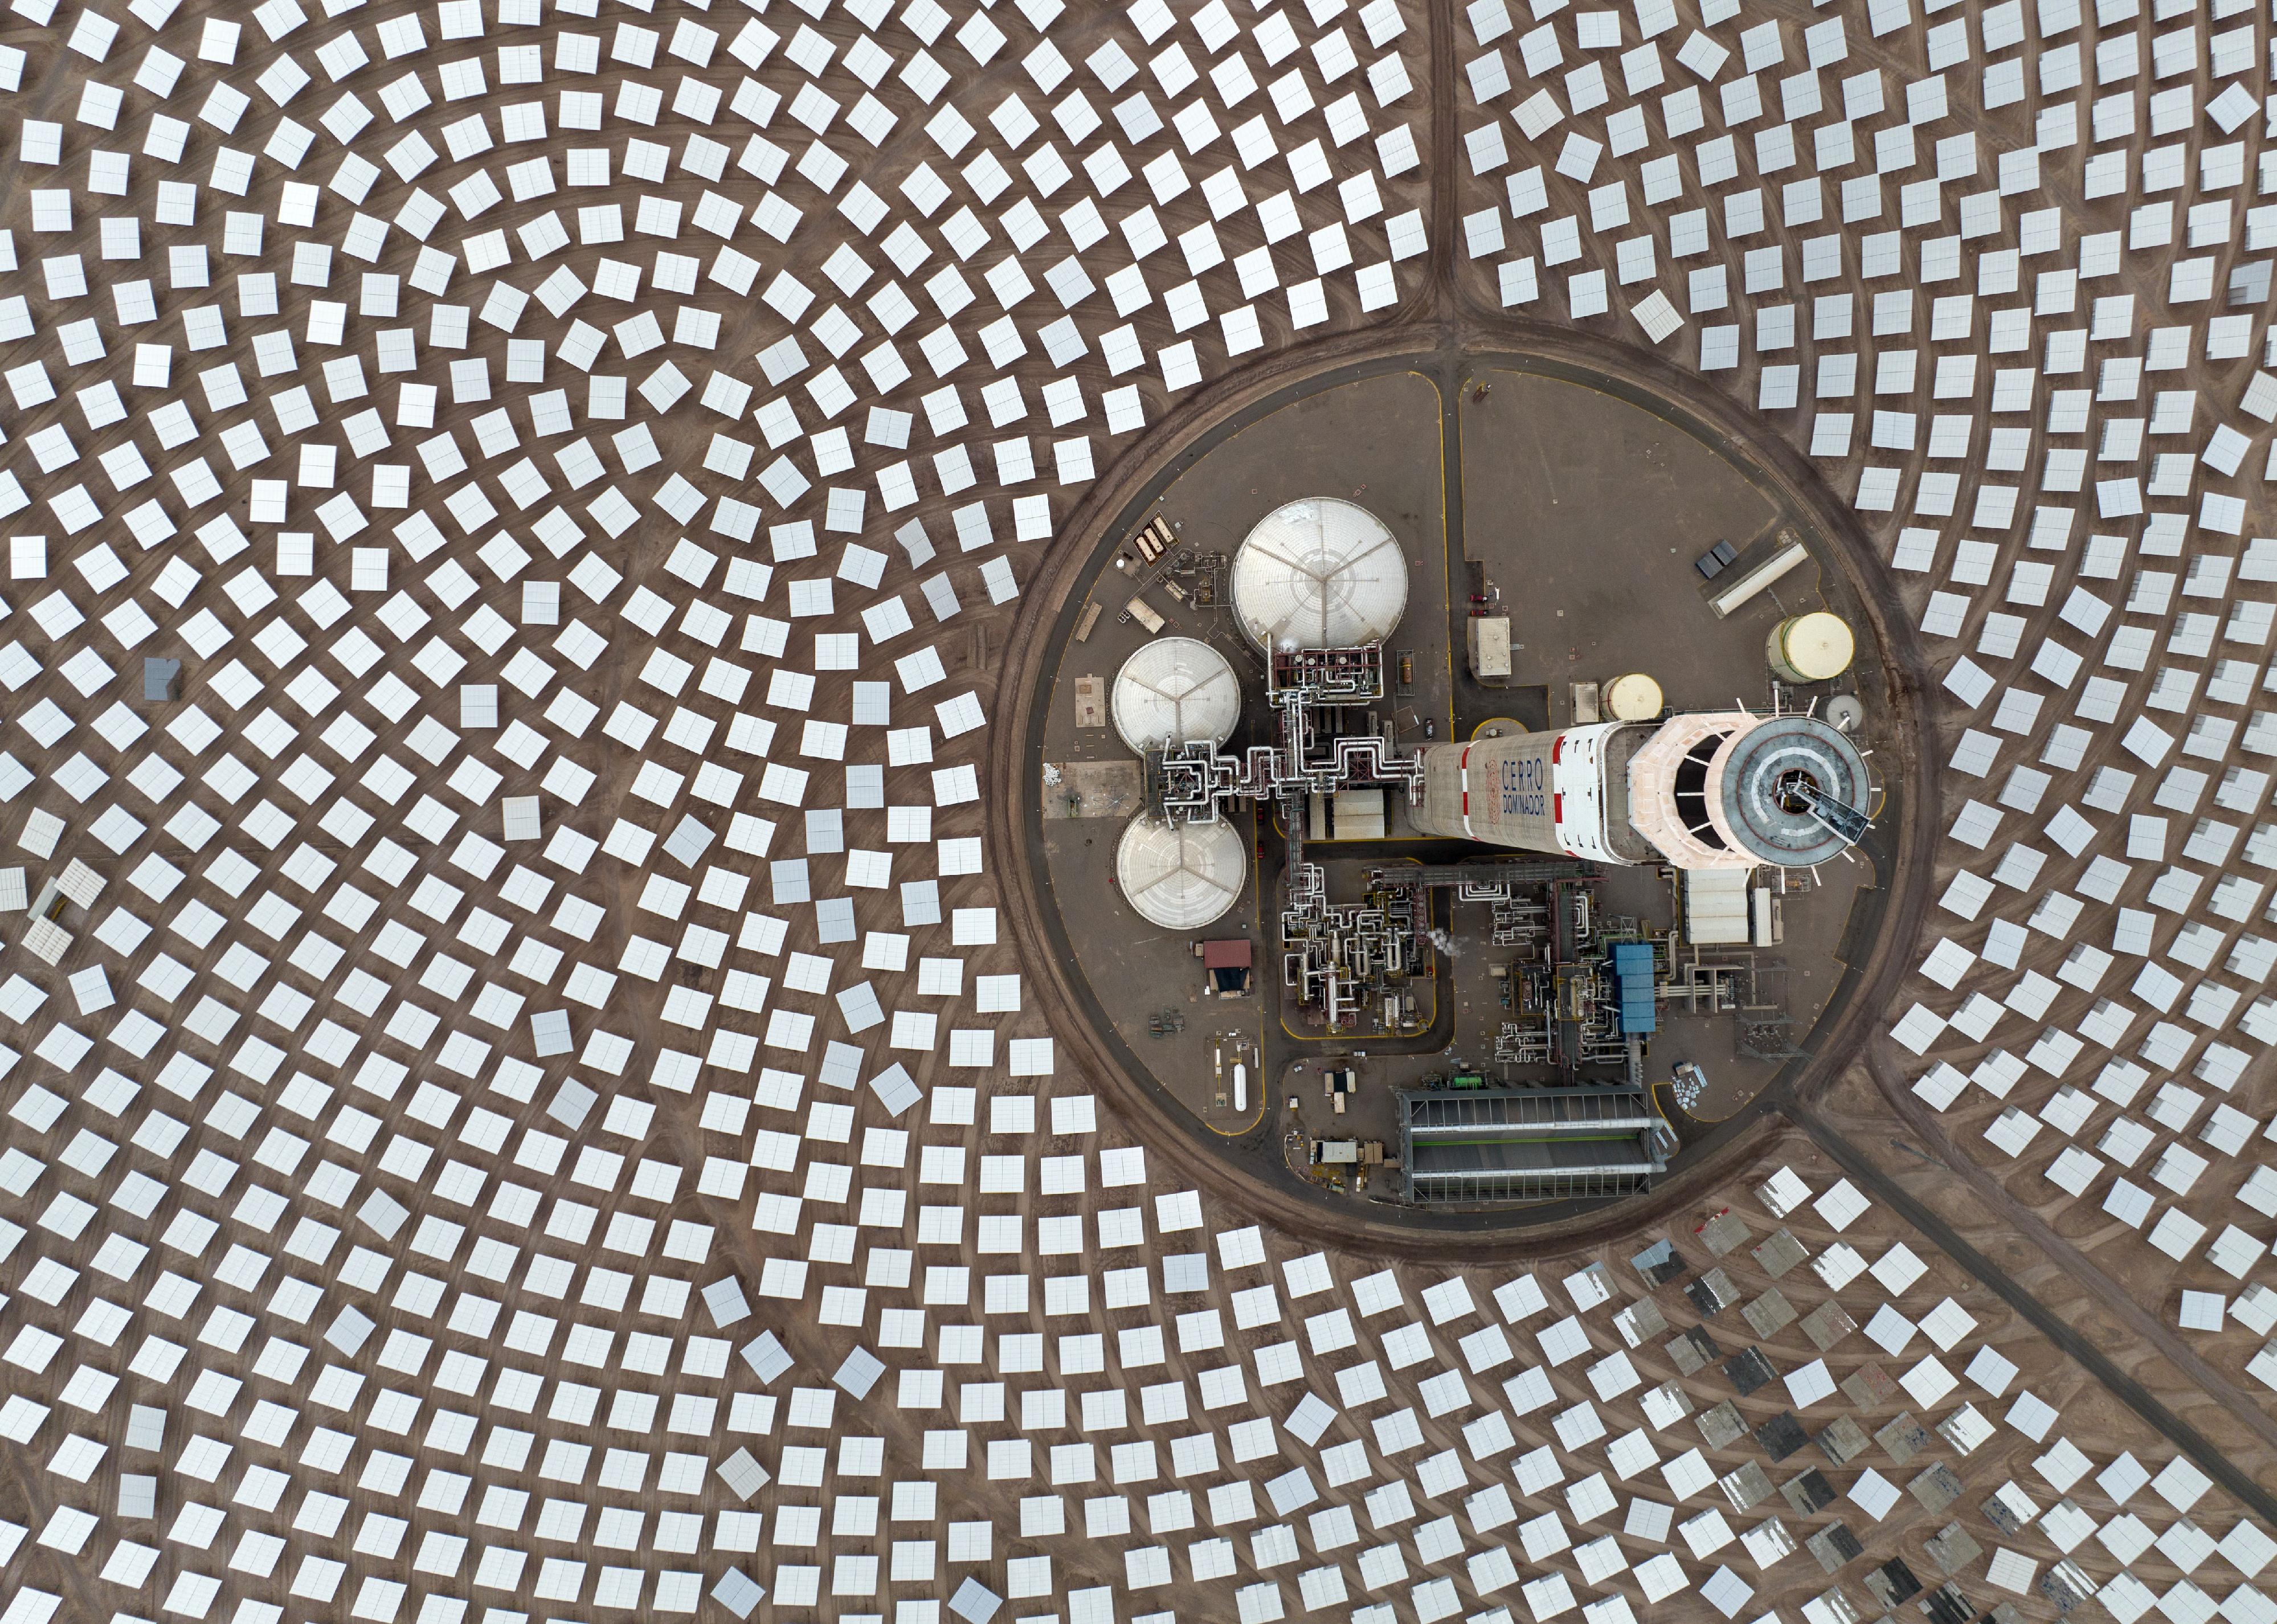
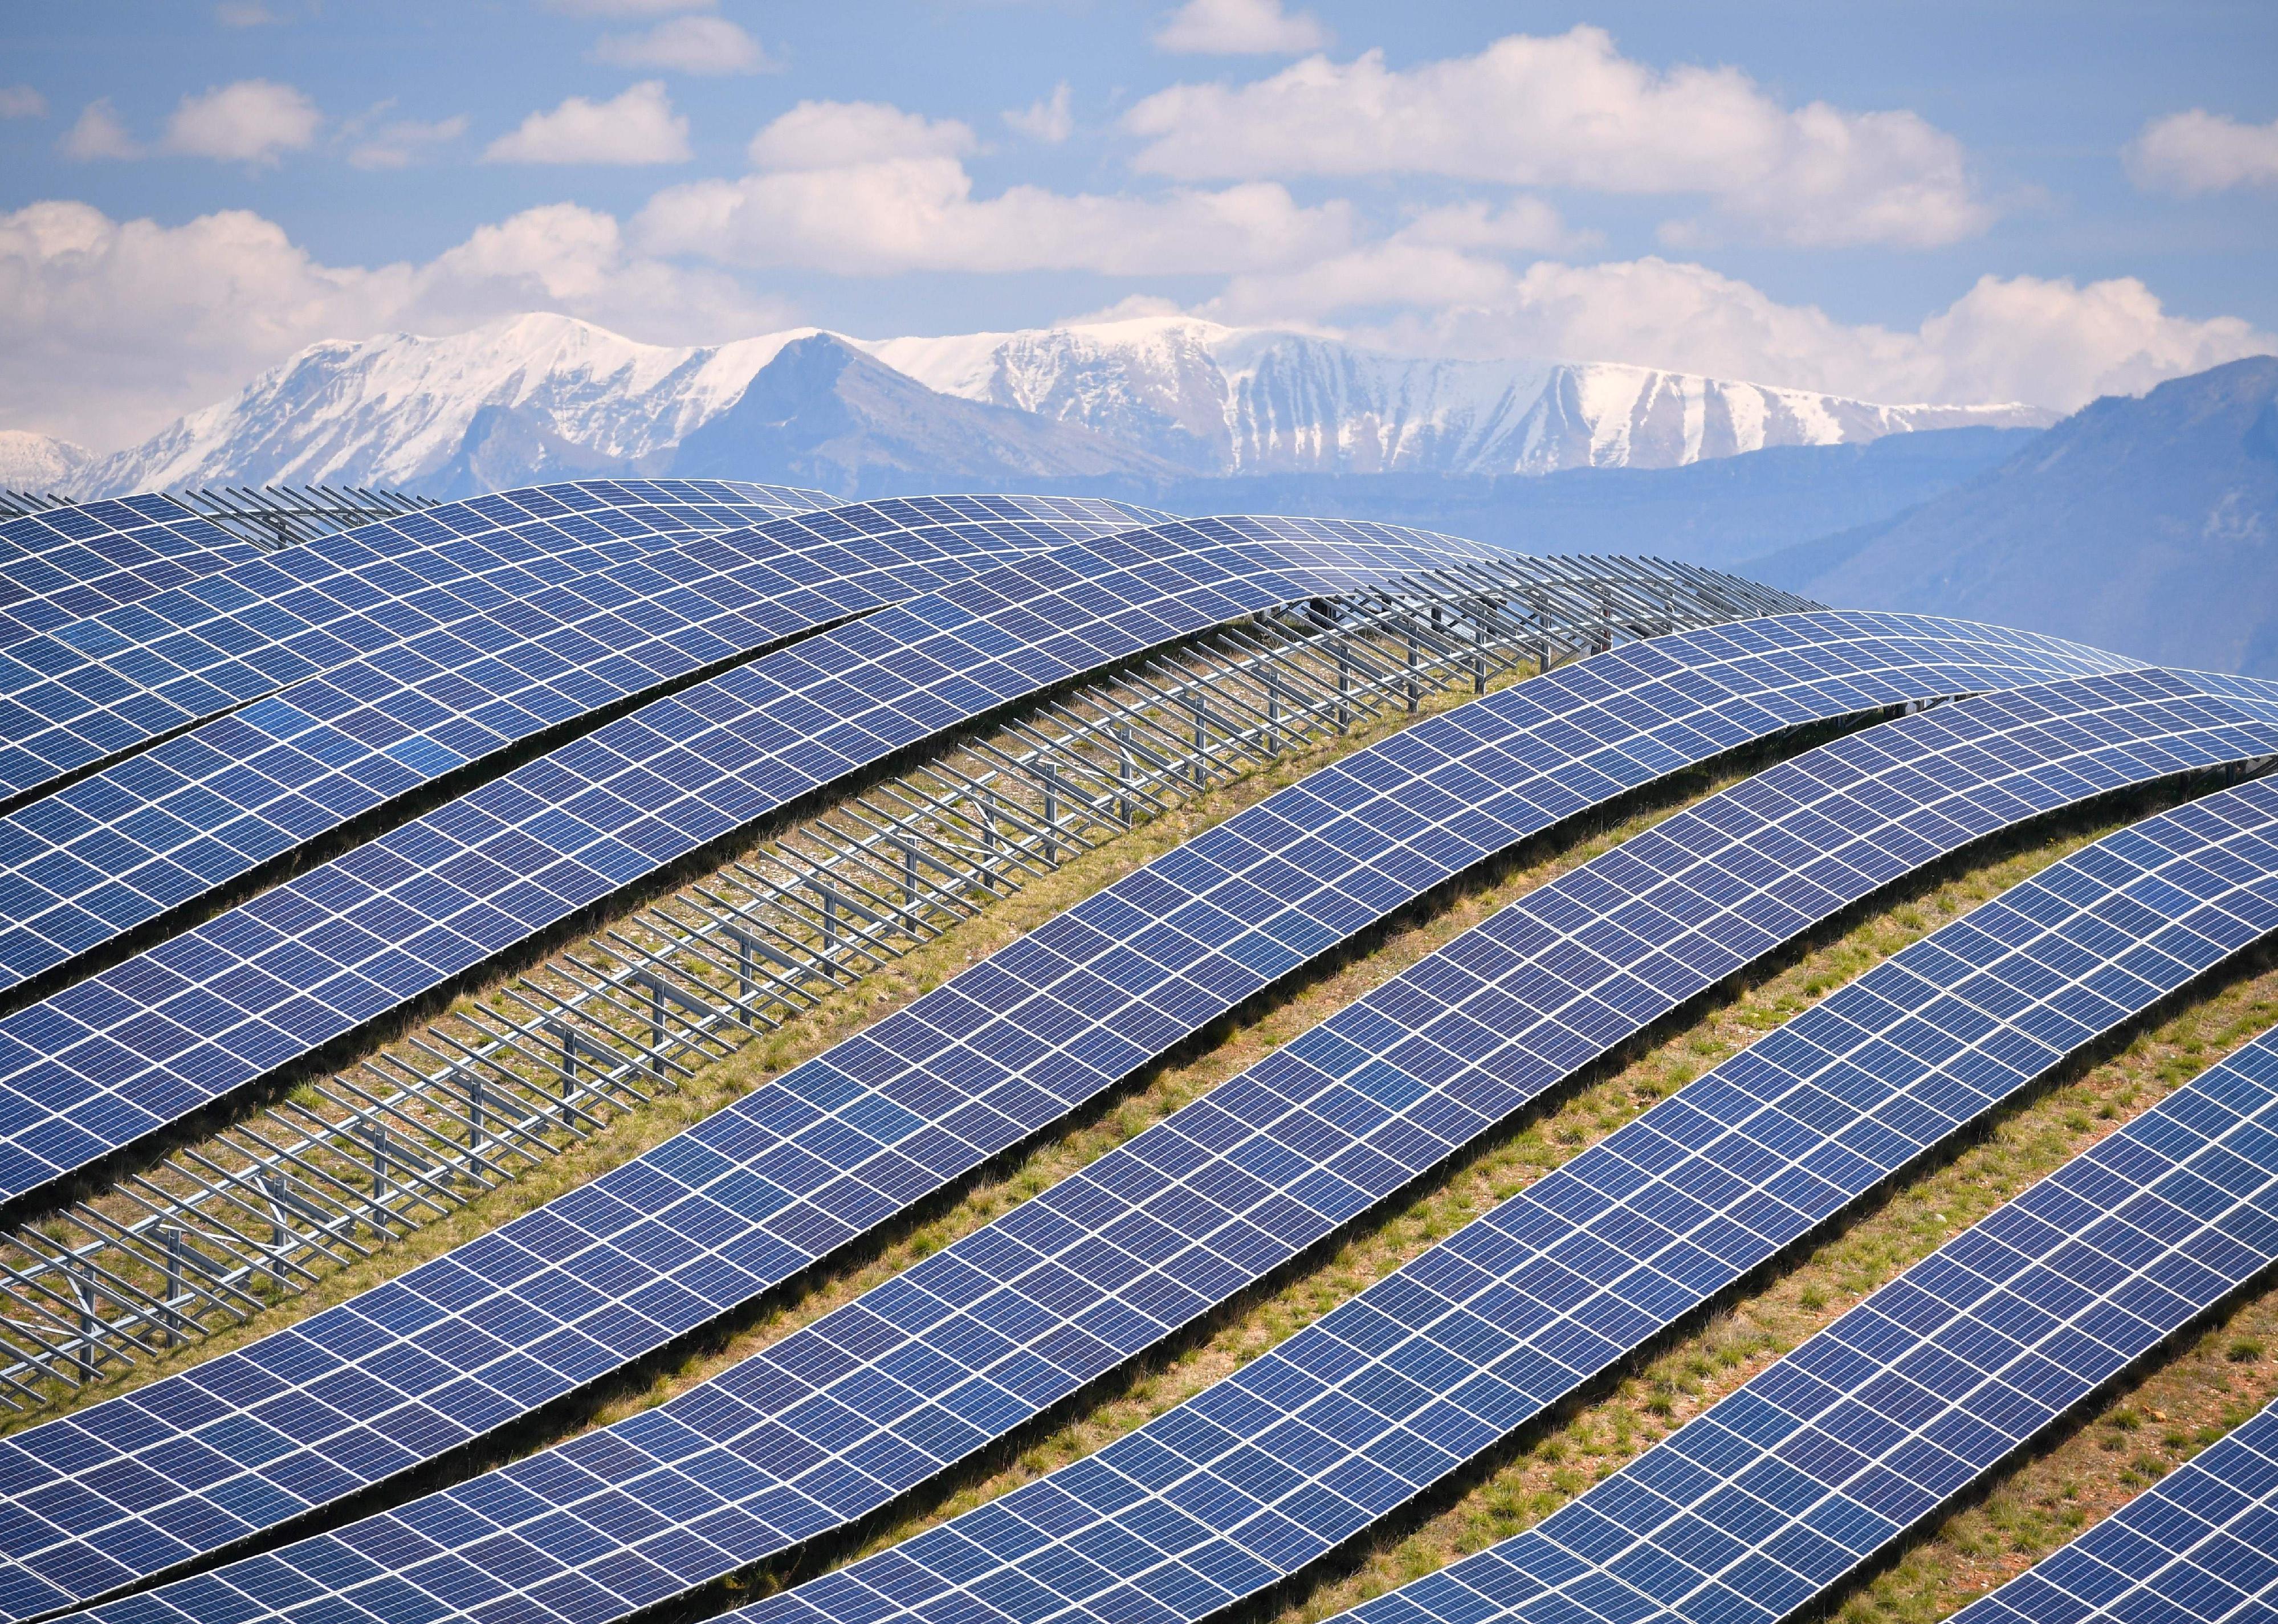
#4. Concentrating solar power (renewable)
- Total life cycle emissions: 28.0 grams CO2 equivalent per kilowatt-hour
--- One-time upstream: 20.0 grams
--- Ongoing combustion: Not applicable
--- Ongoing noncombustion: 10.0 grams
--- One-time downstream: 0.53 grams
Converting sunlight into electrical energy has attracted some of the most interest as researchers and investors have focused attention on this sector in recent decades. The least-polluting method of converting sunlight is concentrating solar power. Although the process emits some greenhouse gases in its operational phase, it generates twice as much in the upstream stage. Manufacturing reflective plates and energy storage capsules require finite materials. In addition, solar farms use up large tracts of land, changing its conditions and affecting the endemic and temporary flora and fauna of the area.
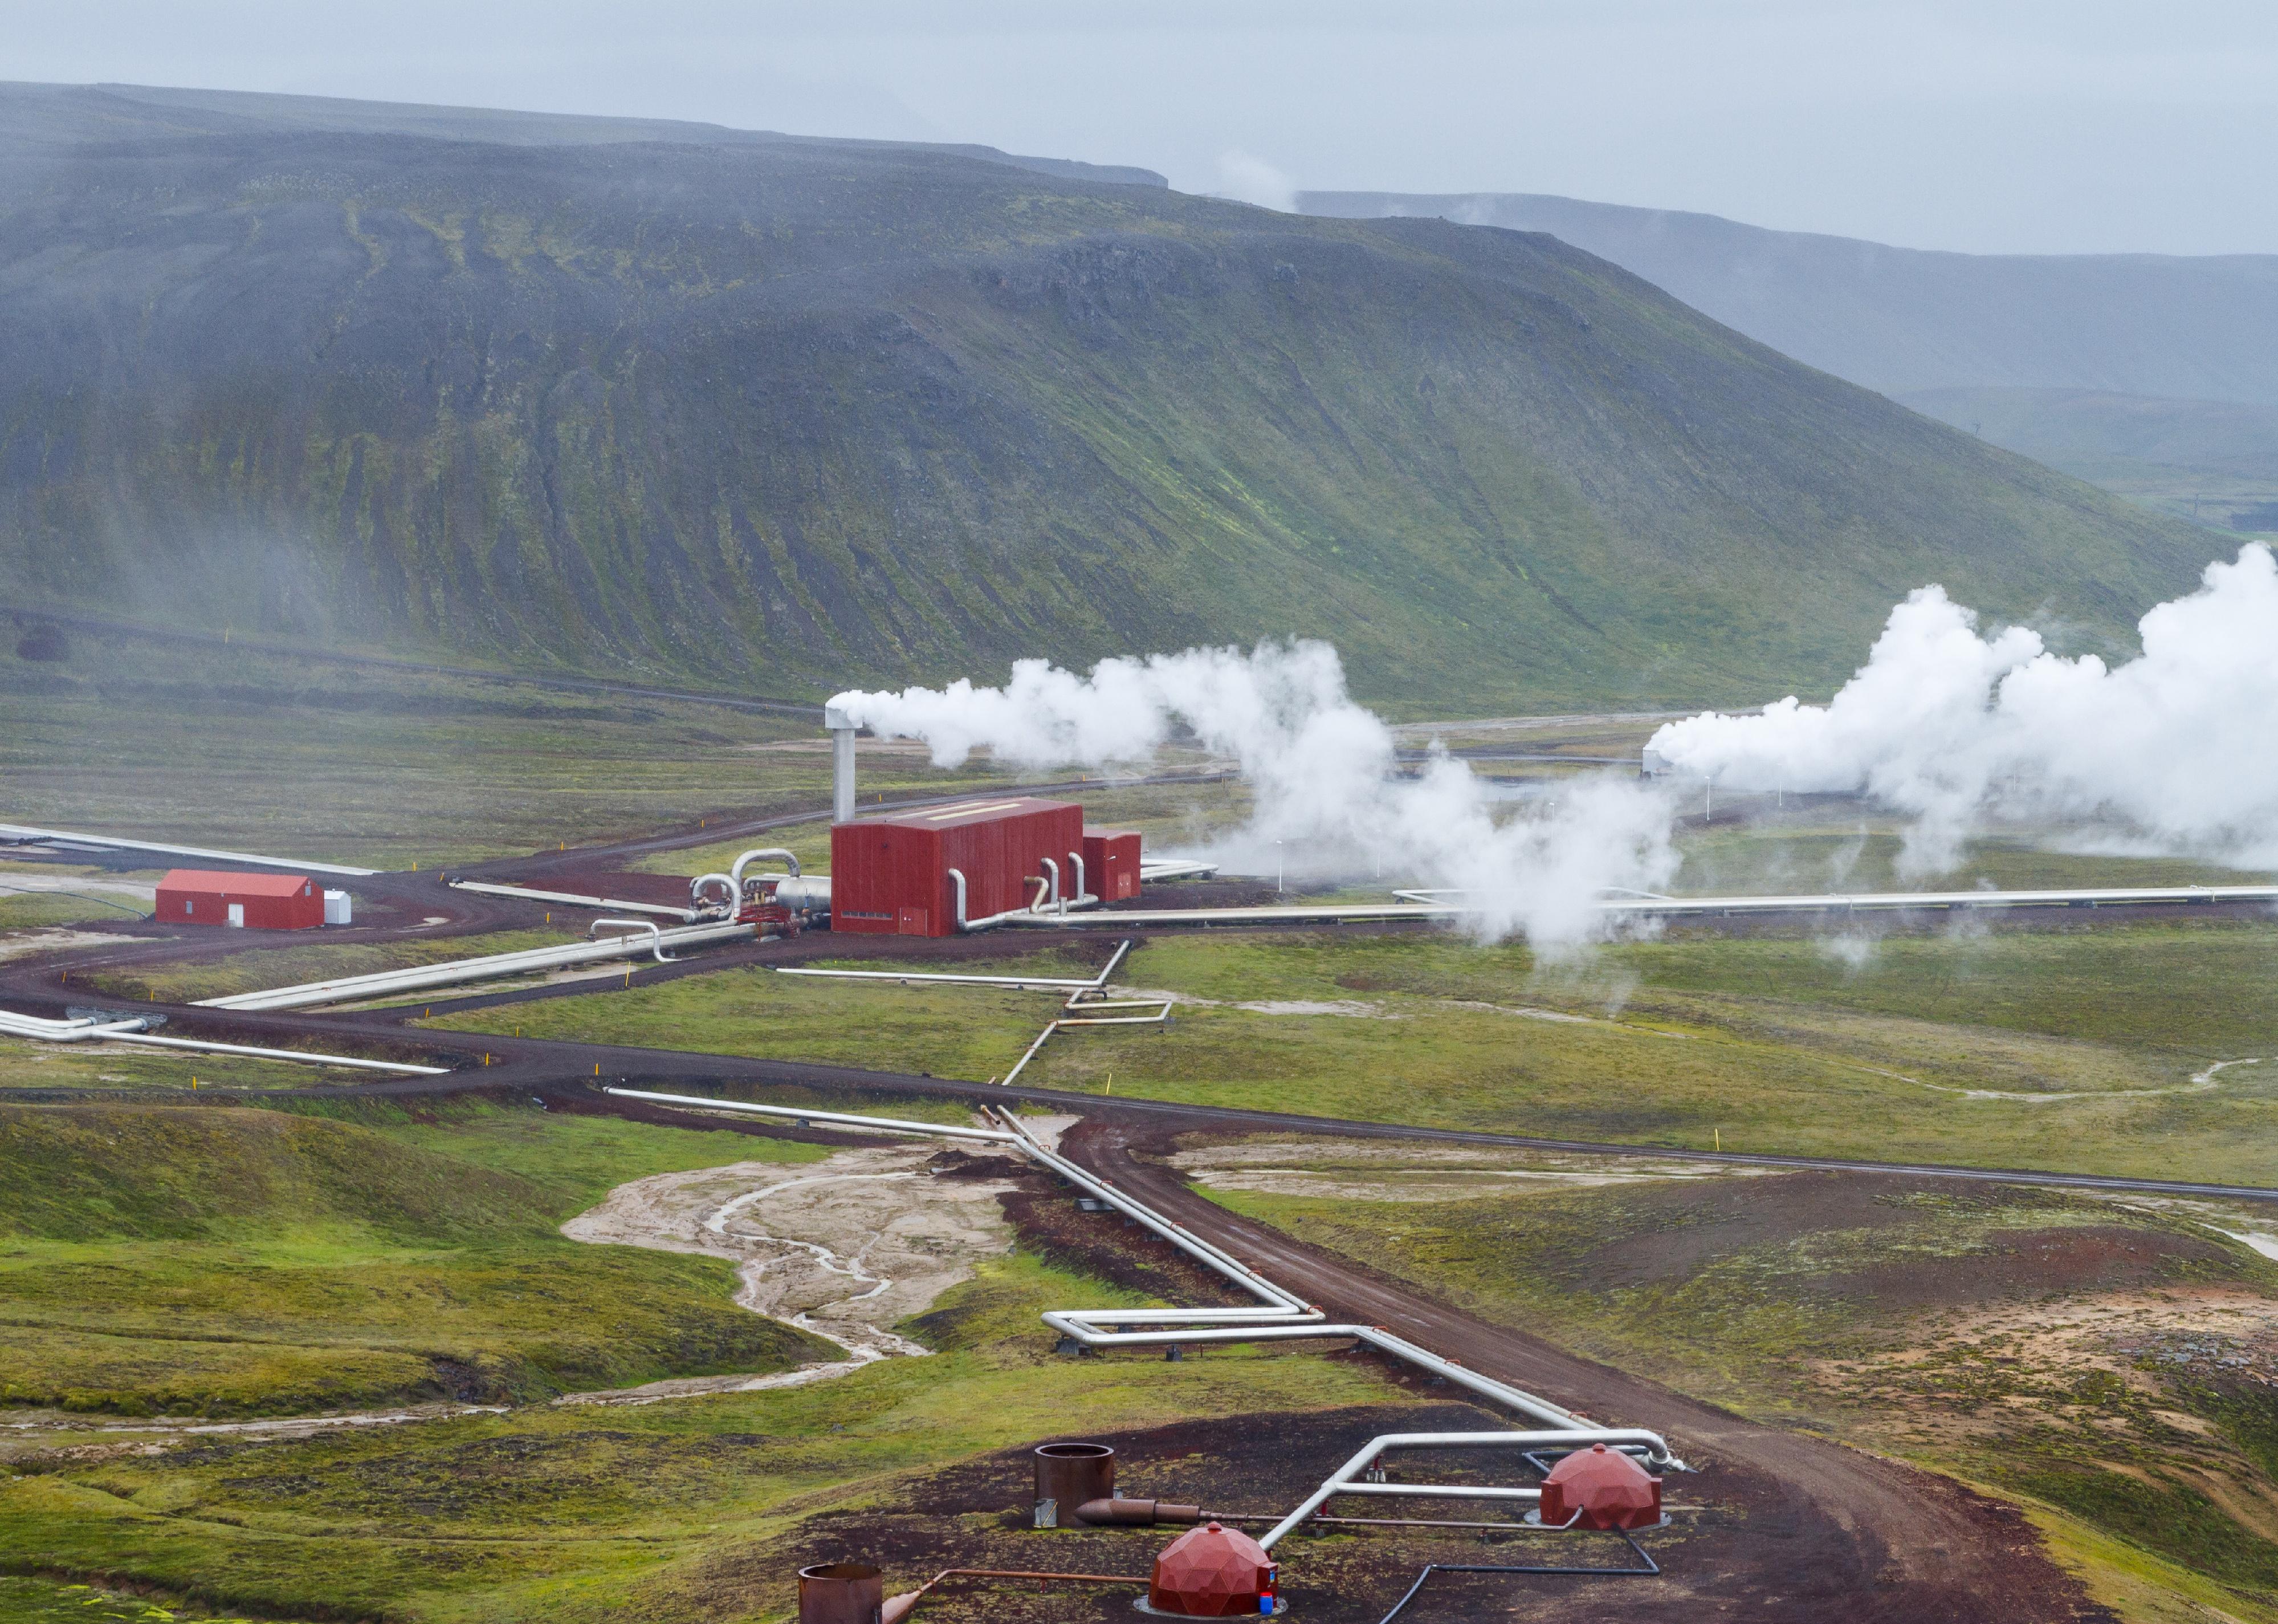
#5. Geothermal (renewable)
- Total life cycle emissions: 37.0 grams CO2 equivalent per kilowatt-hour
--- One-time upstream: 15.0 grams
--- Ongoing combustion: Not applicable
--- Ongoing noncombustion: 6.9 grams
--- One-time downstream: 0.12 grams
Although geothermal energy is permanent, renewable, and clean, extracting it from the inner layers of the planet is not easy. For starters, the initial investment in implementing excavation processes and building geothermal power plants is elevated, and they must be built close to natural underground energy sources. The power produced cannot be transported as petroleum or natural gas can be. The excavation procedures, which vary and are ongoing from season to season, can contaminate water sources with dust, oils, and fuels.
#6. Photovoltaic (renewable)
- Total life cycle emissions: 43.0 grams CO2 equivalent per kilowatt-hour
--- One-time upstream: 28.0 grams
--- Ongoing combustion: Not applicable
--- Ongoing noncombustion: ~ 10.0 grams
--- One-time downstream: ~ 5.0 grams
Photovoltaic energy is the most-used source of solar power. It has progressively become more affordable, increasing its adoption in urban, industrial, and rural areas. It is usually combined with other energy sources to increase its efficiency and storage capacity. The materials used in the production of photovoltaic panels are nonrenewable. Despite this, the carbon footprint of photovoltaic power is considerably lower than fossil fuel-powered electricity. When they reach about the third year of use, most solar panels become emission neutral.
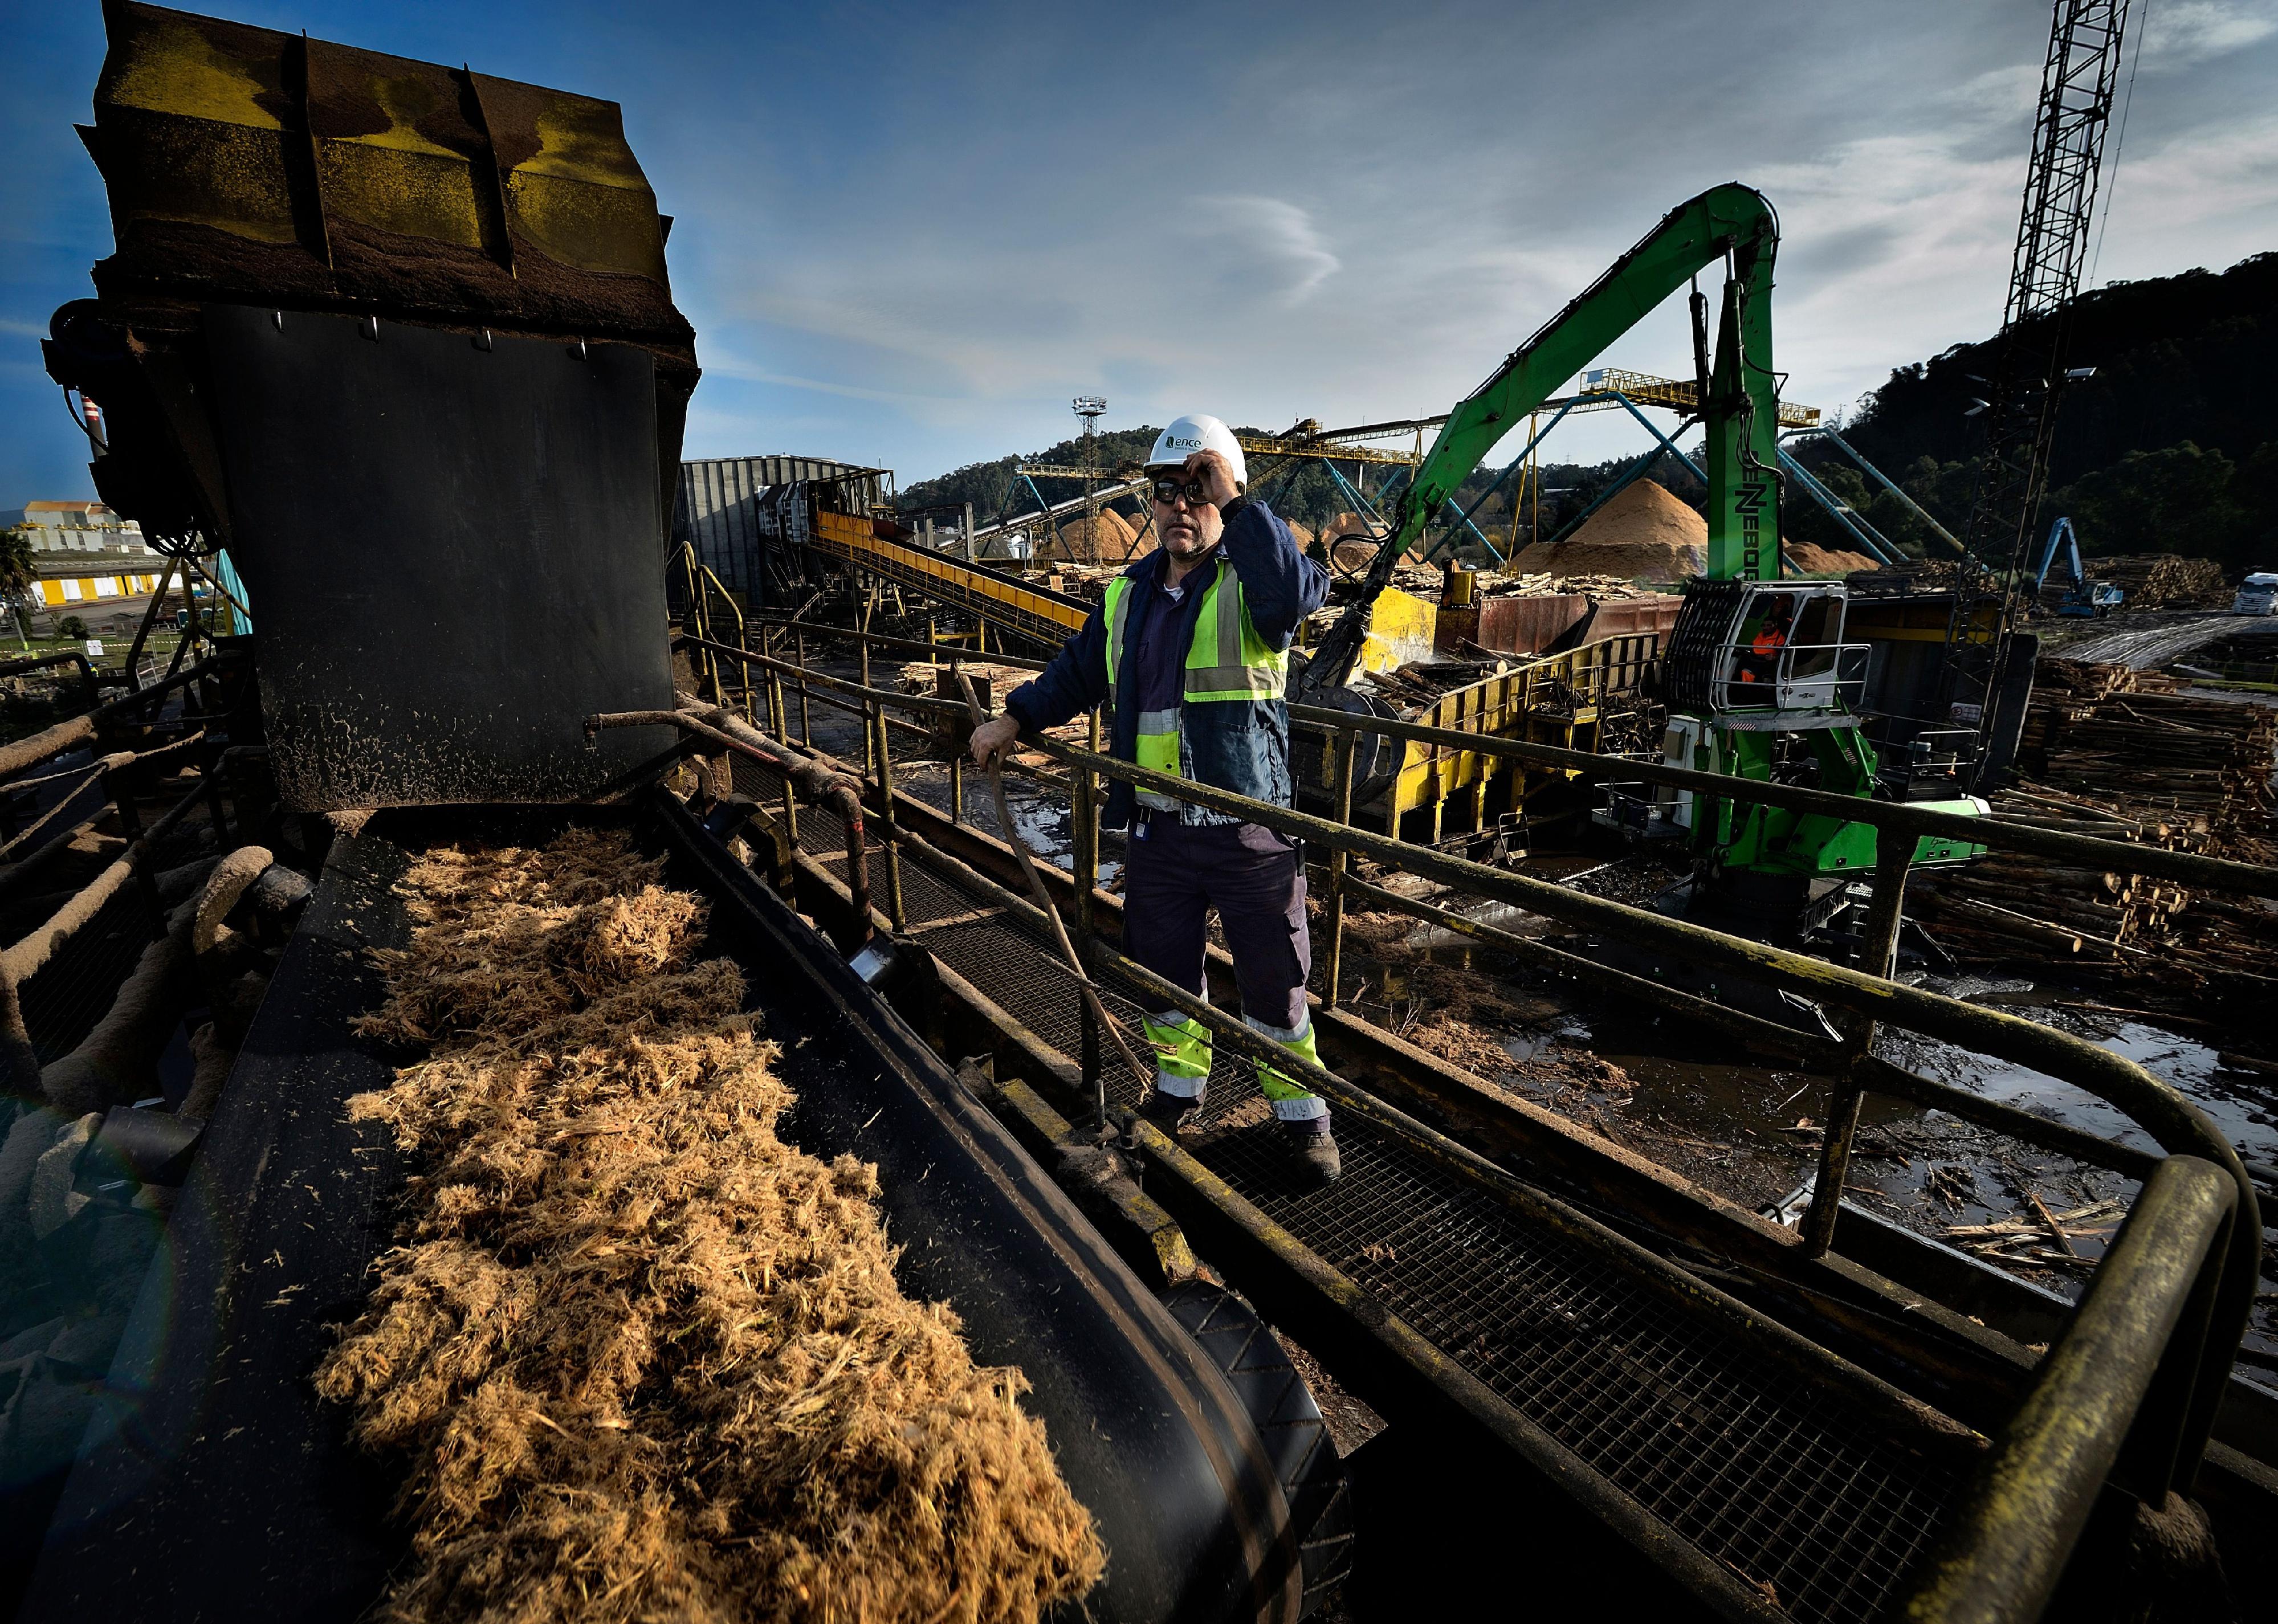
#7. Biomass (renewable)
- Total life cycle emissions: 52.0 grams CO2 equivalent per kilowatt-hour
--- One-time upstream: Not reported
--- Ongoing combustion: Not applicable
--- Ongoing noncombustion: Not reported
--- One-time downstream: Not reported
Up until the mid-1800s and the introduction of alternative means of energy, biomass was the main source of energy consumption in the U.S. It remains a relevant form of fuel used for heating and cooking in many developing countries. Biomass is an organic, renewable material derived from living sources, such as animals or plants. It can be produced with wood or wood waste; crops or agricultural waste; biogenic materials, such as cotton, wool, or paper; and animal manure or human sewage. Direct combustion is the most widely used method for converting biomass into energy. The fuels are burned directly to heat water, which generates electricity in steam turbines.
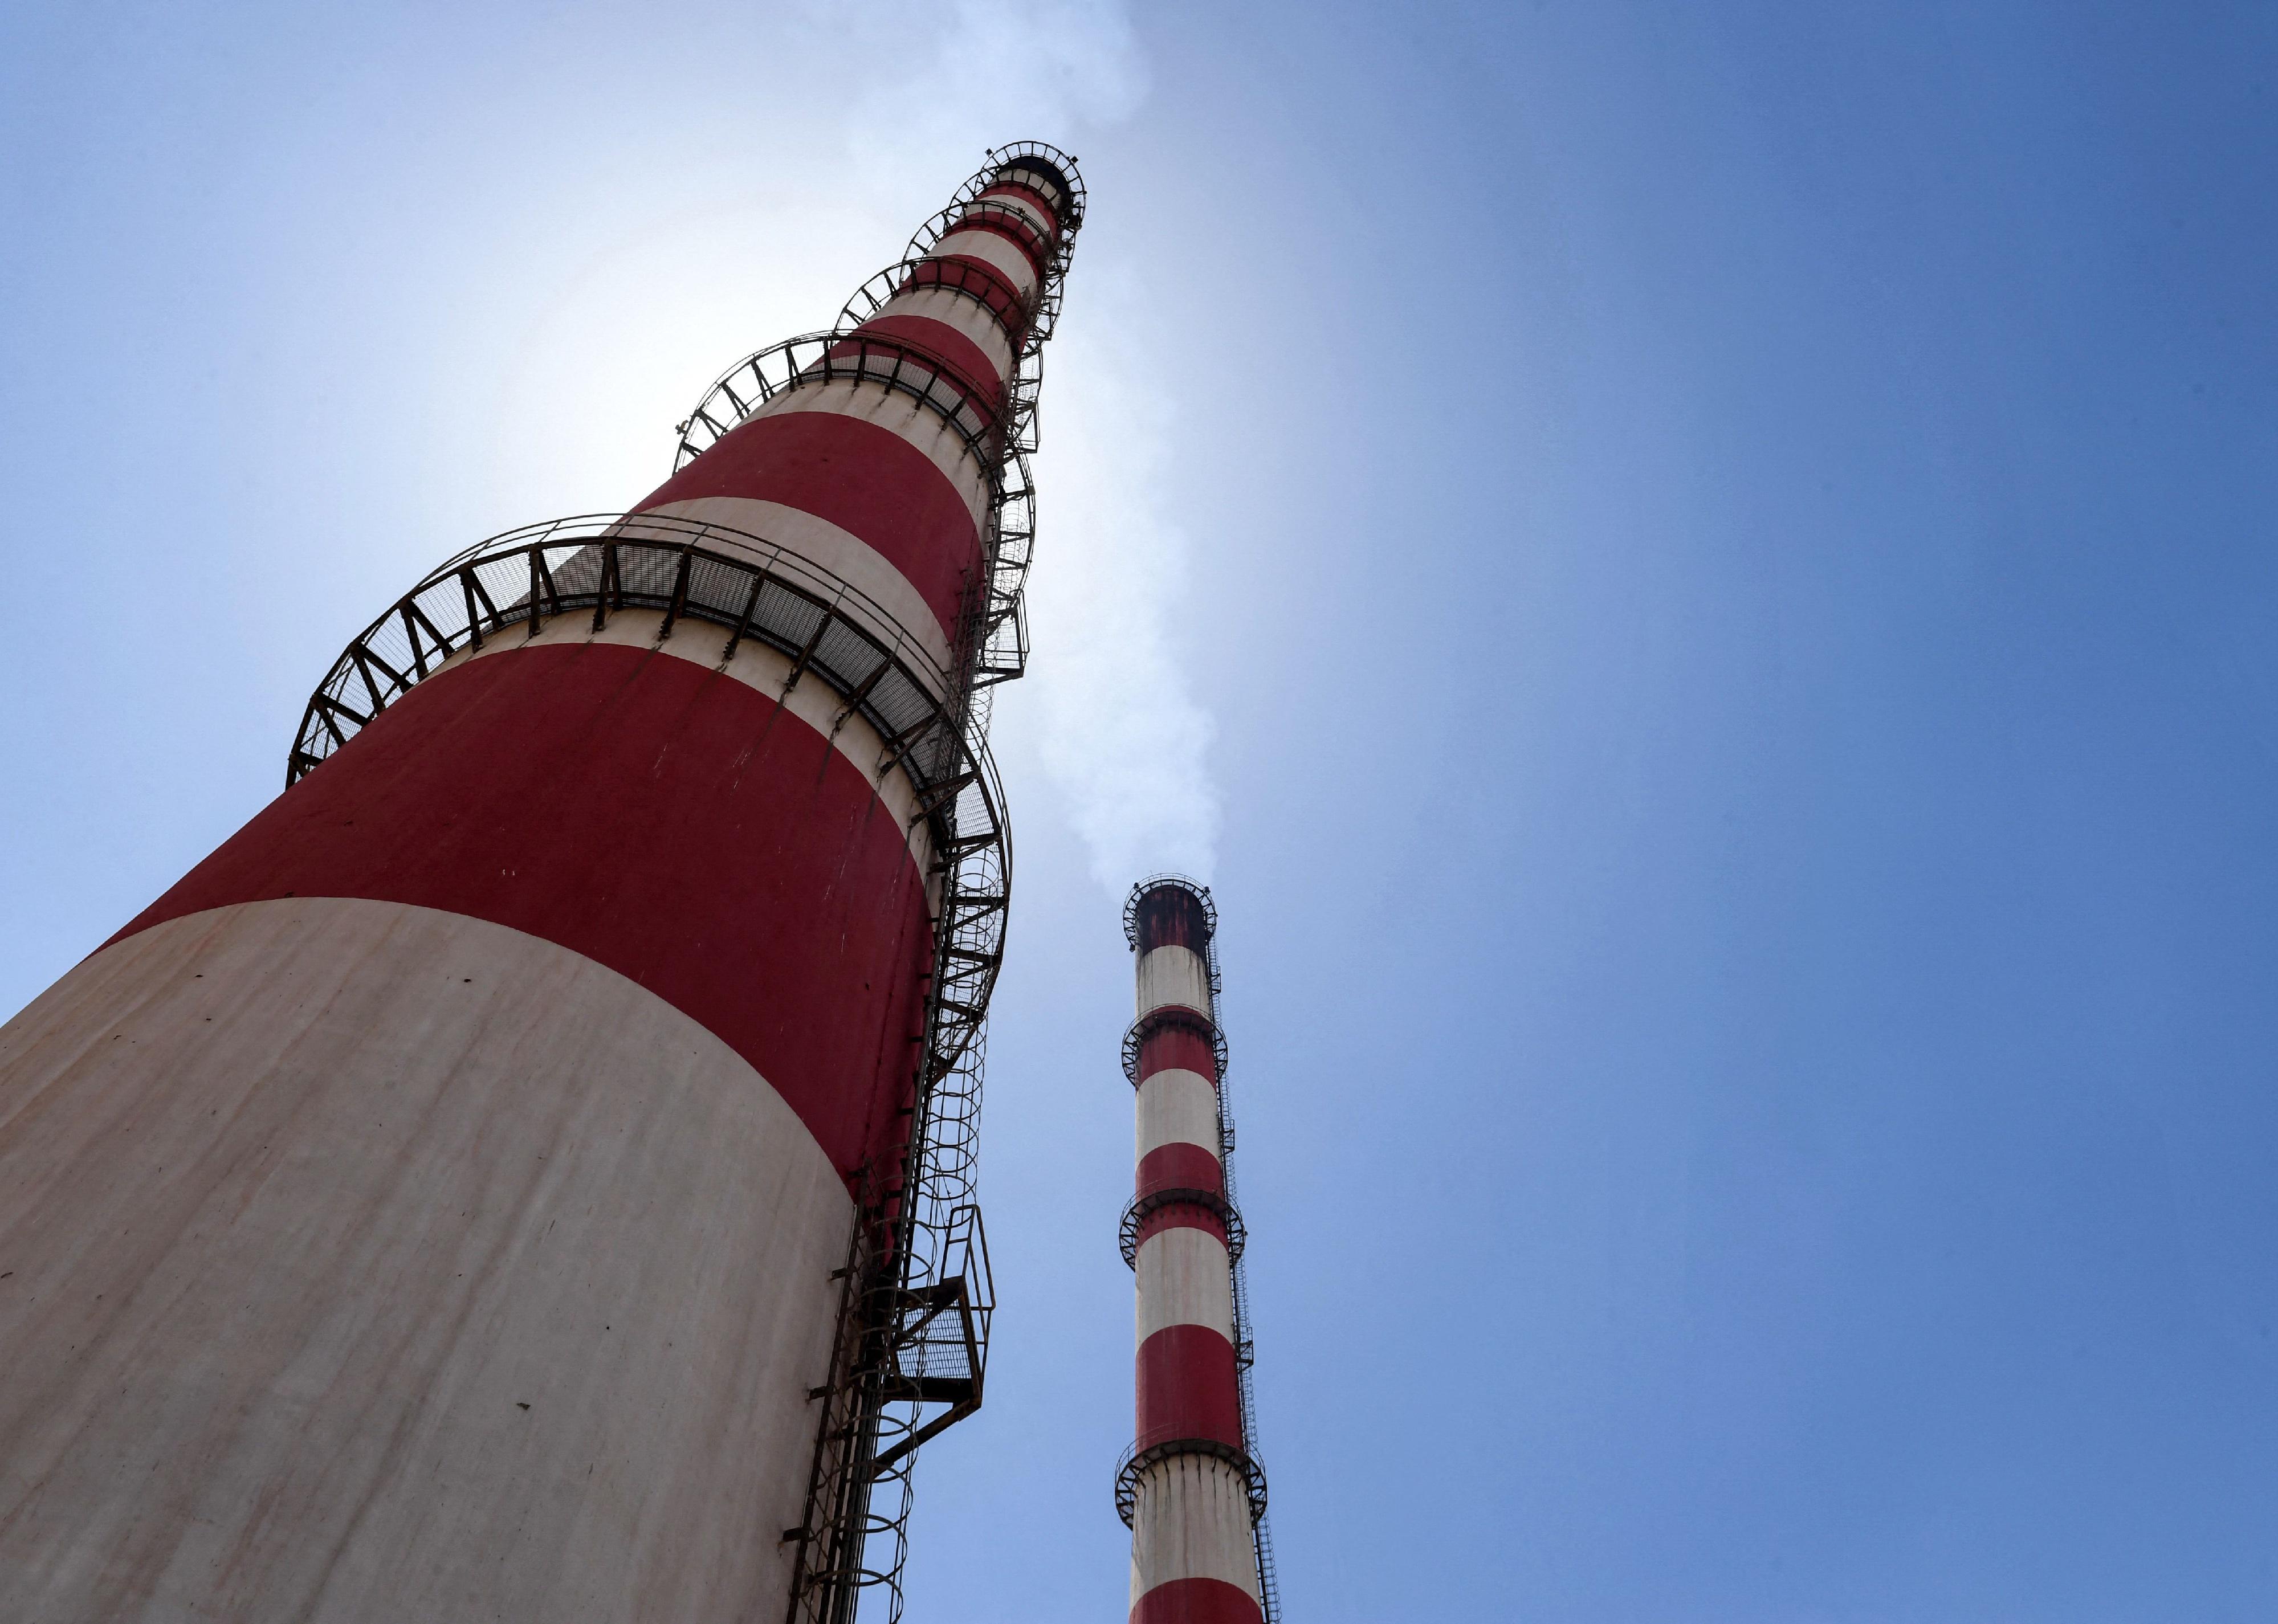
#8. Natural gas (nonrenewable)
- Total life cycle emissions: 486.0 grams CO2 equivalent per kilowatt-hour
--- One-time upstream: 0.8 grams
--- Ongoing combustion: 389.0 grams
--- Ongoing noncombustion: 71.0 grams
--- One-time downstream: 0.02 grams
The combustion of natural gas is one of the most polluting energy sources, and yet it is a cleaner option than oil and coal. It is abundant, especially in the U.S., with enough to last approximately 98 years as of 2020. Natural gas is easy and cheap to find and transport, therefore emitting very low greenhouse gas in its upstream phase. Natural gas emits half the CO2e of coal; therefore it has been proposed as a "bridge fuel" to support solar, wind, and other clean energies in the process of eventually phasing out the use of fossil fuels.
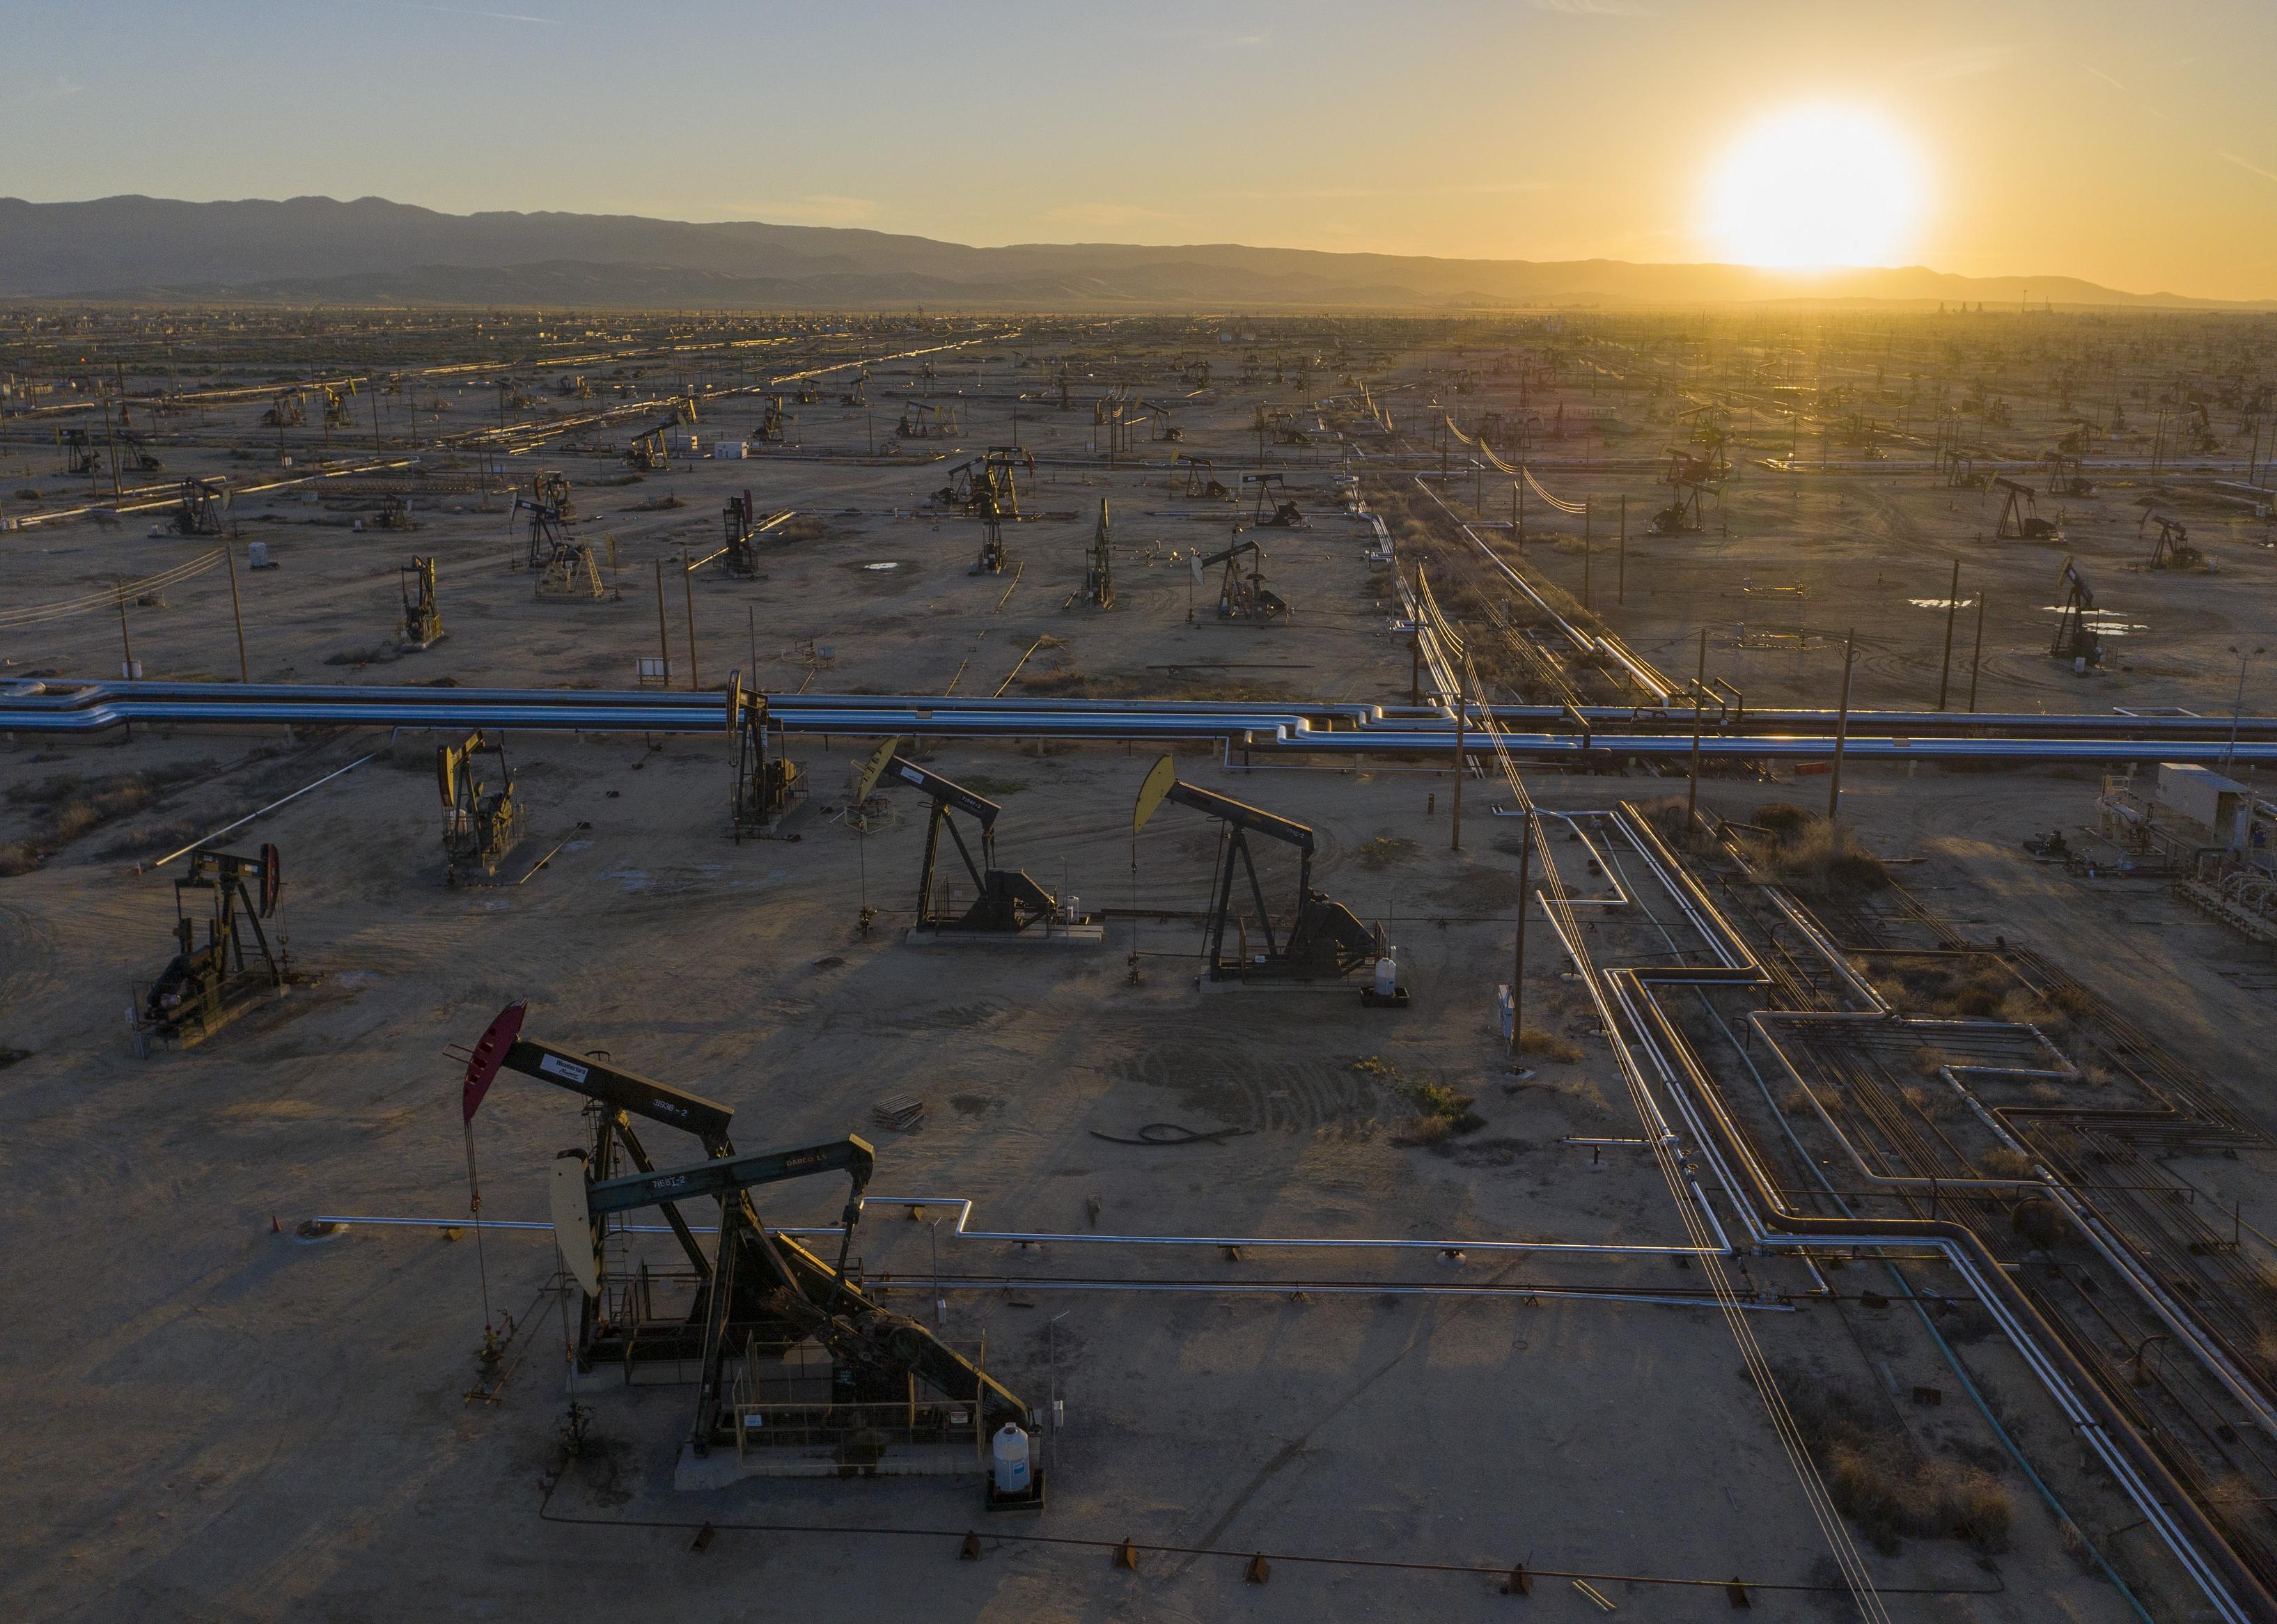
#9. Oil (nonrenewable)
- Total life cycle emissions: 840.0 grams CO2 equivalent per kilowatt-hour
--- One-time upstream: Not reported
--- Ongoing combustion: Not reported
--- Ongoing noncombustion: Not reported
--- One-time downstream: Not reported
To put numbers into perspective, oil-powered energy produces nearly twice the amount of CO2e per kilowatt-hour as natural gas and 40 times more than hydropower or concentrating solar power. Also, it is nonrenewable. Nevertheless, the consequences of petroleum extraction is the direct impact on the health and quality of life of communities living in areas near drilling facilities, particularly in countries with negligent oversight on oil corporations.
#10. Coal (nonrenewable)
- Total life cycle emissions: 1001.0 grams CO2 equivalent per kilowatt-hour
--- One-time upstream: less than 5.0 grams
--- Ongoing combustion: 1010.0 grams
--- Ongoing noncombustion: 10.0 grams
--- One-time downstream: < 5.0 grams
Coal mining and coal combustion are the main sources of CO2e related to electricity generation. The effects of methane gas produced by coal mining reach beyond Earth's atmosphere. Air pollution from coal-powered energy plants is blamed for heart and lung diseases, neurological problems, asthma, and cancer, among other severe ailments. The chemical reaction caused by the contact of water and rocks containing sulfur-bearing minerals in mines pollutes bodies of fresh water with heavy metals like copper, lead, and mercury. As a result, tracts of land used for grazing, crops, forests, and wildlife habitats become contaminated and thus not suitable for animal or human life.


