Stacker Studio

Top 10 best and worst foods for the environment

Written by:
September 8, 2021
Canva

This story originally appeared on Shelf Engine and was produced and distributed in partnership with Stacker Studio.

Top 10 best and worst foods for the environment

It goes without saying: Reducing your carbon footprint is an important and valuable goal. Whether that comes from switching to an electric car to ditching plastic straws, every little switch helps when it comes to lowering carbon in the atmosphere of a rapidly warming Earth.

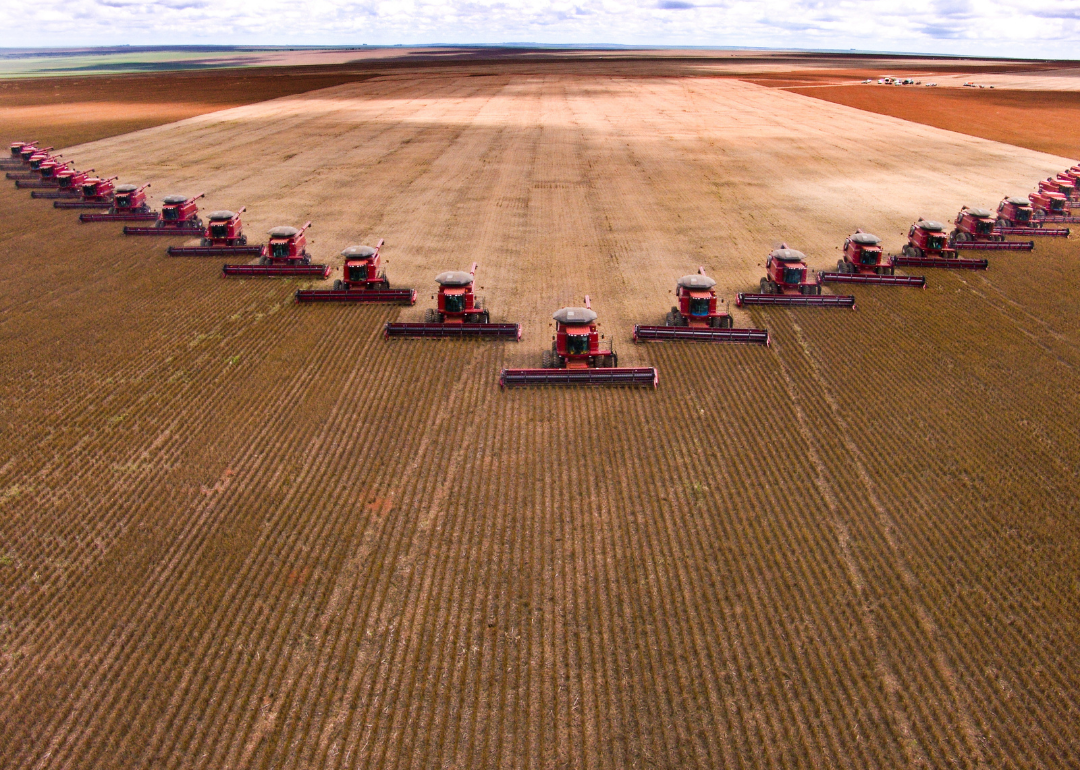
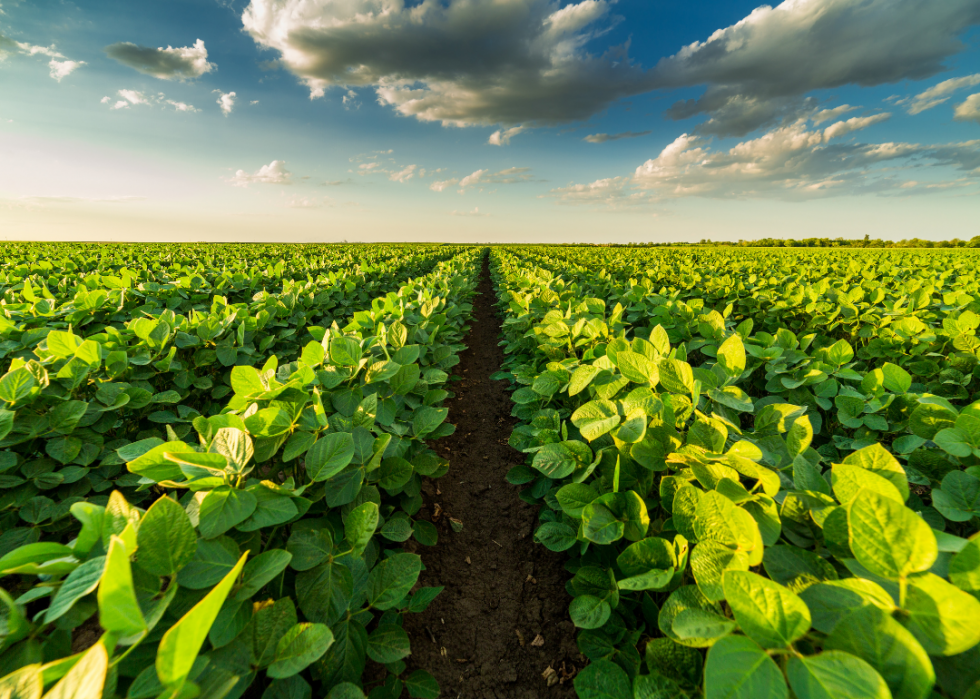
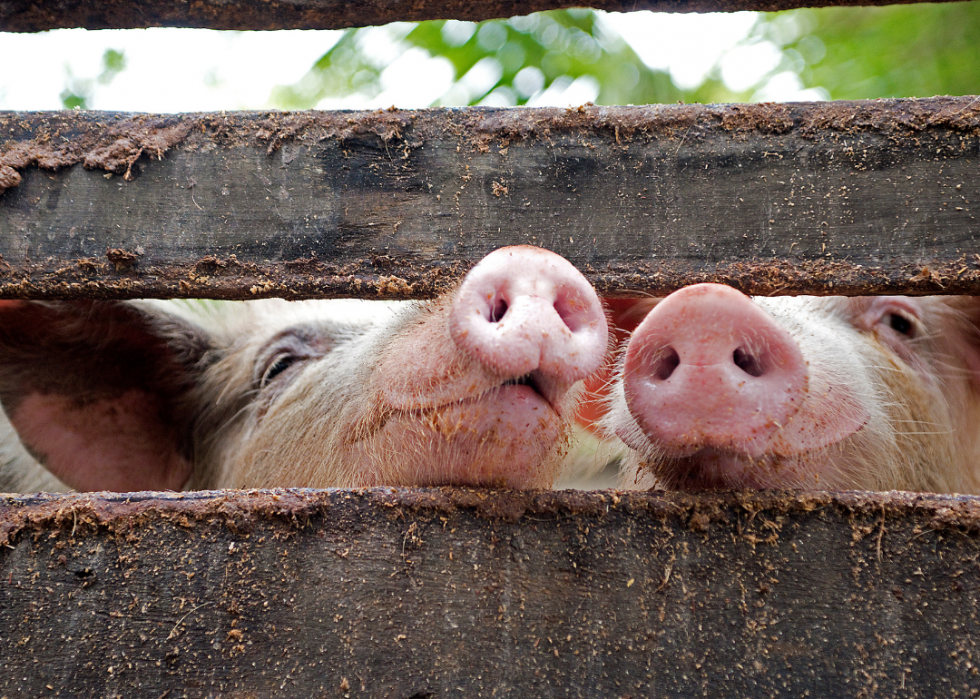
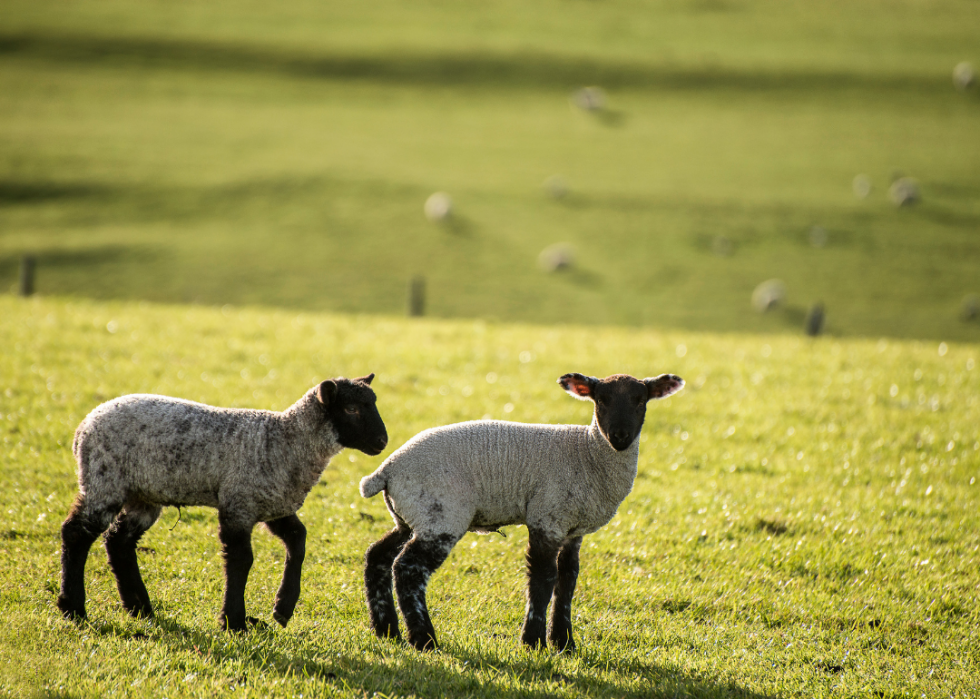
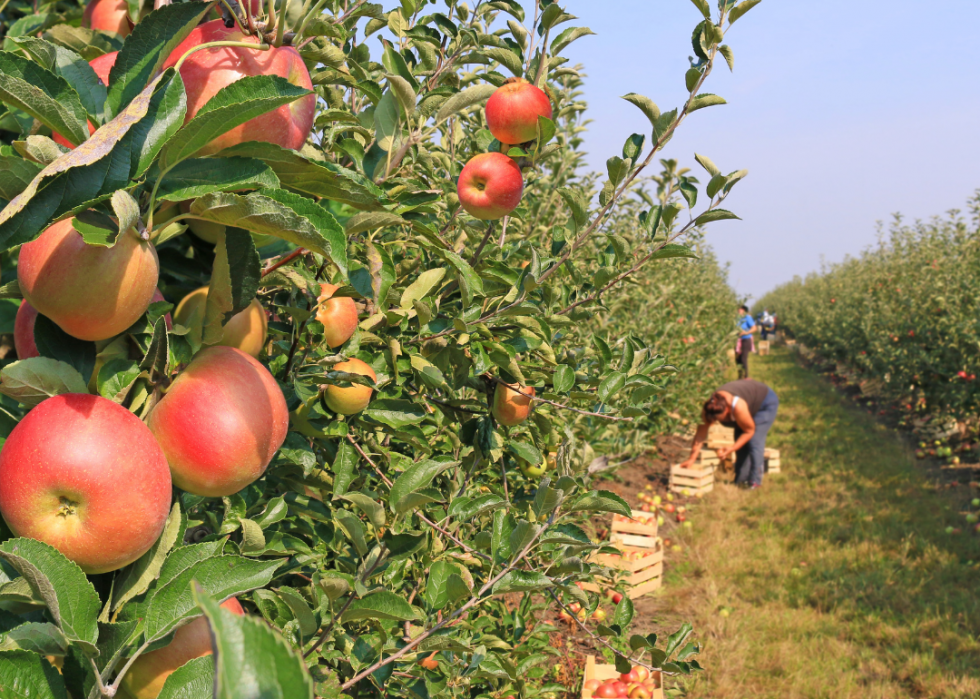
But when it comes to individual choices, one of the most important things you can do is consider carefully what you eat. Certain foods have very high carbon dioxide emissions, while others rank reliably low. Some of the most common offenders on the emissions scale are meat and dairy products. Nuts and vegetables come in much lower, partially because of the animal products they can replace. Some climate researchers have said switching to plant-based diets is the single most important thing an individual can do to impact climate change.

It’s known about 71% of carbon emissions contributing to climate change come from large corporations. But the individual can still play a role in keeping the planet safe. The average American family of four emits more carbon dioxide with regular meat consumption than by driving two cars. In addition to diet changes, consumers can push these corporations to improve their practices, potentially shifting the narrative more. Every conscious act makes a difference for the planet, no matter how small.

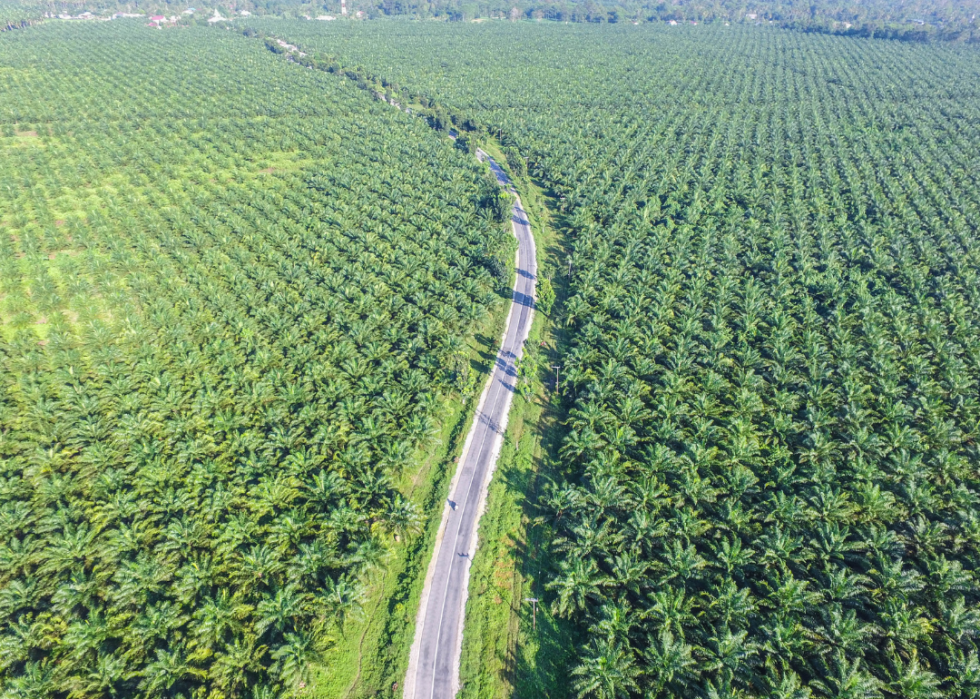
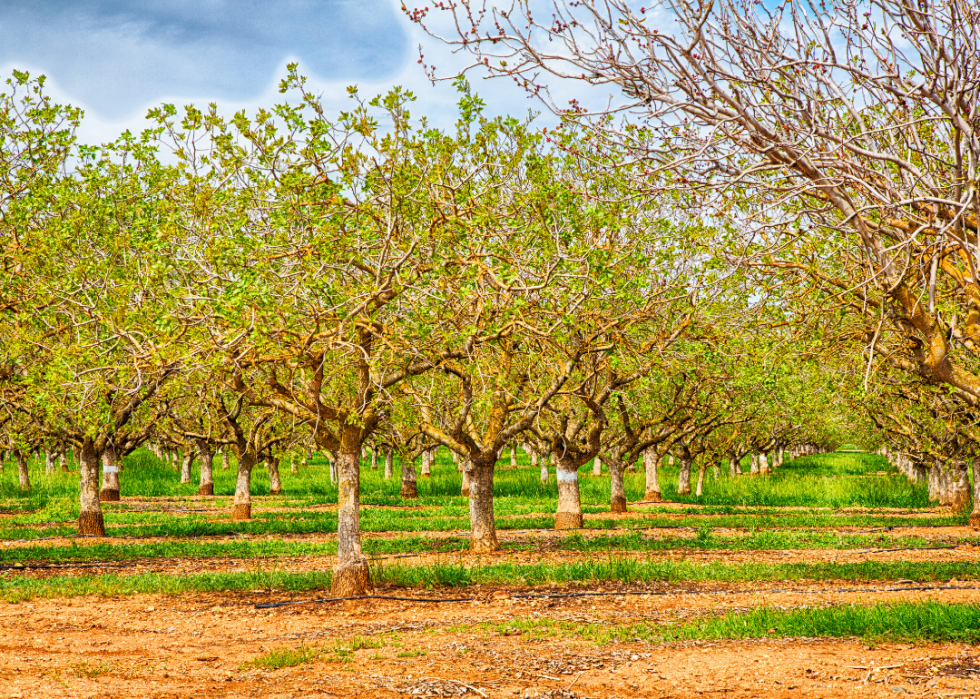
To find the foods with the most and least greenhouse gas emissions, Shelf Engine analyzed data from a 2018 study published in the journal Science. The data was collected through a comprehensive meta-analysis of 570 studies “covering 38,700 commercially viable farms in 119 countries and 40 products representing 90% of global protein and calorie consumption.” Greenhouse gas emissions are measured in kilograms of carbon dioxide equivalents (kgCO2eq) per kilogram of food. This means non-CO2 greenhouse gases are also included in terms of their warming impact. Any ties have been kept. Note some sources of emissions may be negative. For example, nuts emit -2.05kg emissions as a result of land use.

1 / 20
Canva

#10 (highest): Soybean oil

- Total greenhouse gas emission (per kg of food): 6.12 kg
- #1 source: Land use (3.10 kg)
- #2 source: Farming (1.52 kg)

Deforestation is one of the primary ways in which soybean oil generates greenhouse gases. Forests are cleared around the world to create fields to grow soybeans, which means there is less forest available to take carbon out of the atmosphere. Soy is also often harvested and produced mechanically, which adds to its carbon footprint. It’s important to note one positive facet of soy growth, however. Eating a plant-based diet, in which soy often replaces animal products, benefits the environment far more than growing soy harms it.

2 / 20
Canva

#9 (highest): Pig meat

- Total greenhouse gas emission (per kg of food): 7.28 kg
- #1 source: Feed (2.94 kg)
- #2 source: Farming (1.69 kg)

While pig farming might not seem to be very energy intensive, there’s a sneaky culprit behind its high carbon footprint. Methane pigs produce as part of digestion contributes significantly to their greenhouse gas emissions. Manure management also plays a role. The energy required to work with all the manure generated by the animals also releases carbon into the atmosphere. Streamlining manure management is one way to potentially reduce greenhouse gases from pig meat.

3 / 20
Canva

#8 (highest): Palm oil

- Total greenhouse gas emission (per kg of food): 7.61 kg
- #1 source: Land use (3.10 kg)
- #2 source: Farming (2.11 kg)

Palm oil is an inexpensive oil used in food, cosmetics, and biofuels with a high carbon footprint. But an interesting caveat applies to the greenhouse gas impact of palm oil. Studies have found that new palm oil plantations have twice the emissions of mature ones. This is partially because of what is required for new plantations. The habitats that are often cleared to produce palm oil are carbon-sucking forests, which increases the negative environmental impact of planting these new palm oil plantations.

4 / 20
Canva

#7 (highest): Crustaceans (farmed)

- Total greenhouse gas emission (per kg of food): 11.85 kg
- #1 source: Farming (8.38 kg)
- #2 source: Feed (2.51 kg)

The primary factor that determines the carbon impact of seafood is fuel. Large boats traveling long distances to catch non-local fish are going to leave a higher carbon footprint than smaller boats going out for local catches. How the fish is processed also matters. Fish that is sent to another location far away for processing, and then shipped to be sold releases more greenhouse gases. Seafoods with the lowest carbon footprint tend to be those that are typically harvested manually, such as clams.

5 / 20
Canva

#6 (highest): Coffee

- Total greenhouse gas emission (per kg of food): 16.48 kg
- #1 source: Farming (10.39 kg)
- #2 source: Land use (3.69 kg)

Transportation is one of the major ways that coffee has a negative impact on the environment. Many countries that grow coffee beans are far from markets like the United States. These countries include Vietnam and Brazil. The fuel required to fly or ship coffee beans to markets further afield has a major carbon impact. Another culprit? The land that is deforested to grow coffee beans contributes to a higher carbon footprint.

6 / 20
Canva

#5 (highest): Dark chocolate

- Total greenhouse gas emission (per kg of food): 18.68 kg
- #1 source: Land use (14.31 kg)
- #2 source: Farming (3.71 kg)

Two of the major reasons chocolate has a negative impact on the environment are milk and cocoa. These two ingredients are combined with others to make chocolate. Milk and cocoa both have high carbon footprints, from the methane produced by cows and the deforestation that occurs to plant cocoa. Palm oil is another ingredient used for chocolate production that’s hard to square with concern for the climate because of its contribution to deforestation.

7 / 20
Canva

#4 (highest): Bovine meat (dairy herd)

- Total greenhouse gas emission (per kg of food): 21.09 kg
- #1 source: Farming (15.69 kg)
- #2 source: Feed (2.51 kg)

Bovine meat contributes to greenhouse gases much like pig meat does. Methane is produced as part of digestion in the farming of these animals. Each year, a cow will belch 220 pounds of methane. Studies have found that methane from cows is shorter lived than carbon dioxide, but far more potent in warming the atmosphere. Climate activists have long argued that reducing dairy consumption—particularly milk produced by cows—is key to halting global warming.

8 / 20
Canva

#3 (highest): Cheese

- Total greenhouse gas emission (per kg of food): 21.24 kg
- #1 source: Farming (13.06 kg)
- #2 source: Land use (4.46 kg)

What’s one reason cheese is high on the list of carbon producers? Cows. Yes, the same cows responsible for those 220 pounds of methane belched a year. Milk is one of the primary ingredients in cheese. And as such, making cheese generates a significant amount of carbon.

9 / 20
Canva

#2 (highest): Lamb and mutton

- Total greenhouse gas emission (per kg of food): 24.42 kg
- #1 source: Farming (19.51 kg)
- #2 source: Feed (2.37 kg)

Lamb and mutton have a surprising carbon impact relative to beef. Although their overall methane production and feed requirements are similar, lamb has a high impact because less of the animal is traditionally consumed relative to beef. However, only around 1% of Americans eat lamb regularly. This means that lamb does not contribute significantly to greenhouse gas emissions in the United States.

10 / 20
Canva

#1 (highest): Bovine meat (beef herd)

- Total greenhouse gas emission (per kg of food): 59.57 kg
- #1 source: Farming (39.39 kg)
- #2 source: Land use (16.28 kg)

Beef has the highest carbon footprint of any food. This is because of what is required to raise and farm cattle. Animals used for beef production require a tremendous amount of feed, which must be grown on its own. They also produce an extremely significant amount of methane. Climate scientists often urge those who don’t want to be full vegans to simply switch to vegetarianism or cut out red meat, so dramatic is the impact of bovine meat on the environment.

11 / 20
Canva

#10 (lowest): Soy milk

- Total greenhouse gas emission (per kg of food): 0.91 kg
- #1 source: Retail (0.27 kg)
- #2 source: Land use (0.18 kg)

One of soy milk’s biggest benefits for the environment is what it can be used as a substitute. Those looking to make the switch away from cow’s milk can use soy milk instead. The land footprint required for cow’s milk far outstrips that for soy. Further, soy can also be used for other purposes, meaning that less will be wasted. Among these other purposes? Feed for livestock.

12 / 20
Canva

#9 (lowest): Peas

- Total greenhouse gas emission (per kg of food): 0.90 kg
- #1 source: Farming (0.72 kg)
- #2 source: Transport (0.10 kg)

The carbon footprint of peas is almost 50 times lower than what goes into a beef burger. Peas can also be used in a variety of surprising swaps. One such swap is—you guessed it—milk, as pea milk has become an alternative for those looking to go non-dairy. And when cocktail hour comes around, peas become a substitute as well. Gin is traditionally produced with wheat, which has a high carbon footprint, but it can also be made with peas.

13 / 20
Canva

#8 (lowest): Bananas

- Total greenhouse gas emission (per kg of food): 0.68 kg
- #1 source: Transport (0.29 kg)
- #2 source: Farming (0.27 kg)

Bananas are carbon friendly fruits for a number of reasons, including the fact they grow in direct sunlight. Bananas are not required to be grown in hothouses, which use a tremendous amount of energy. They also keep and store well during transport. This means instead of flying them to their destinations, bananas can often be shipped, which dramatically decreases the carbon footprint.

14 / 20
Canva

#7 (lowest): Brassicas

- Total greenhouse gas emission (per kg of food): 0.44 kg
- #1 source: Farming (0.28 kg)
- #2 source: Transport (0.10 kg)

Brassicas are a category of food including broccoli, brussels sprouts, and cauliflower. Why are they relatively low in carbon emissions? They are lower because only some of the plant is used. Parts of the biomass of brassica vegetables are not harvested and are returned to the earth—essentially composted. This reduces their overall carbon load, as the returned parts of the vegetable integrate back into the soil.

15 / 20
Canva

#6 (lowest): Onions and leeks

- Total greenhouse gas emission (per kg of food): 0.40 kg
- #1 source: Farming (0.21 kg)
- #2 source: Transport (0.10 kg)

Onions have some of the lowest carbon emissions of any vegetable. And so do leeks, their close cousins. So long as organic methods are used, the impact of growing onions is negligible. This is because they don’t damage the air, water, or forestation for growing. The same can be said for leeks.

16 / 20
Canva

#5 (lowest): Potatoes

- Total greenhouse gas emission (per kg of food): 0.37 kg
- #1 source: Farming (0.19 kg)
- #2 source: Transport (0.09 kg)

Most of the carbon emissions from potatoes come from how they are cooked. For example, potatoes that are fried have a lower carbon footprint than those that are baked since baking takes more time and therefore more energy. In some countries, particularly the United States, french fries are relatively common. Therefore, this less carbon intensive way of cooking leads to lower emissions.

17 / 20
Canva

#4 (lowest): Root vegetables

- Total greenhouse gas emission (per kg of food): 0.37 kg
- #1 source: Farming (0.15 kg)
- #2 source: Transport (0.11 kg)

Root vegetables include tubers such as carrots and turnips. They have such a low carbon impact that researchers are turning to root vegetables for surprising uses. These include potentially using them to make cement. Cement has a high carbon footprint because it is so labor-intensive to produce. Researchers are exploring whether root vegetables—along with plastic containers—could be used to make eco-friendly concrete.

18 / 20
Canva

#3 (lowest): Apples

- Total greenhouse gas emission (per kg of food): 0.36 kg
- #1 source: Farming (0.23 kg)
- #2 source: Transport (0.10 kg)

When grown locally in season, an apple has quite a low carbon footprint. This is because apples are grown on trees. Trees draw carbon in from the environment, reducing overall carbon in the atmosphere. And harvesting apples is as simple—and pleasurable—as picking them off a tree. Very little waste is involved, which is part of its low carbon impact.

19 / 20
Canva

#2 (lowest): Citrus fruit

- Total greenhouse gas emission (per kg of food): 0.32 kg
- #1 source: Farming (0.31 kg)
- #2 source: Transport (0.09 kg)

Much like apples, citrus fruits are grown on trees and have a lower carbon footprint. Harvesting also simply requires picking the fruits. One of the key caveats depends on what is done with the fruits after they are picked. If they are turned into fruit juice, the type of packaging will impact the carbon footprint. For instance, packaging orange juice into a plastic container will increase its carbon footprint.

20 / 20
Canva

#1 (lowest): Nuts

- Total greenhouse gas emission (per kg of food): 0.28 kg
- #1 source: Farming (2.13 kg)
- #2 source: Packaging (0.08 kg)

One of the primary reasons nuts have a low carbon footprint is because of what they replace. Nuts can be substituted for a variety of dairy products. For instance, almond and cashew milk can be used to replace cow’s milk, which has a very high carbon footprint. Nuts are also making inroads into cheese production. Cashew cheese, for example, can be used instead of milk in the production of cheese. All nuts are not created the same, however, and some are more carbon footprint friendly depending on how they are grown and are used for consumer products.


This story originally appeared on Shelf Engine and was produced and distributed in partnership with Stacker Studio. 

Trending Now