Georges_Creations // Shutterstock
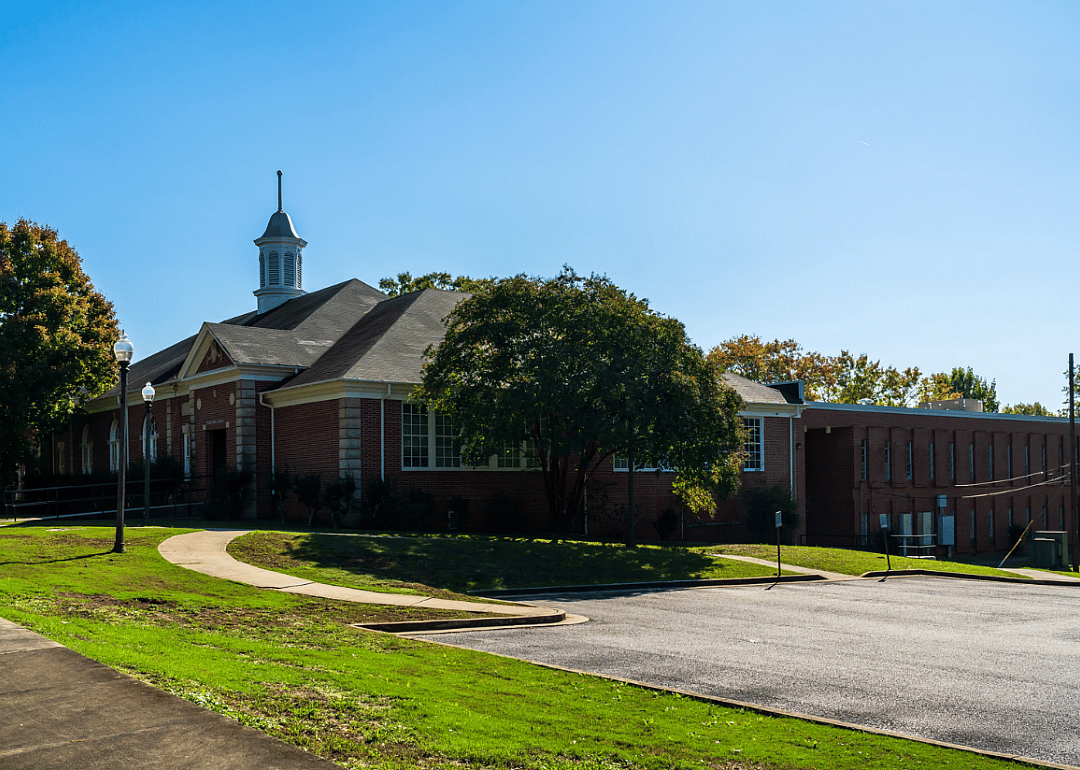
1 / 20#20. Spalding County
- Bridges in poor condition: 5.7% (5 of 87 bridges)
- Square meters of bridges in poor condition: 2.0% (716 of 36,077 square meters of bridges)

One in three U.S. bridges is in need of repair or replacement, according to data from the American Road & Transportation Builders Association, including 29% of interstate bridges. The cost to make these repairs is estimated to be in excess of $54 billion.
Stacker investigated which counties in Georgia have the most bridges in dire need of repair using data from the Federal Highway Administration. The data is accurate as of June 15, 2022. Counties are ranked by percent of bridges in "poor" condition and ties are broken by percent square meters of bridges in poor condition. Counties that have no bridges or have no bridges in poor condition are excluded from the list.
You may also like: Hottest months in Georgia since 1895
Georges_Creations // Shutterstock
1 / 20- Bridges in poor condition: 5.7% (5 of 87 bridges)
- Square meters of bridges in poor condition: 2.0% (716 of 36,077 square meters of bridges)

Canva
2 / 20- Bridges in poor condition: 5.9% (4 of 68 bridges)
- Square meters of bridges in poor condition: 1.4% (163 of 11,486 square meters of bridges)
Georges_Creations // Shutterstock
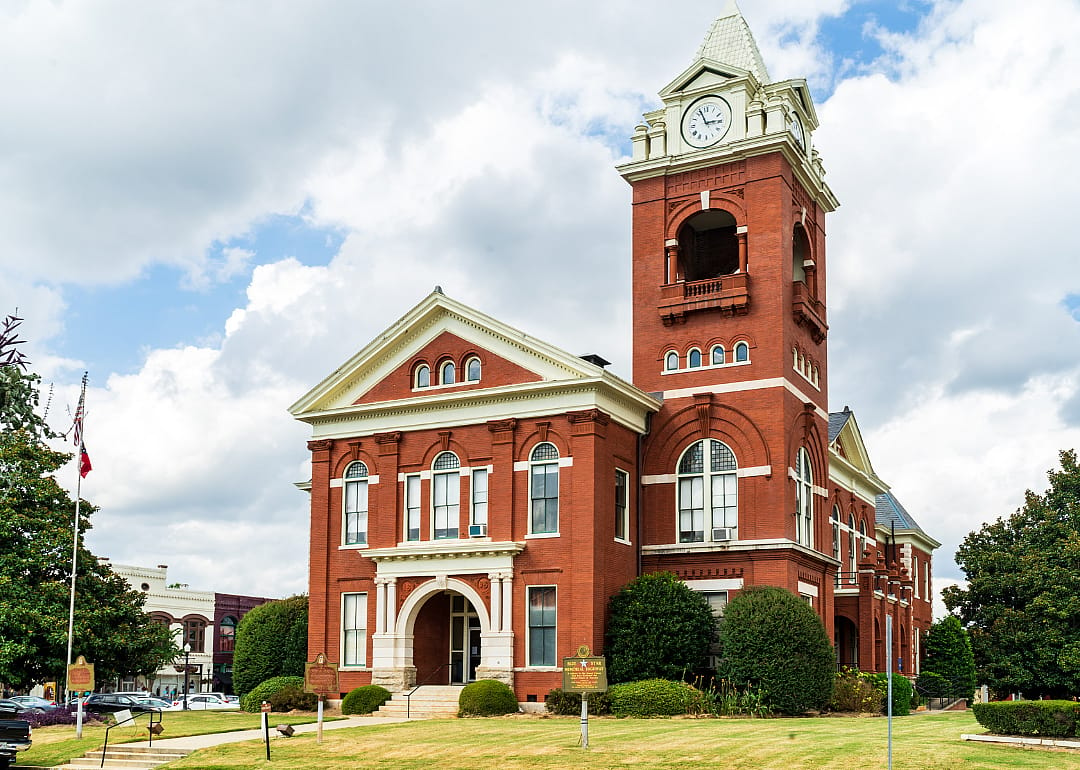
3 / 20- Bridges in poor condition: 6.5% (3 of 46 bridges)
- Square meters of bridges in poor condition: 0.6% (165 of 27,025 square meters of bridges)

Canva
4 / 20- Bridges in poor condition: 6.5% (3 of 46 bridges)
- Square meters of bridges in poor condition: 1.0% (157 of 15,758 square meters of bridges)
Canva
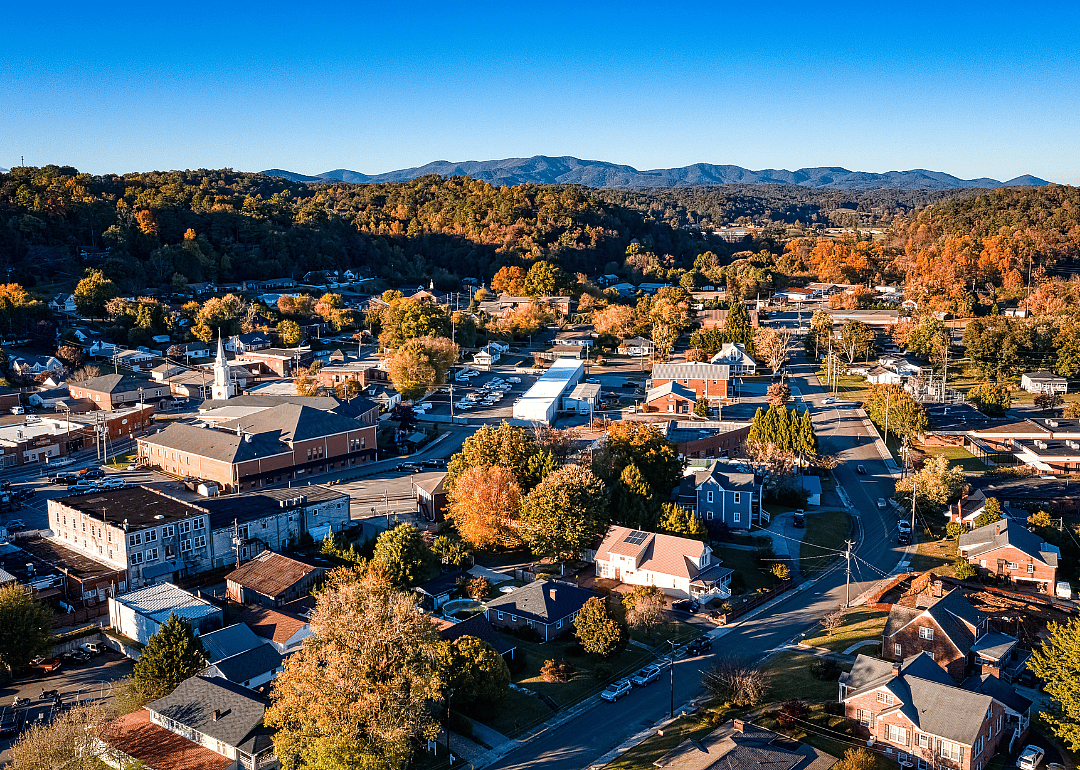
5 / 20- Bridges in poor condition: 6.9% (7 of 101 bridges)
- Square meters of bridges in poor condition: 3.5% (1,137 of 32,689 square meters of bridges)
You may also like: As more states adopt traffic enforcement cameras, here's where Georgia stands
SevenMaps // Shutterstock
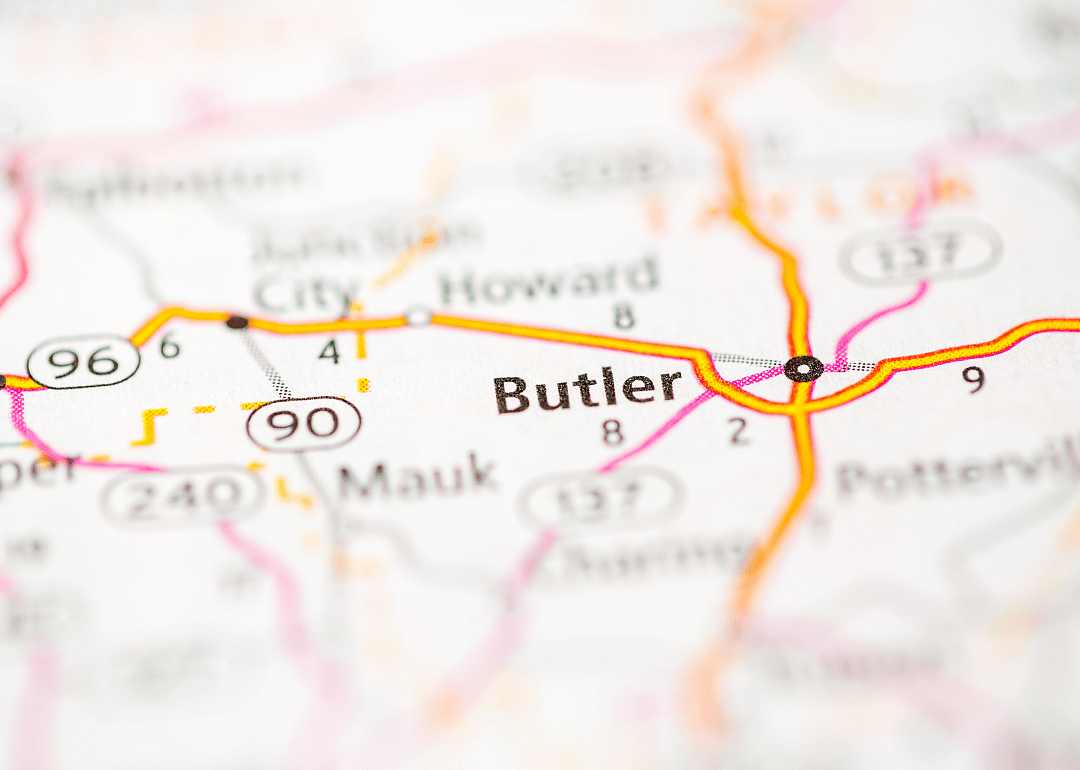
6 / 20- Bridges in poor condition: 7.0% (5 of 71 bridges)
- Square meters of bridges in poor condition: 3.4% (1,807 of 53,503 square meters of bridges)
Tony Cantrell // Shutterstock
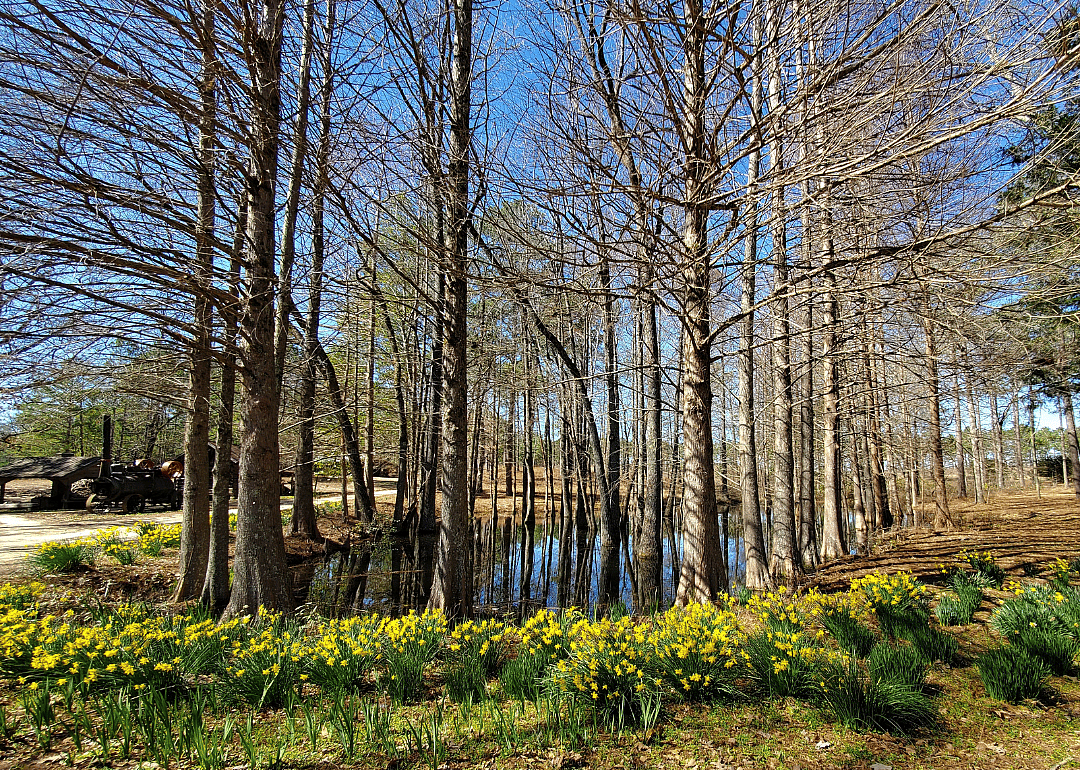
7 / 20- Bridges in poor condition: 7.4% (5 of 68 bridges)
- Square meters of bridges in poor condition: 4.4% (832 of 18,869 square meters of bridges)

Canva
8 / 20- Bridges in poor condition: 7.4% (5 of 68 bridges)
- Square meters of bridges in poor condition: 7.0% (1,062 of 15,139 square meters of bridges)
Roberto Galan // Shutterstock
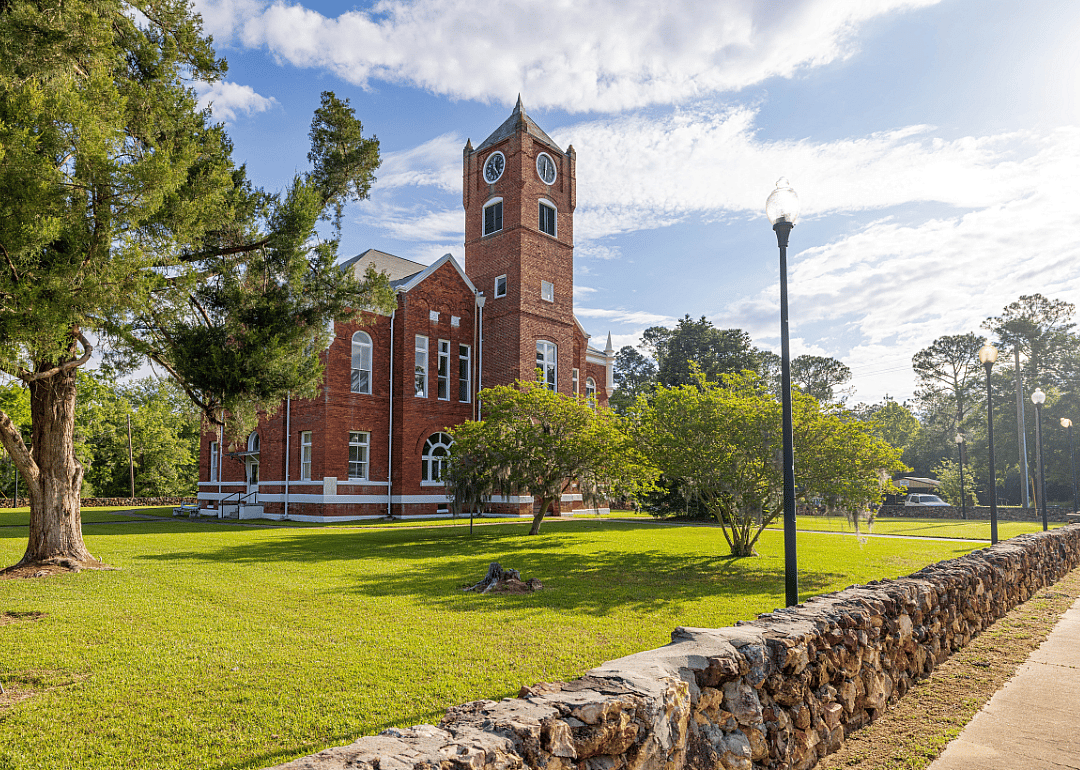
9 / 20- Bridges in poor condition: 7.4% (2 of 27 bridges)
- Square meters of bridges in poor condition: 1.7% (448 of 26,774 square meters of bridges)
Canva
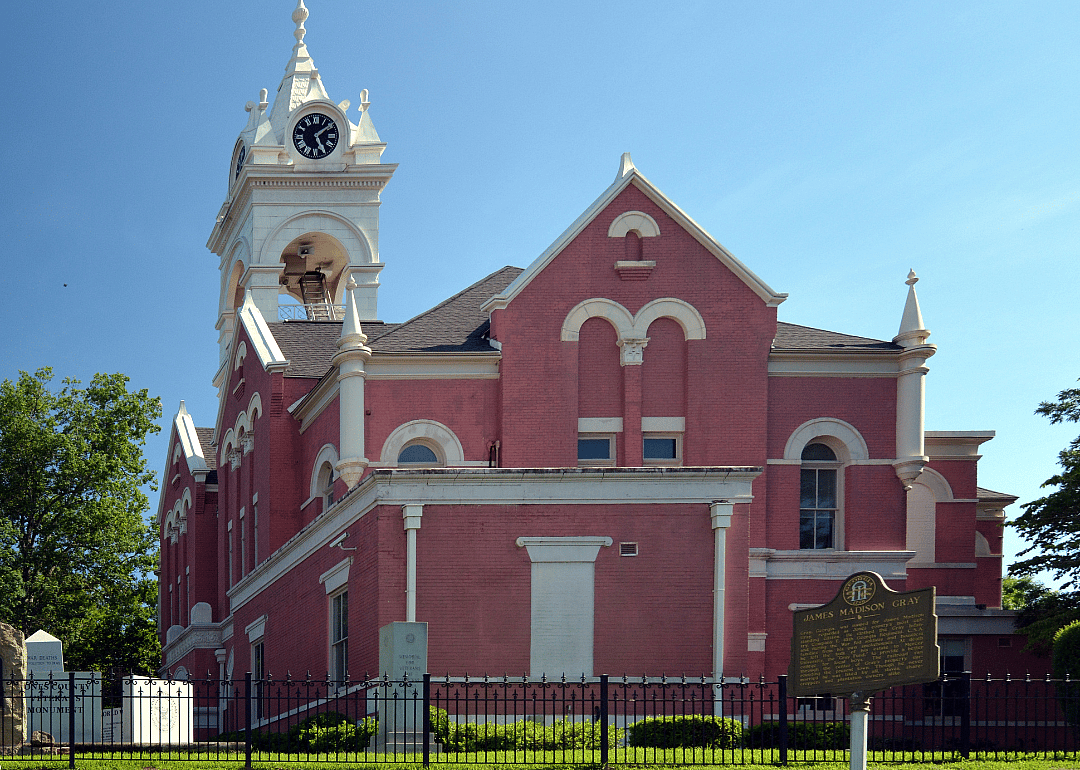
10 / 20- Bridges in poor condition: 7.4% (4 of 54 bridges)
- Square meters of bridges in poor condition: 6.0% (899 of 14,875 square meters of bridges)
You may also like: See the most extreme temperatures in Georgia history
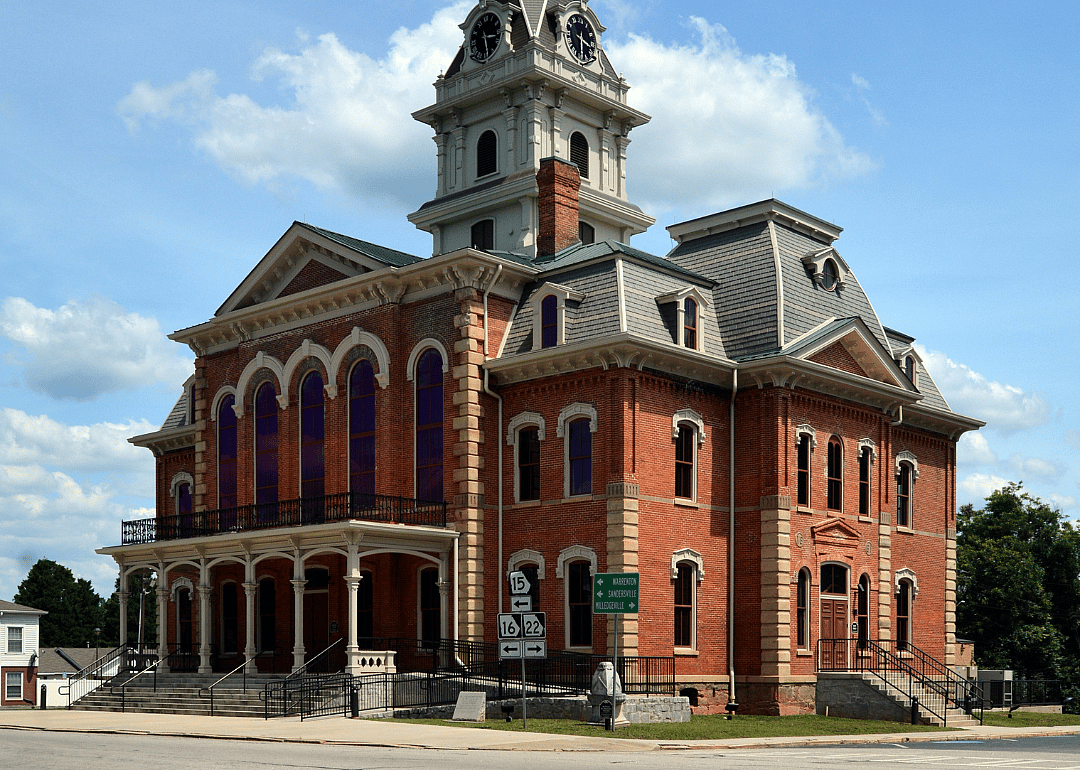
Canva
11 / 20- Bridges in poor condition: 7.8% (5 of 64 bridges)
- Square meters of bridges in poor condition: 3.1% (484 of 15,629 square meters of bridges)
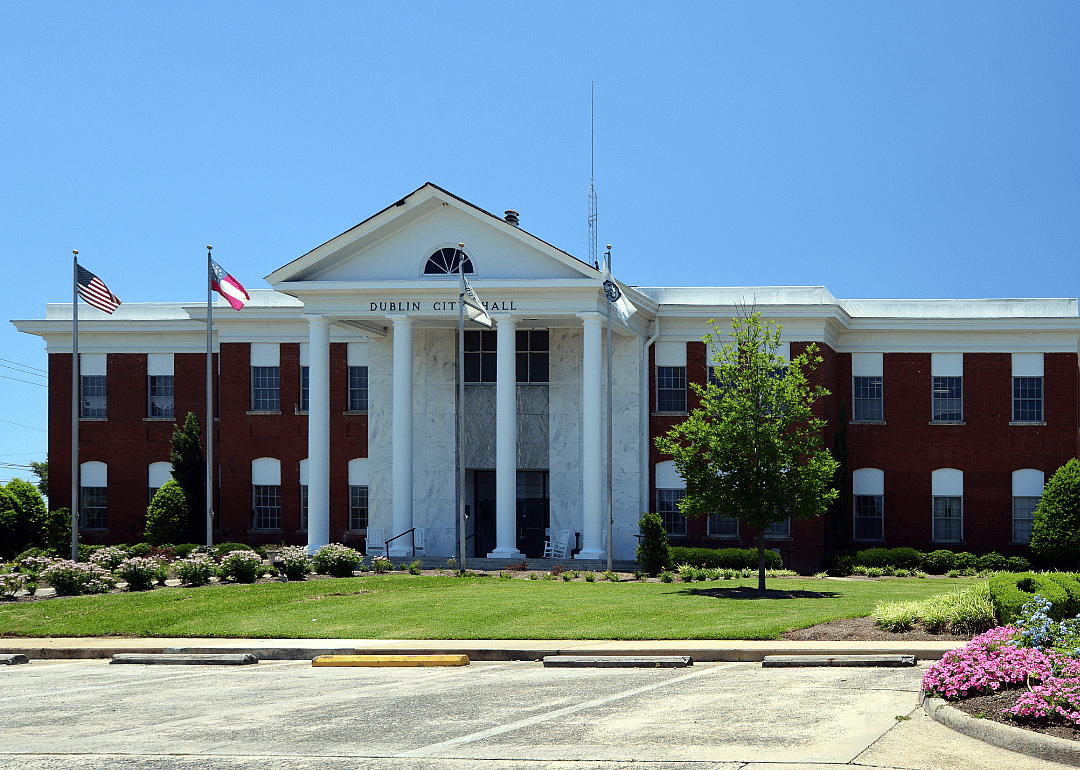
Canva
12 / 20- Bridges in poor condition: 8.7% (15 of 173 bridges)
- Square meters of bridges in poor condition: 3.2% (3,129 of 97,699 square meters of bridges)
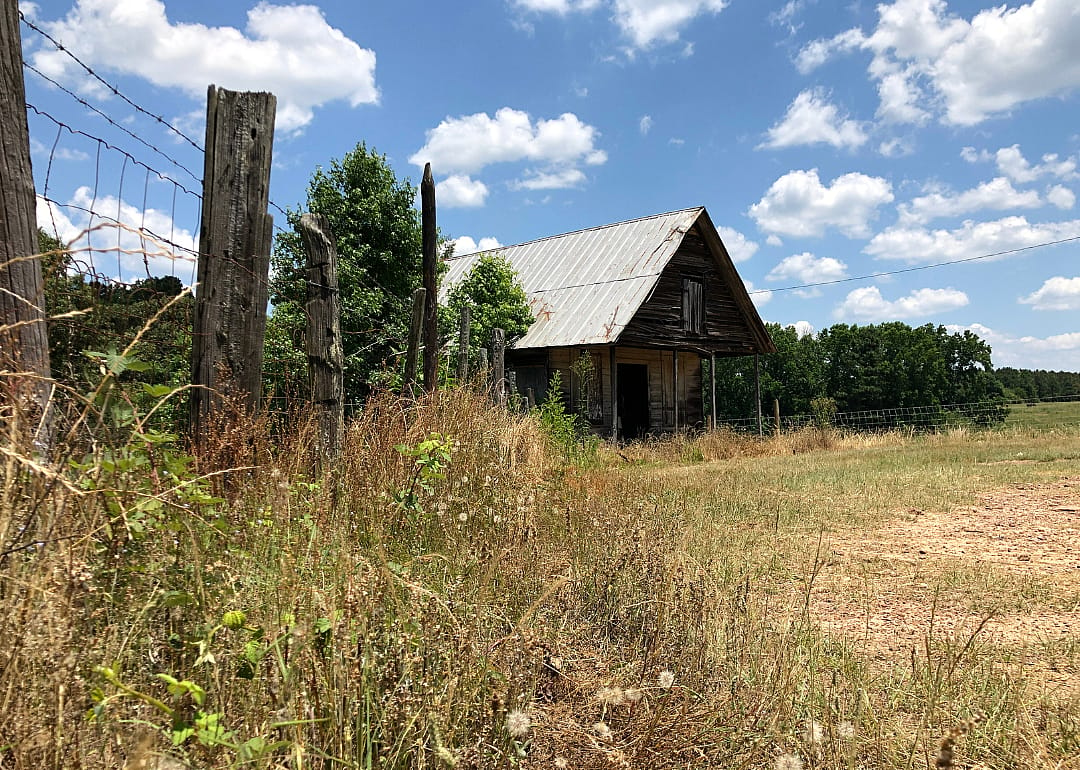
JFFC // Shutterstock
13 / 20- Bridges in poor condition: 9.4% (6 of 64 bridges)
- Square meters of bridges in poor condition: 7.0% (1,703 of 24,302 square meters of bridges)
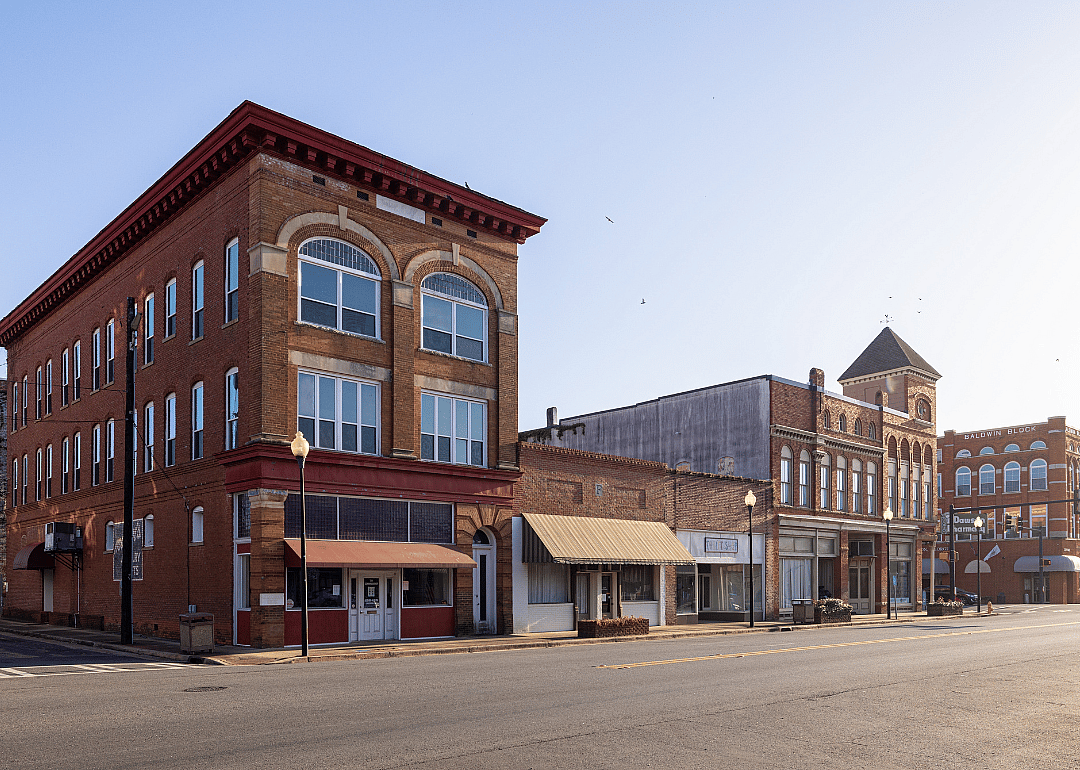
Roberto Galan // Shutterstock
14 / 20- Bridges in poor condition: 9.6% (5 of 52 bridges)
- Square meters of bridges in poor condition: 3.2% (555 of 17,177 square meters of bridges)
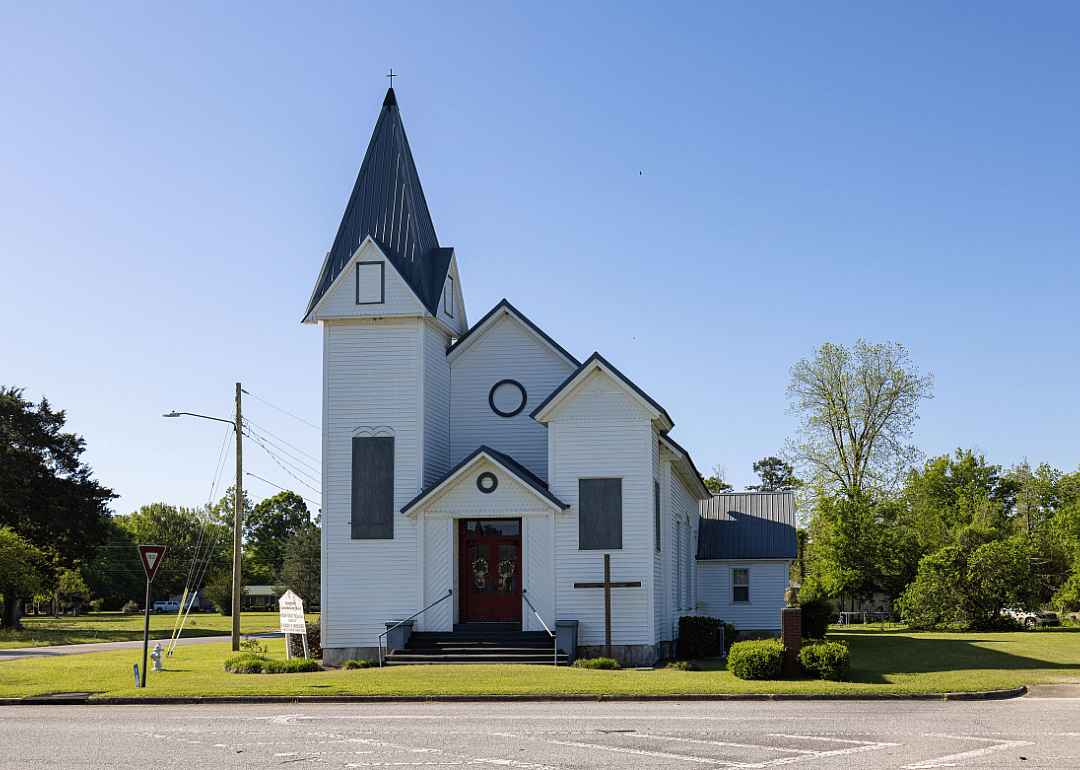
Roberto Galan // Shutterstock
15 / 20- Bridges in poor condition: 10.0% (2 of 20 bridges)
- Square meters of bridges in poor condition: 2.3% (204 of 8,805 square meters of bridges)
You may also like: Counties with the most veterans in Georgia
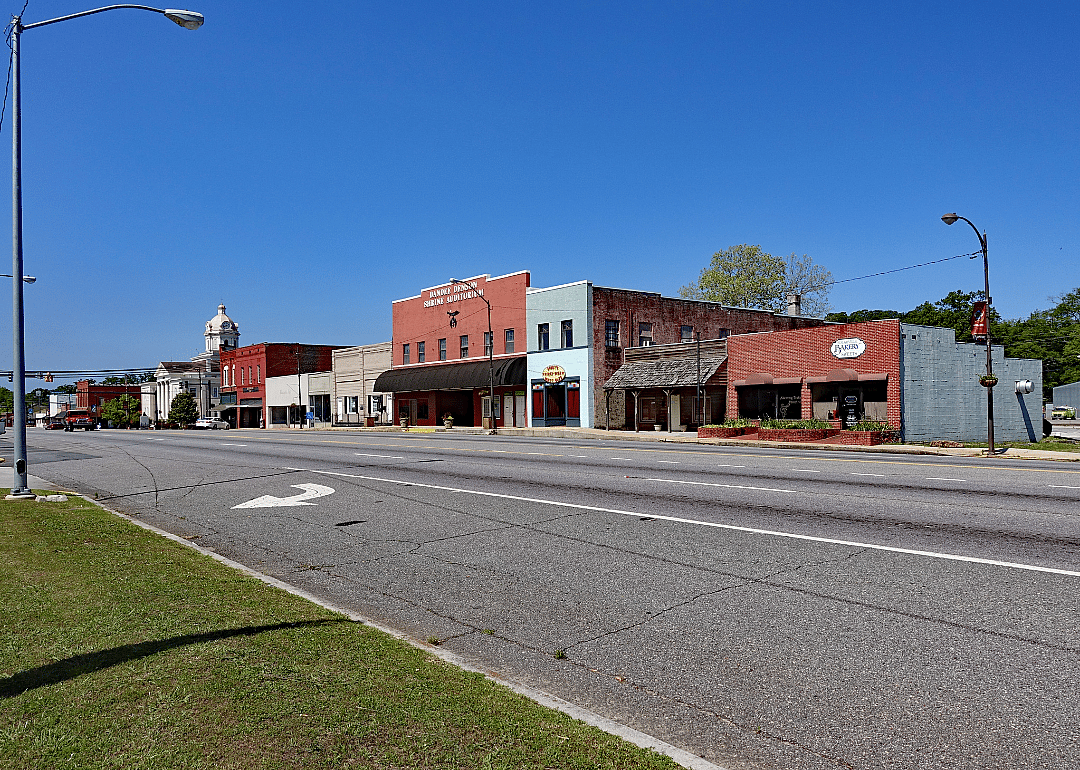
Thomas Barrat // Shutterstock
16 / 20- Bridges in poor condition: 10.6% (12 of 113 bridges)
- Square meters of bridges in poor condition: 3.5% (1,223 of 34,693 square meters of bridges)
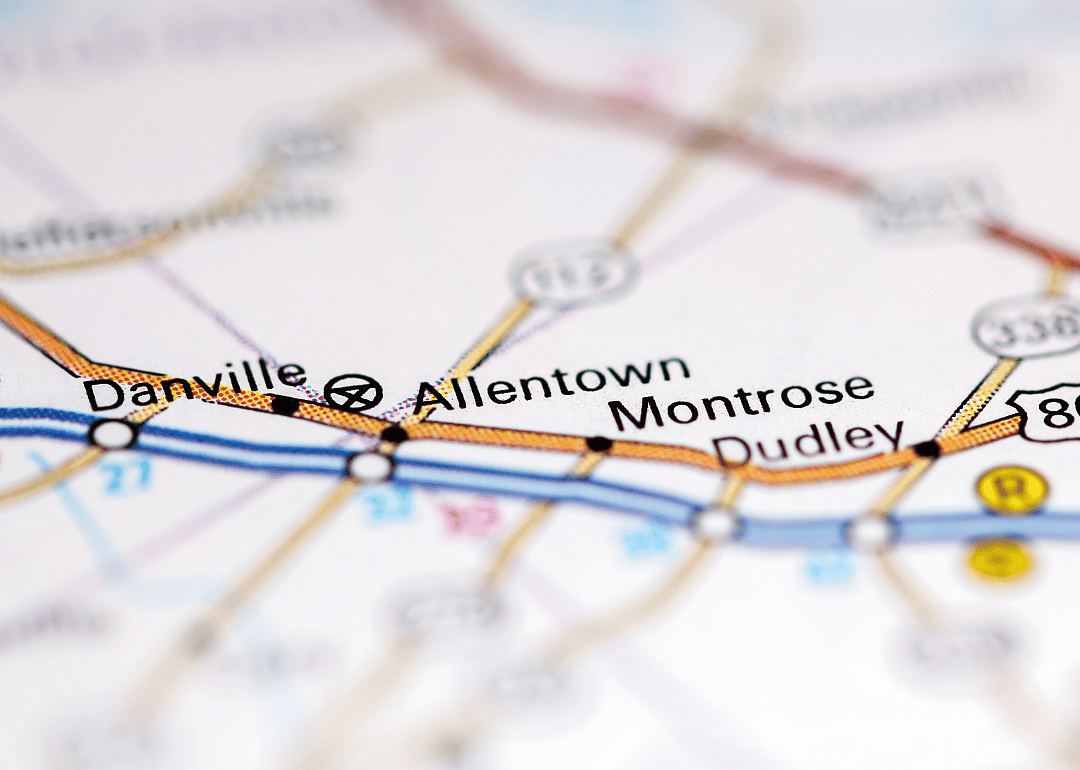
SevenMaps // Shutterstock
17 / 20- Bridges in poor condition: 11.1% (8 of 72 bridges)
- Square meters of bridges in poor condition: 6.3% (3,509 of 55,595 square meters of bridges)
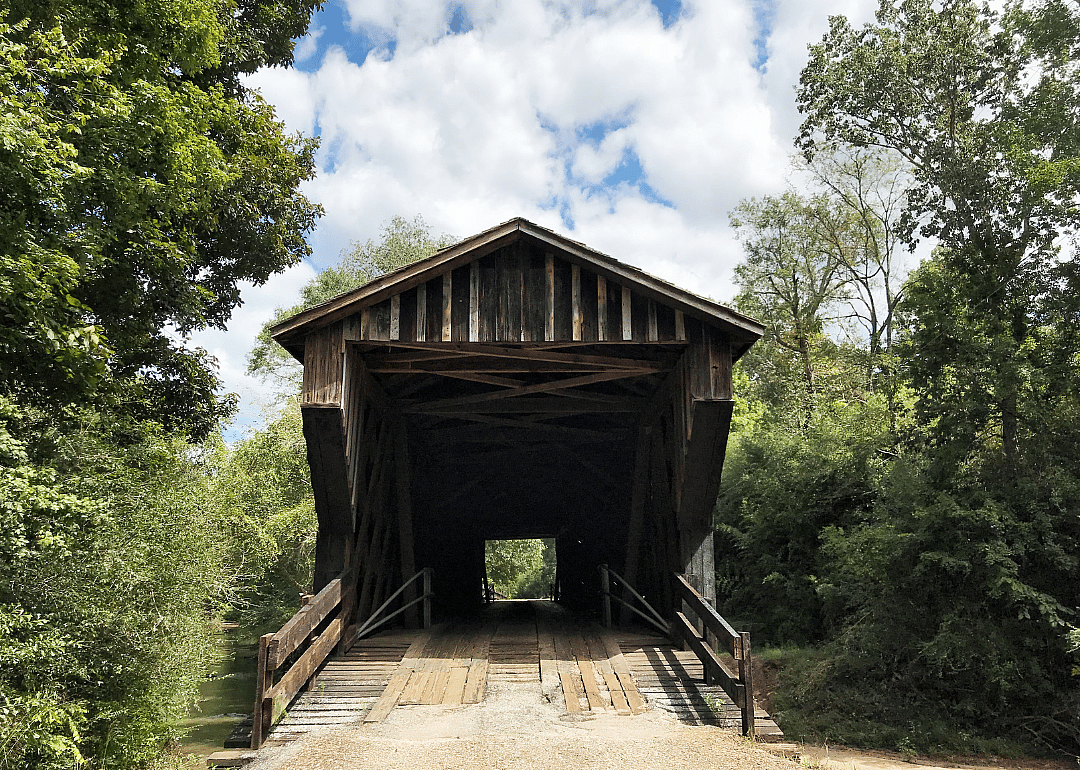
Canva
18 / 20- Bridges in poor condition: 13.5% (18 of 133 bridges)
- Square meters of bridges in poor condition: 6.9% (3,363 of 49,056 square meters of bridges)
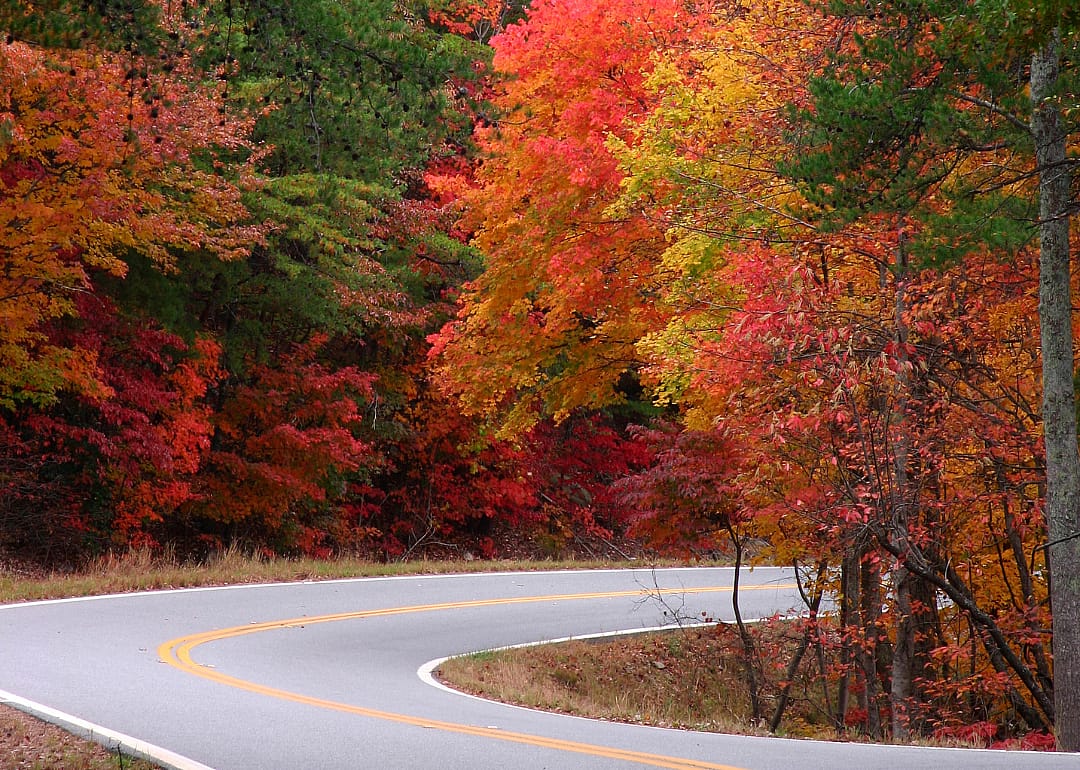
Jeff Kinsey // Shutterstock
19 / 20- Bridges in poor condition: 14.5% (12 of 83 bridges)
- Square meters of bridges in poor condition: 5.6% (1,838 of 32,564 square meters of bridges)
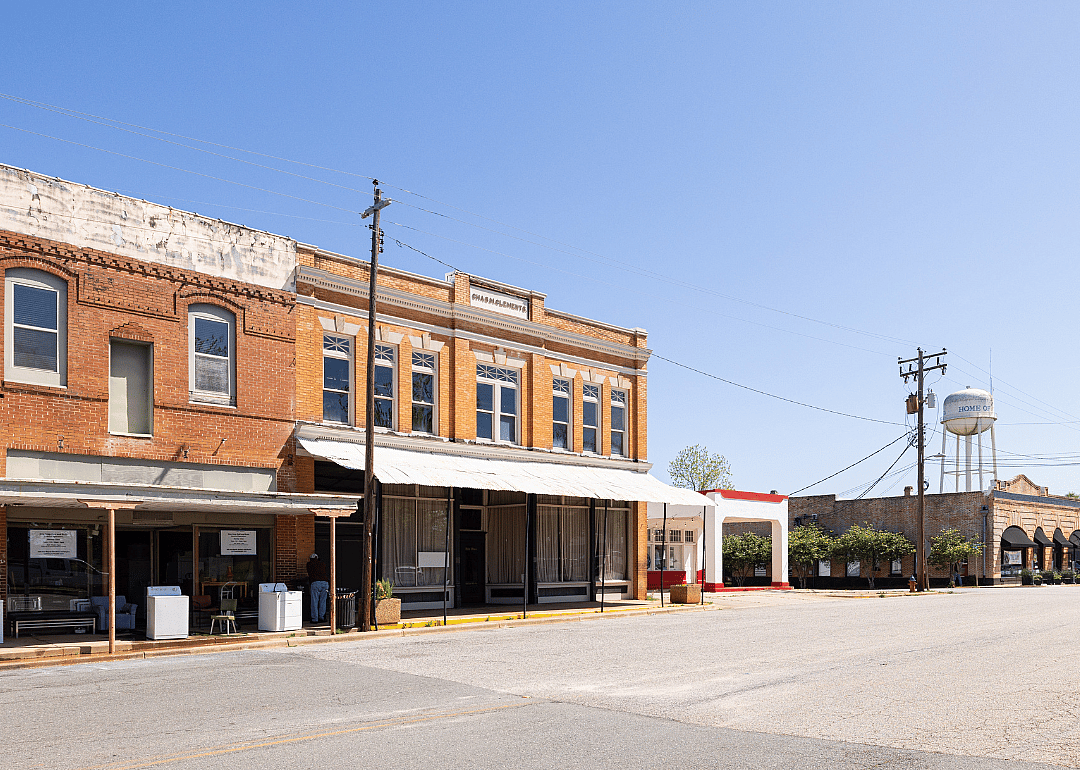
Roberto Galan // Shutterstock
20 / 20- Bridges in poor condition: 17.4% (8 of 46 bridges)
- Square meters of bridges in poor condition: 15.8% (1,896 of 11,996 square meters of bridges)
You may also like: Coldest Septembers in Georgia since 1895