Stacker Studio

How anxiety and depression rates changed in every state during COVID-19

Written by:
April 2, 2021
eldar nurkovic // Shutterstock

This story originally appeared on Stacker and was produced and distributed in partnership with Stacker Studio.

How anxiety and depression rates changed in every state during COVID-19

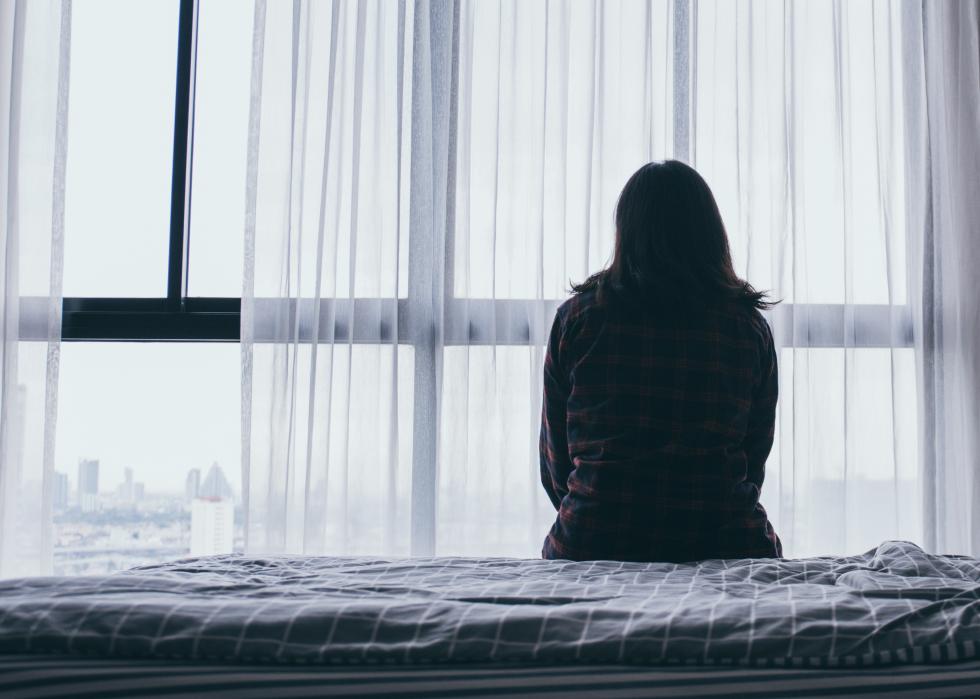
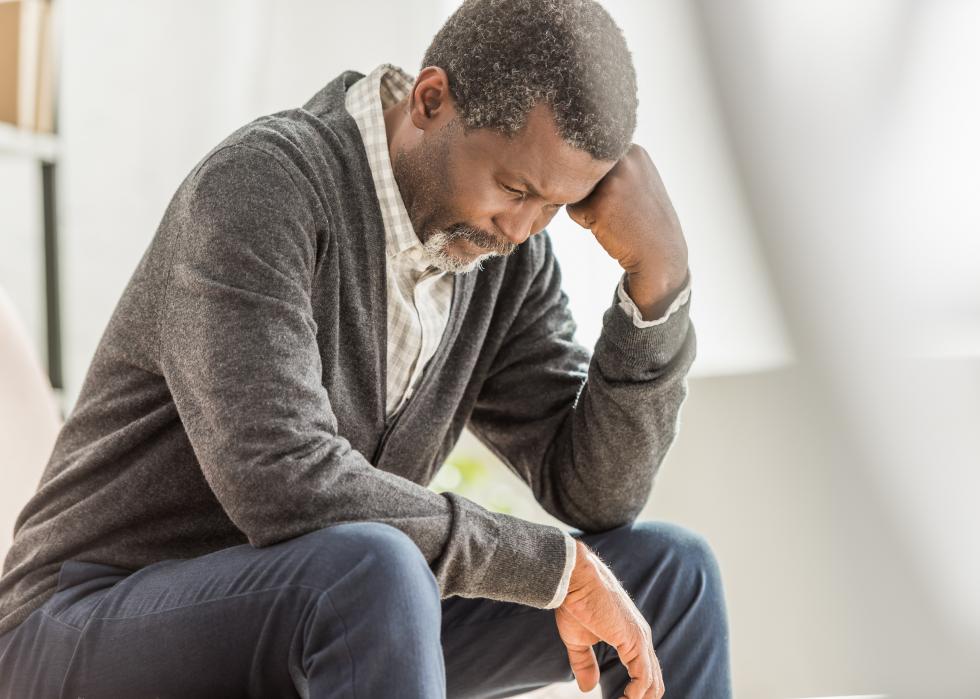
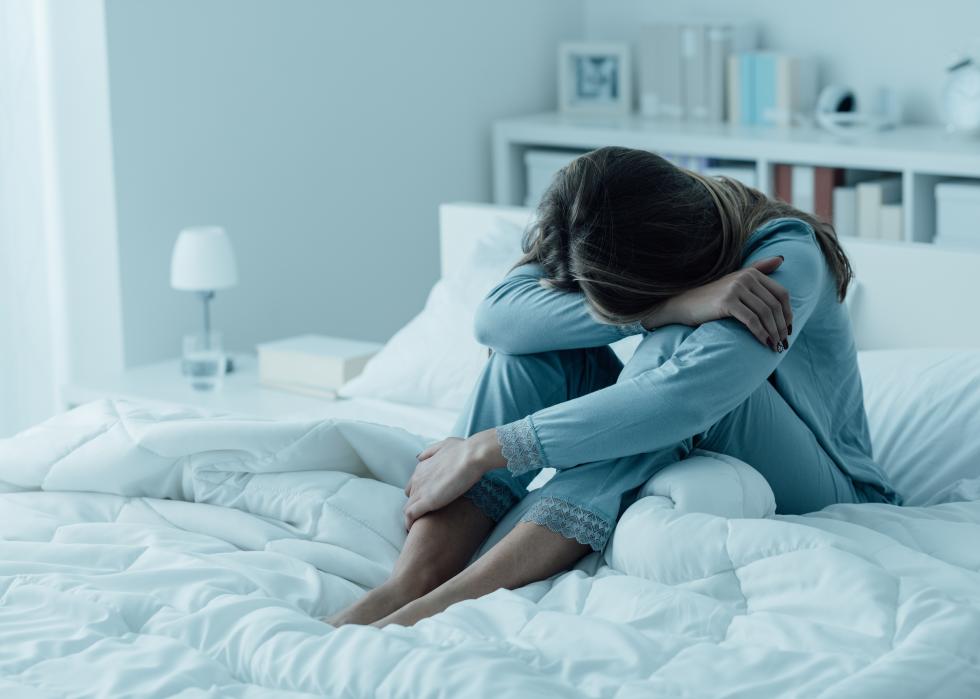
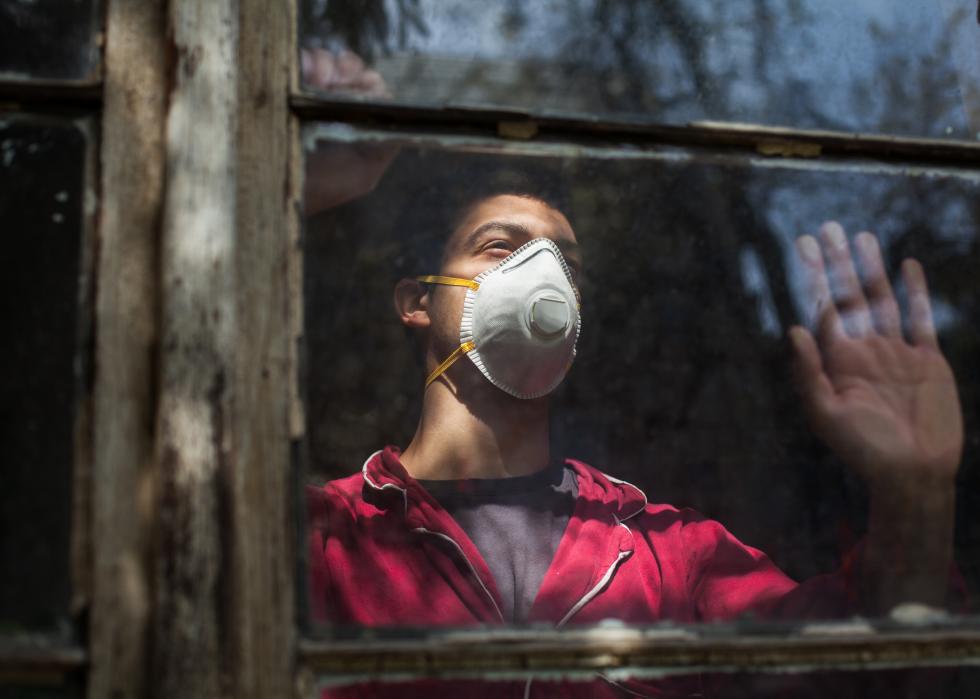
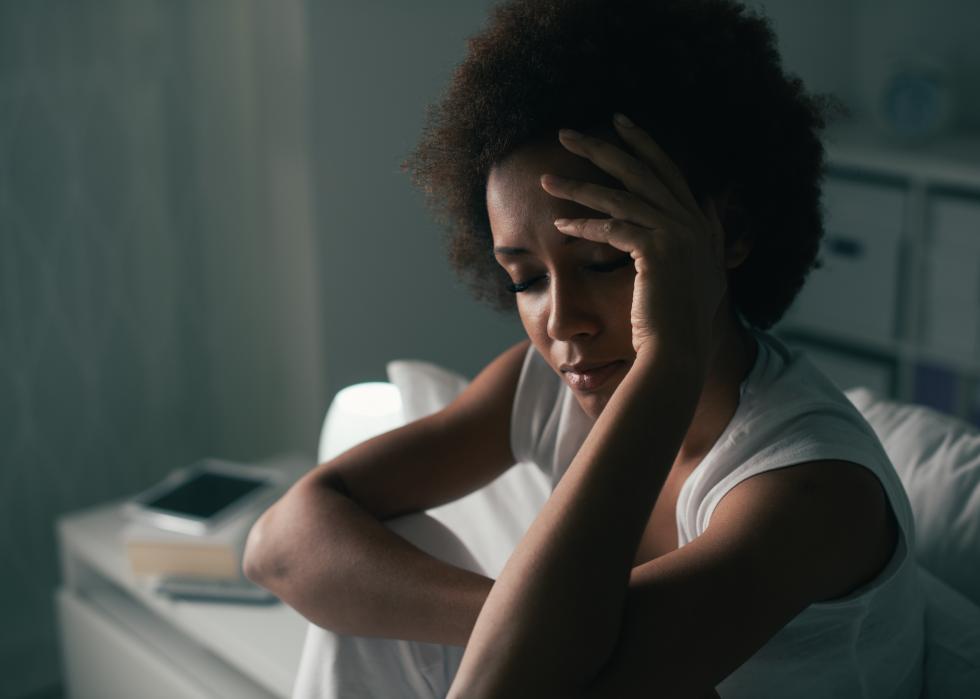
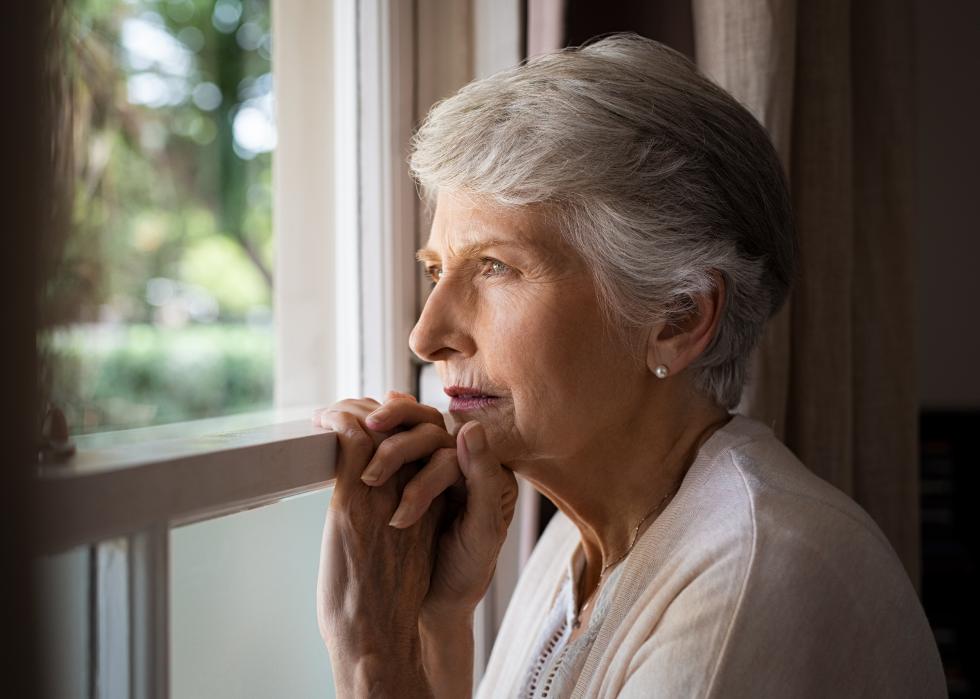
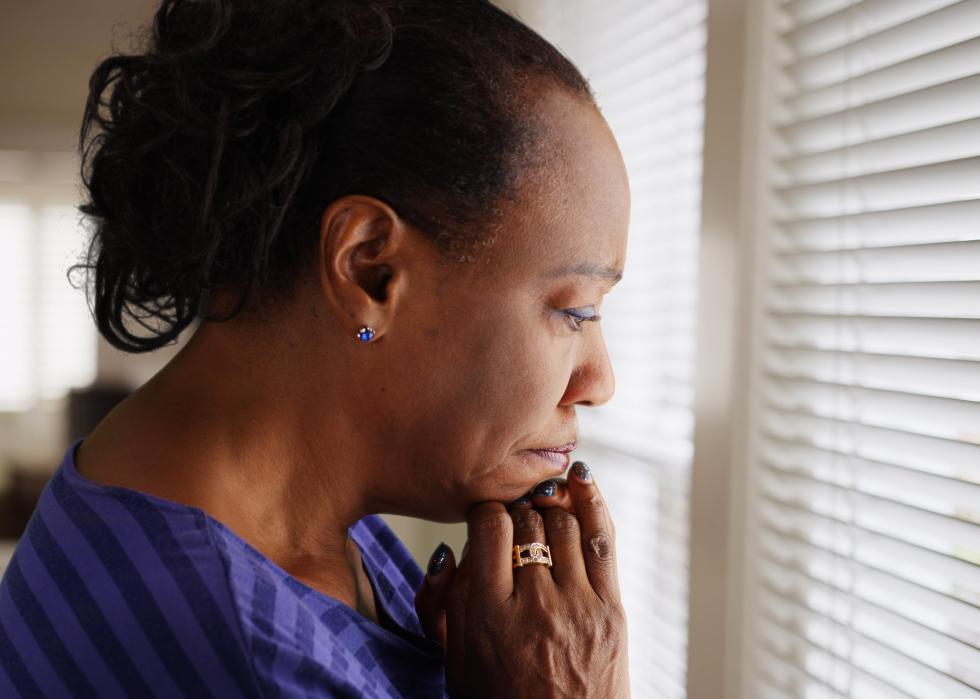
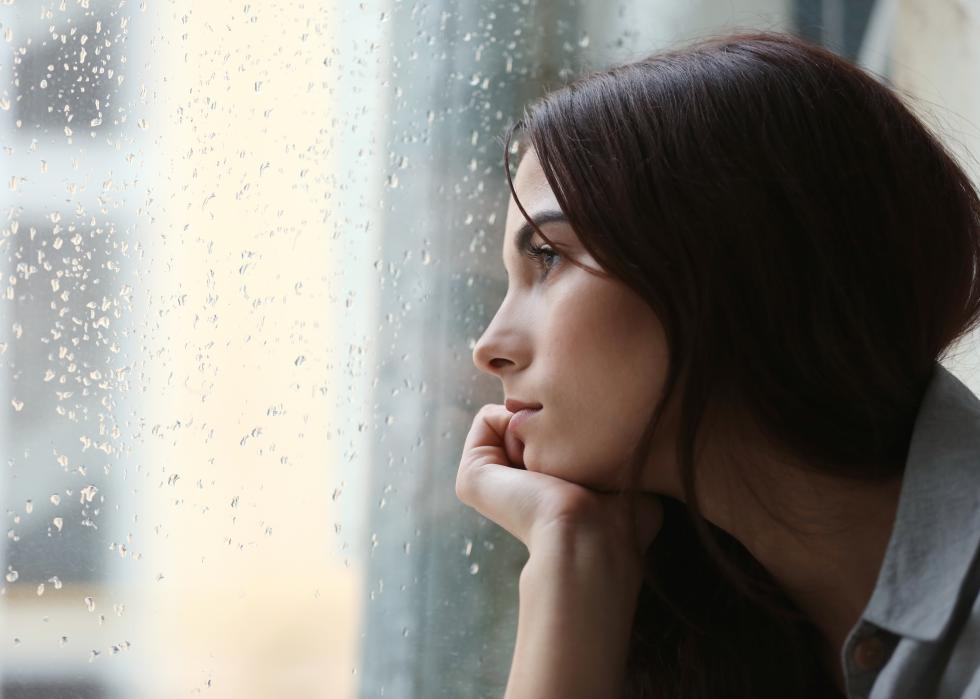
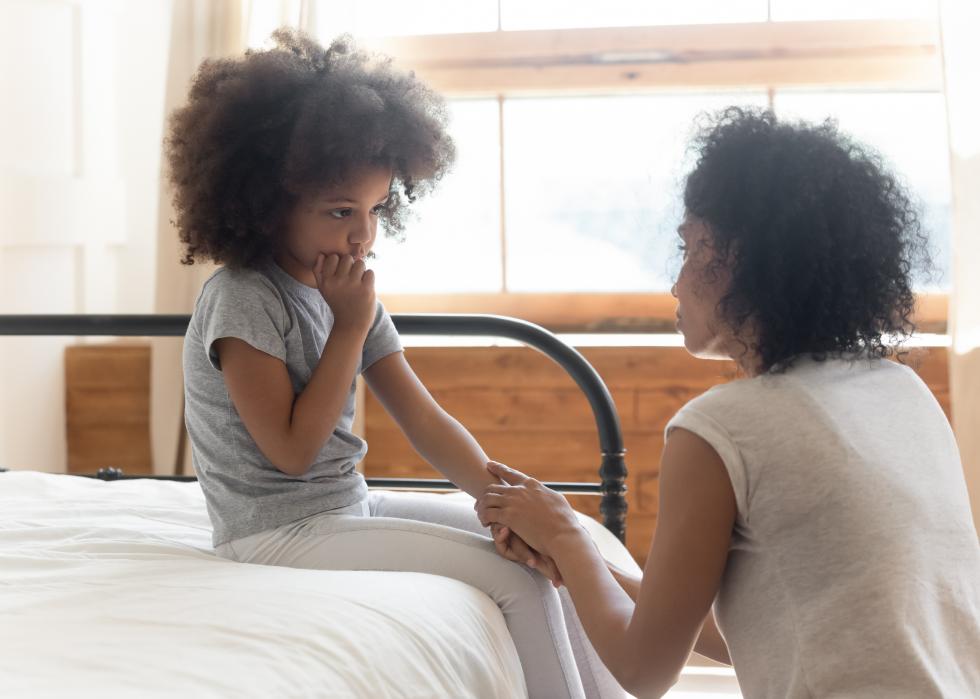
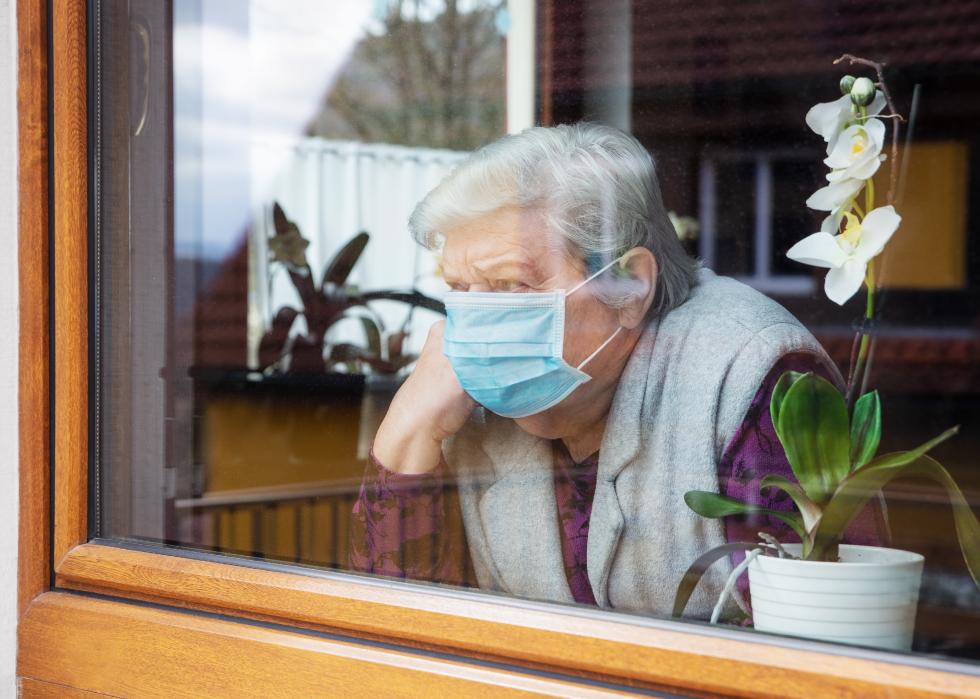
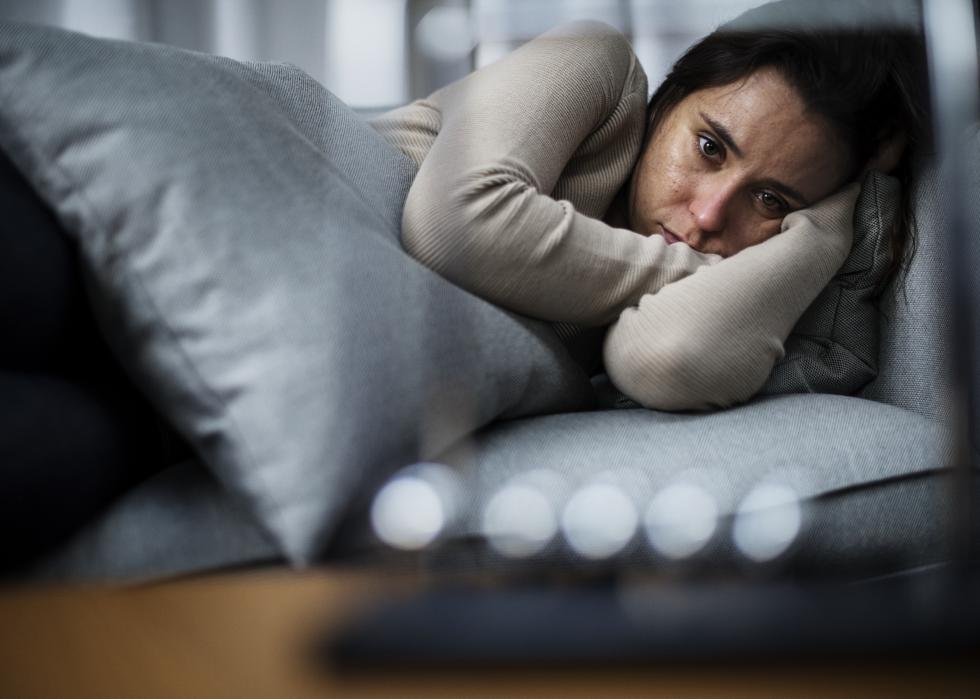
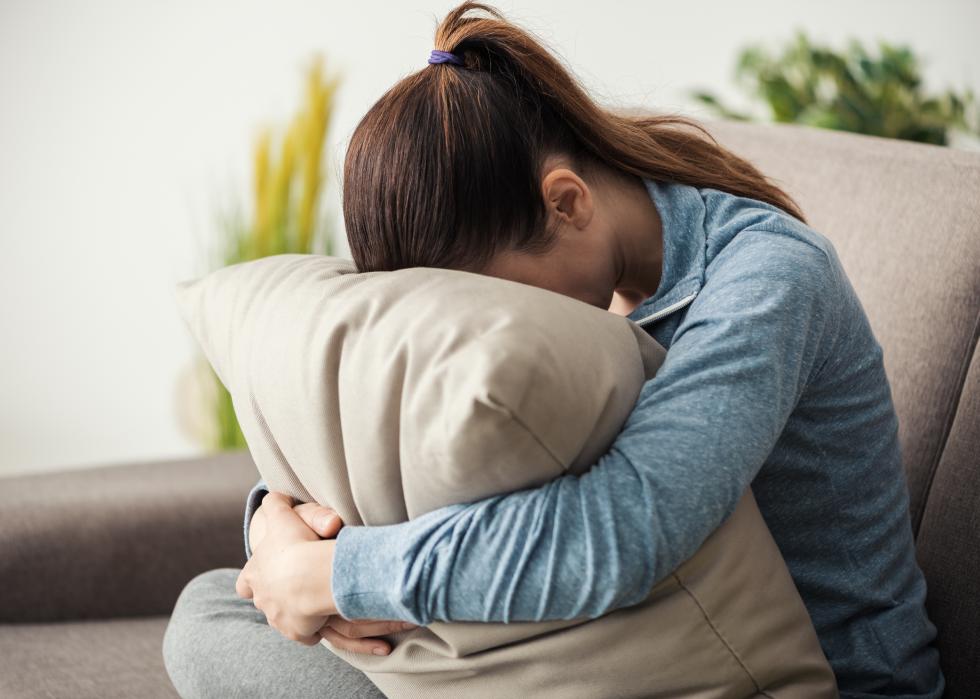
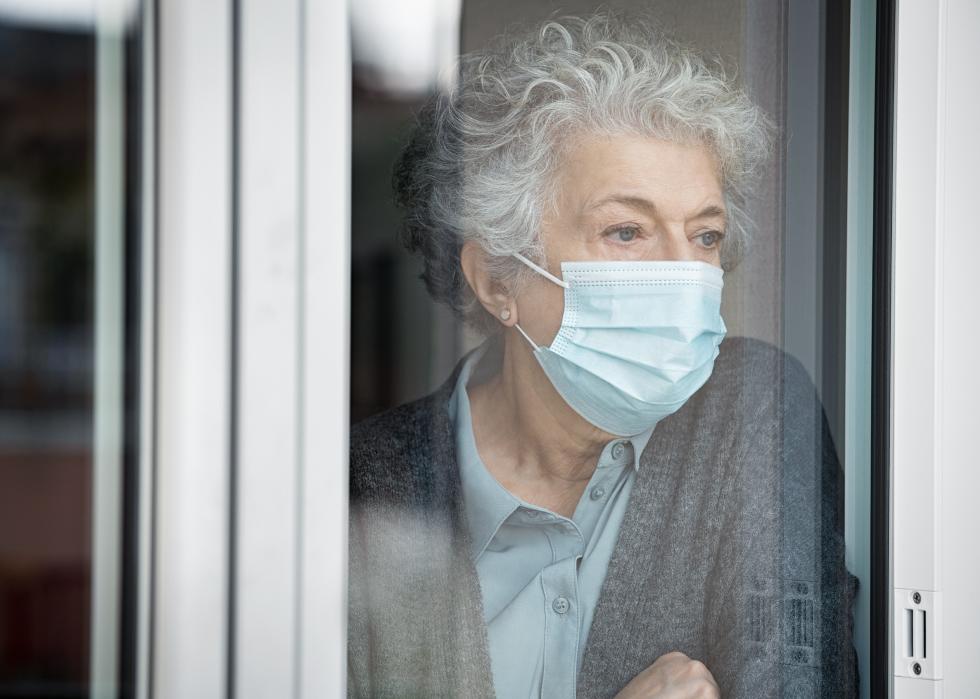
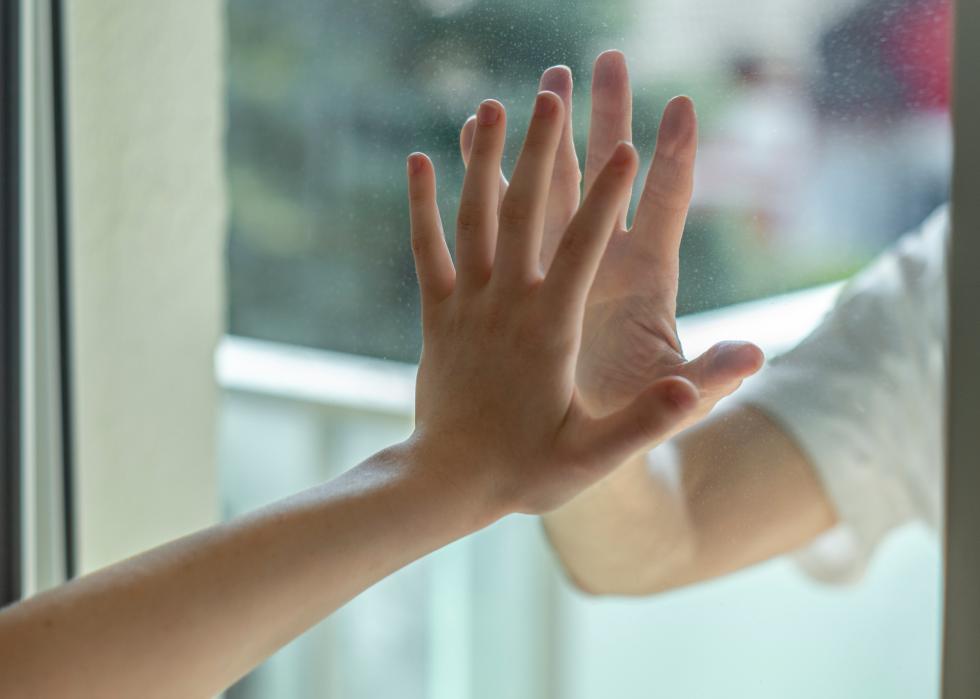
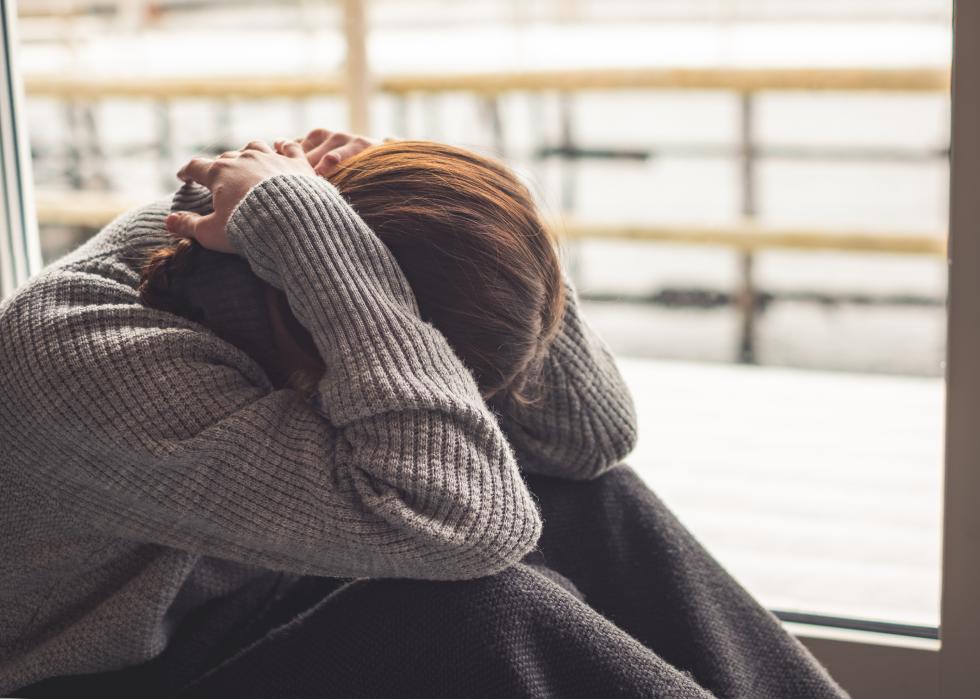
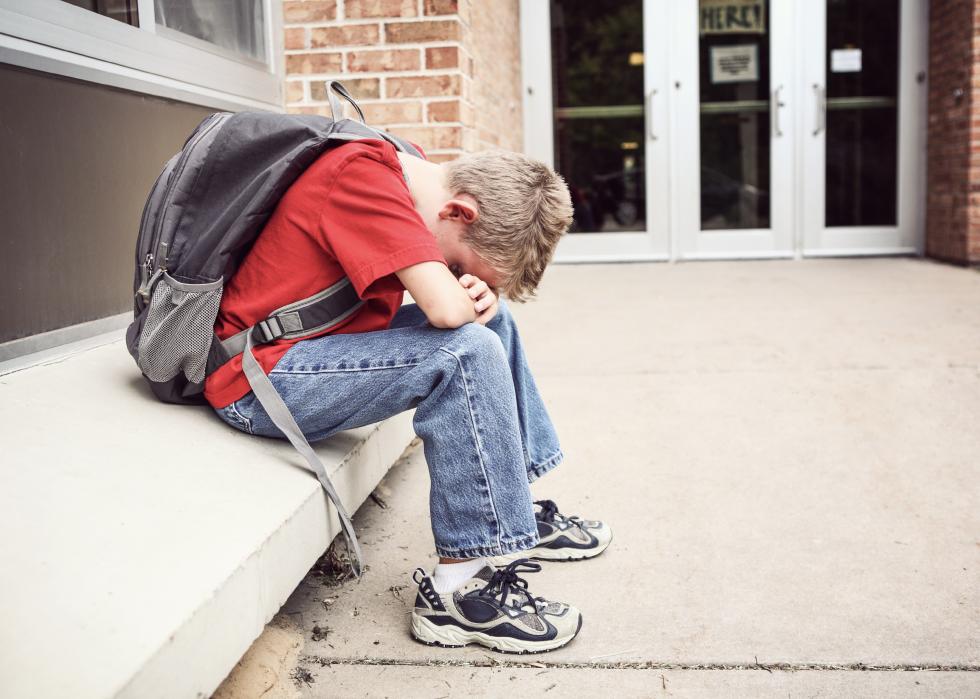
It's now been more than a year since the COVID-19 pandemic drastically changed the lives of people around the world. The virus brought immense feelings of stress, worry, fear, anger, loneliness, and for many, grief.

Sunday Citizen used data from the U.S. Census Bureau's Household Pulse Survey, which collected responses biweekly between April 2020 and February 2021, to compile statistics on anxiety, depression, and mental health activities in every state and Washington D.C. The data from this story covers two periods of time during the pandemic: April 23 to May 5, 2020 and Feb. 17 to March 1, 2021, with the most recent dataset released on March 10, 2021.

The Census Bureau uses representative sample sizes and population estimates to determine the people’s frequency of anxiety and depression per week in every state, as well as the percentage of the population that receives therapy or takes prescription medication. The frequency rates are categorized as follows: “rarely” means no days at all, “occasionally” means several days a week, “frequently” means more than half of the week, and “did not report” means that data was not available for that percentage of the population.

Continue reading for statistics surrounding mental health in your state during COVID-19. 

1 / 51
panitanphoto // Shutterstock

Alabama

- Frequency of feeling depressed or hopeless (Feb. 2021):
--- Rarely: 40.5% (-11.6% from April 2020),
--- Occasionally: 19.5% (-4.3% from April 2020),
--- Frequently: 10.1% (+2.8% from April 2020),
--- Nearly everyday: 8.9% (+3.0% from April 2020),
--- Did not report: 21.1% (+10.1% from April 2020)
- Frequency of feeling anxious or on edge (Feb. 2021):
--- Rarely: 32.0% (-5.4% from April 2020),
--- Occasionally: 25.4% (-4.4% from April 2020),
--- Frequently: 8.9% (-1.3% from April 2020),
--- Nearly everyday: 12.7% (+1.1% from April 2020),
--- Did not report: 21.1% (+10.0% from April 2020)
- Received counseling or therapy (Feb. 2021): yes: 6.9%, no: 70.8%, did not report: 22.4%
- Took prescription medication to help with mental health (Feb. 2021): yes: 17.9%, no: 60.0%, did not report: 22.2%

2 / 51
LightField Studios // Shutterstock

Alaska

- Frequency of feeling depressed or hopeless (Feb. 2021):
--- Rarely: 37.2% (-17.4% from April 2020),
--- Occasionally: 29.0% (+6.5% from April 2020),
--- Frequently: 9.7% (+1.7% from April 2020),
--- Nearly everyday: 9.1% (+2.1% from April 2020),
--- Did not report: 15.1% (+7.1% from April 2020)
- Frequency of feeling anxious or on edge (Feb. 2021):
--- Rarely: 32.4% (-4.1% from April 2020),
--- Occasionally: 27.2% (-3.2% from April 2020),
--- Frequently: 11.5% (+2.1% from April 2020),
--- Nearly everyday: 14.1% (-1.6% from April 2020),
--- Did not report: 14.8% (+6.8% from April 2020)
- Received counseling or therapy (Feb. 2021): yes: 10.5%, no: 73.0%, did not report: 16.5%
- Took prescription medication to help with mental health (Feb. 2021): yes: 14.5%, no: 69.1%, did not report: 16.4%

3 / 51
LightField Studios // Shutterstock

Arizona

- Frequency of feeling depressed or hopeless (Feb. 2021):
--- Rarely: 40.6% (-6.3% from April 2020),
--- Occasionally: 21.9% (-3.6% from April 2020),
--- Frequently: 9.0% (-0.2% from April 2020),
--- Nearly everyday: 8.8% (+1.1% from April 2020),
--- Did not report: 19.7% (+9.1% from April 2020)
- Frequency of feeling anxious or on edge (Feb. 2021):
--- Rarely: 31.9% (-0.8% from April 2020),
--- Occasionally: 23.6% (-6.0% from April 2020),
--- Frequently: 9.7% (-4.1% from April 2020),
--- Nearly everyday: 15.1% (+1.8% from April 2020),
--- Did not report: 19.7% (+9.0% from April 2020)
- Received counseling or therapy (Feb. 2021): yes: 5.9%, no: 72.6%, did not report: 21.5%
- Took prescription medication to help with mental health (Feb. 2021): yes: 15.0%, no: 63.3%, did not report: 21.6%

4 / 51
Stock-Asso // Shutterstock

Arkansas

- Frequency of feeling depressed or hopeless (Feb. 2021):
--- Rarely: 37.0% (-7.0% from April 2020),
--- Occasionally: 23.0% (-2.4% from April 2020),
--- Frequently: 9.0% (+0.9% from April 2020),
--- Nearly everyday: 9.6% (+0.2% from April 2020),
--- Did not report: 21.4% (+8.3% from April 2020)
- Frequency of feeling anxious or on edge (Feb. 2021):
--- Rarely: 30.3% (-1.2% from April 2020),
--- Occasionally: 23.3% (-4.0% from April 2020),
--- Frequently: 9.6% (-2.9% from April 2020),
--- Nearly everyday: 16.0% (+0.4% from April 2020),
--- Did not report: 20.8% (+7.7% from April 2020)
- Received counseling or therapy (Feb. 2021): yes: 9.5%, no: 67.6%, did not report: 22.9%
- Took prescription medication to help with mental health (Feb. 2021): yes: 20.8%, no: 56.5%, did not report: 22.7%

5 / 51
Cryptographer // Shutterstock

California

- Frequency of feeling depressed or hopeless (Feb. 2021):
--- Rarely: 33.8% (-12.8% from April 2020),
--- Occasionally: 24.1% (-3.1% from April 2020),
--- Frequently: 9.4% (+0.9% from April 2020),
--- Nearly everyday: 10.4% (+2.1% from April 2020),
--- Did not report: 22.4% (+12.9% from April 2020)
- Frequency of feeling anxious or on edge (Feb. 2021):
--- Rarely: 25.8% (-5.0% from April 2020),
--- Occasionally: 25.1% (-7.9% from April 2020),
--- Frequently: 10.6% (-1.9% from April 2020),
--- Nearly everyday: 16.1% (+1.7% from April 2020),
--- Did not report: 22.3% (+13.1% from April 2020)
- Received counseling or therapy (Feb. 2021): yes: 8.0%, no: 66.7%, did not report: 25.3%
- Took prescription medication to help with mental health (Feb. 2021): yes: 14.0%, no: 61.0%, did not report: 25.0%

6 / 51
Stock-Asso // Shutterstock

Colorado

- Frequency of feeling depressed or hopeless (Feb. 2021):
--- Rarely: 40.5% (-8.5% from April 2020),
--- Occasionally: 23.6% (-6.2% from April 2020),
--- Frequently: 9.6% (+1.1% from April 2020),
--- Nearly everyday: 9.8% (+3.1% from April 2020),
--- Did not report: 16.5% (+10.4% from April 2020)
- Frequency of feeling anxious or on edge (Feb. 2021):
--- Rarely: 29.9% (-3.2% from April 2020),
--- Occasionally: 26.9% (-4.5% from April 2020),
--- Frequently: 11.4% (-1.1% from April 2020),
--- Nearly everyday: 15.6% (-1.5% from April 2020),
--- Did not report: 16.2% (+10.3% from April 2020)
- Received counseling or therapy (Feb. 2021): yes: 8.4%, no: 73.5%, did not report: 18.1%
- Took prescription medication to help with mental health (Feb. 2021): yes: 17.4%, no: 64.3%, did not report: 18.3%

7 / 51
Dmytro Zinkevych // Shutterstock

Connecticut

- Frequency of feeling depressed or hopeless (Feb. 2021):
--- Rarely: 36.1% (-11.1% from April 2020),
--- Occasionally: 24.8% (-1.2% from April 2020),
--- Frequently: 11.0% (+1.8% from April 2020),
--- Nearly everyday: 8.7% (+2.1% from April 2020),
--- Did not report: 19.5% (+8.4% from April 2020)
- Frequency of feeling anxious or on edge (Feb. 2021):
--- Rarely: 26.3% (-0.8% from April 2020),
--- Occasionally: 25.9% (-7.6% from April 2020),
--- Frequently: 10.0% (-1.9% from April 2020),
--- Nearly everyday: 18.6% (+2.7% from April 2020),
--- Did not report: 19.3% (+7.7% from April 2020)
- Received counseling or therapy (Feb. 2021): yes: 12.8%, no: 65.2%, did not report: 22.0%
- Took prescription medication to help with mental health (Feb. 2021): yes: 19.3%, no: 58.8%, did not report: 21.8%

8 / 51
Rido // Shutterstock

Delaware

- Frequency of feeling depressed or hopeless (Feb. 2021):
--- Rarely: 43.5% (-9.5% from April 2020),
--- Occasionally: 21.2% (-2.7% from April 2020),
--- Frequently: 6.5% (-1.8% from April 2020),
--- Nearly everyday: 8.2% (+1.9% from April 2020),
--- Did not report: 20.7% (+12.0% from April 2020)
- Frequency of feeling anxious or on edge (Feb. 2021):
--- Rarely: 32.5% (+0.8% from April 2020),
--- Occasionally: 23.8% (-8.9% from April 2020),
--- Frequently: 8.8% (-1.6% from April 2020),
--- Nearly everyday: 14.2% (-1.7% from April 2020),
--- Did not report: 20.6% (+11.4% from April 2020)
- Received counseling or therapy (Feb. 2021): yes: 9.6%, no: 67.5%, did not report: 22.9%
- Took prescription medication to help with mental health (Feb. 2021): yes: 19.6%, no: 57.0%, did not report: 23.4%

9 / 51
Rocketclips, Inc. // Shutterstock

Florida

- Frequency of feeling depressed or hopeless (Feb. 2021):
--- Rarely: 37.0% (-12.0% from April 2020),
--- Occasionally: 22.3% (-3.3% from April 2020),
--- Frequently: 7.7% (-1.4% from April 2020),
--- Nearly everyday: 8.5% (+1.7% from April 2020),
--- Did not report: 24.5% (+15.0% from April 2020)
- Frequency of feeling anxious or on edge (Feb. 2021):
--- Rarely: 30.7% (-4.9% from April 2020),
--- Occasionally: 22.4% (-4.9% from April 2020),
--- Frequently: 8.7% (-4.0% from April 2020),
--- Nearly everyday: 14.1% (-0.8% from April 2020),
--- Did not report: 24.1% (+14.6% from April 2020)
- Received counseling or therapy (Feb. 2021): yes: 5.6%, no: 67.8%, did not report: 26.6%
- Took prescription medication to help with mental health (Feb. 2021): yes: 12.5%, no: 60.9%, did not report: 26.6%

10 / 51
Africa Studio // Shutterstock

Georgia

- Frequency of feeling depressed or hopeless (Feb. 2021):
--- Rarely: 34.0% (-12.1% from April 2020),
--- Occasionally: 22.8% (-1.1% from April 2020),
--- Frequently: 7.6% (-3.5% from April 2020),
--- Nearly everyday: 10.6% (+2.9% from April 2020),
--- Did not report: 25.1% (+13.8% from April 2020)
- Frequency of feeling anxious or on edge (Feb. 2021):
--- Rarely: 28.5% (-5.0% from April 2020),
--- Occasionally: 21.0% (-6.6% from April 2020),
--- Frequently: 9.5% (-2.3% from April 2020),
--- Nearly everyday: 16.0% (+0.4% from April 2020),
--- Did not report: 25.0% (+13.5% from April 2020)
- Received counseling or therapy (Feb. 2021): yes: 8.0%, no: 65.0%, did not report: 27.0%
- Took prescription medication to help with mental health (Feb. 2021): yes: 17.9%, no: 55.2%, did not report: 26.9%

11 / 51
kenchiro168 // Shutterstock

Hawaii

- Frequency of feeling depressed or hopeless (Feb. 2021):
--- Rarely: 42.7% (-2.4% from April 2020),
--- Occasionally: 25.4% (-8.3% from April 2020),
--- Frequently: 7.7% (+0.5% from April 2020),
--- Nearly everyday: 8.5% (+2.4% from April 2020),
--- Did not report: 15.7% (+7.8% from April 2020)
- Frequency of feeling anxious or on edge (Feb. 2021):
--- Rarely: 31.1% (+1.1% from April 2020),
--- Occasionally: 27.7% (-5.0% from April 2020),
--- Frequently: 12.2% (-2.9% from April 2020),
--- Nearly everyday: 13.3% (+0.1% from April 2020),
--- Did not report: 15.7% (+6.7% from April 2020)
- Received counseling or therapy (Feb. 2021): yes: 8.8%, no: 74.7%, did not report: 16.5%
- Took prescription medication to help with mental health (Feb. 2021): yes: 10.2%, no: 73.1%, did not report: 16.7%

12 / 51
Photographee.eu // Shutterstock

Idaho

- Frequency of feeling depressed or hopeless (Feb. 2021):
--- Rarely: 41.8% (-11.7% from April 2020),
--- Occasionally: 23.5% (-3.4% from April 2020),
--- Frequently: 7.9% (+0.7% from April 2020),
--- Nearly everyday: 9.1% (+2.5% from April 2020),
--- Did not report: 17.7% (+11.9% from April 2020)
- Frequency of feeling anxious or on edge (Feb. 2021):
--- Rarely: 33.6% (-5.5% from April 2020),
--- Occasionally: 25.8% (-5.3% from April 2020),
--- Frequently: 10.5% (-2.3% from April 2020),
--- Nearly everyday: 12.8% (+1.6% from April 2020),
--- Did not report: 17.4% (+11.5% from April 2020)
- Received counseling or therapy (Feb. 2021): yes: 9.4%, no: 71.3%, did not report: 19.3%
- Took prescription medication to help with mental health (Feb. 2021): yes: 19.0%, no: 61.7%, did not report: 19.3%

13 / 51
fizkes // Shutterstock

Illinois

- Frequency of feeling depressed or hopeless (Feb. 2021):
--- Rarely: 35.3% (-9.4% from April 2020),
--- Occasionally: 23.8% (-3.1% from April 2020),
--- Frequently: 8.2% (-0.9% from April 2020),
--- Nearly everyday: 9.9% (+2.2% from April 2020),
--- Did not report: 22.8% (+11.2% from April 2020)
- Frequency of feeling anxious or on edge (Feb. 2021):
--- Rarely: 28.9% (-3.0% from April 2020),
--- Occasionally: 24.3% (-4.8% from April 2020),
--- Frequently: 10.6% (-3.3% from April 2020),
--- Nearly everyday: 13.6% (+0.2% from April 2020),
--- Did not report: 22.5% (+10.8% from April 2020)
- Received counseling or therapy (Feb. 2021): yes: 8.6%, no: 67.1%, did not report: 24.4%
- Took prescription medication to help with mental health (Feb. 2021): yes: 15.4%, no: 59.8%, did not report: 24.9%

14 / 51
Miriam Doerr Martin Frommherz // Shutterstock

Indiana

- Frequency of feeling depressed or hopeless (Feb. 2021):
--- Rarely: 39.1% (-6.5% from April 2020),
--- Occasionally: 23.7% (-4.0% from April 2020),
--- Frequently: 11.3% (+1.5% from April 2020),
--- Nearly everyday: 8.1% (-0.4% from April 2020),
--- Did not report: 17.8% (+9.4% from April 2020)
- Frequency of feeling anxious or on edge (Feb. 2021):
--- Rarely: 31.2% (-2.5% from April 2020),
--- Occasionally: 24.7% (-4.3% from April 2020),
--- Frequently: 12.9% (-0.3% from April 2020),
--- Nearly everyday: 13.4% (-1.9% from April 2020),
--- Did not report: 17.8% (+9.1% from April 2020)
- Received counseling or therapy (Feb. 2021): yes: 7.1%, no: 72.7%, did not report: 20.3%
- Took prescription medication to help with mental health (Feb. 2021): yes: 20.5%, no: 58.9%, did not report: 20.5%

15 / 51
Rawpixel.com // Shutterstock

Iowa

- Frequency of feeling depressed or hopeless (Feb. 2021):
--- Rarely: 39.6% (-13.0% from April 2020),
--- Occasionally: 23.5% (-5.3% from April 2020),
--- Frequently: 8.0% (+2.5% from April 2020),
--- Nearly everyday: 7.9% (+2.1% from April 2020),
--- Did not report: 21.0% (+13.8% from April 2020)
- Frequency of feeling anxious or on edge (Feb. 2021):
--- Rarely: 32.3% (-3.7% from April 2020),
--- Occasionally: 24.6% (-11.3% from April 2020),
--- Frequently: 9.4% (-0.2% from April 2020),
--- Nearly everyday: 13.1% (+2.0% from April 2020),
--- Did not report: 20.6% (+13.2% from April 2020)
- Received counseling or therapy (Feb. 2021): yes: 8.6%, no: 69.0%, did not report: 22.4%
- Took prescription medication to help with mental health (Feb. 2021): yes: 19.1%, no: 58.3%, did not report: 22.5%

16 / 51
Mike_shots // Shutterstock

Kansas

- Frequency of feeling depressed or hopeless (Feb. 2021):
--- Rarely: 43.4% (-6.4% from April 2020),
--- Occasionally: 20.7% (-4.9% from April 2020),
--- Frequently: 7.1% (-3.8% from April 2020),
--- Nearly everyday: 9.8% (+3.4% from April 2020),
--- Did not report: 18.9% (+11.7% from April 2020)
- Frequency of feeling anxious or on edge (Feb. 2021):
--- Rarely: 35.1% (-7.1% from April 2020),
--- Occasionally: 24.0% (-4.2% from April 2020),
--- Frequently: 8.8% (-2.9% from April 2020),
--- Nearly everyday: 13.4% (+3.0% from April 2020),
--- Did not report: 18.7% (+11.2% from April 2020)
- Received counseling or therapy (Feb. 2021): yes: 8.3%, no: 71.2%, did not report: 20.5%
- Took prescription medication to help with mental health (Feb. 2021): yes: 20.6%, no: 59.0%, did not report: 20.4%

17 / 51
ntonio Guillem // Shutterstock

Kentucky

- Frequency of feeling depressed or hopeless (Feb. 2021):
--- Rarely: 32.0% (-11.9% from April 2020),
--- Occasionally: 27.4% (-4.0% from April 2020),
--- Frequently: 10.8% (+1.4% from April 2020),
--- Nearly everyday: 9.8% (+2.0% from April 2020),
--- Did not report: 19.9% (+12.6% from April 2020)
- Frequency of feeling anxious or on edge (Feb. 2021):
--- Rarely: 26.1% (-6.4% from April 2020),
--- Occasionally: 23.7% (-8.0% from April 2020),
--- Frequently: 11.2% (-1.2% from April 2020),
--- Nearly everyday: 19.3% (+3.4% from April 2020),
--- Did not report: 19.7% (+12.2% from April 2020)
- Received counseling or therapy (Feb. 2021): yes: 6.5%, no: 70.9%, did not report: 22.6%
- Took prescription medication to help with mental health (Feb. 2021): yes: 21.0%, no: 56.7%, did not report: 22.4%

18 / 51
BlurryMe // Shutterstock

Louisiana

- Frequency of feeling depressed or hopeless (Feb. 2021):
--- Rarely: 33.3% (-10.6% from April 2020),
--- Occasionally: 22.6% (-3.0% from April 2020),
--- Frequently: 9.1% (-0.6% from April 2020),
--- Nearly everyday: 11.3% (+1.5% from April 2020),
--- Did not report: 23.7% (+12.7% from April 2020)
- Frequency of feeling anxious or on edge (Feb. 2021):
--- Rarely: 28.2% (-1.7% from April 2020),
--- Occasionally: 19.8% (-9.6% from April 2020),
--- Frequently: 8.6% (-3.6% from April 2020),
--- Nearly everyday: 19.8% (+2.3% from April 2020),
--- Did not report: 23.6% (+12.7% from April 2020)
- Received counseling or therapy (Feb. 2021): yes: 6.6%, no: 68.1%, did not report: 25.3%
- Took prescription medication to help with mental health (Feb. 2021): yes: 17.0%, no: 57.6%, did not report: 25.3%

19 / 51
Stock-Asso // Shutterstock

Maine

- Frequency of feeling depressed or hopeless (Feb. 2021):
--- Rarely: 39.8% (-11.6% from April 2020),
--- Occasionally: 22.1% (-5.2% from April 2020),
--- Frequently: 8.8% (+2.0% from April 2020),
--- Nearly everyday: 7.8% (+1.2% from April 2020),
--- Did not report: 21.5% (+13.6% from April 2020)
- Frequency of feeling anxious or on edge (Feb. 2021):
--- Rarely: 29.6% (-4.5% from April 2020),
--- Occasionally: 22.4% (-9.1% from April 2020),
--- Frequently: 9.0% (-3.6% from April 2020),
--- Nearly everyday: 17.4% (+3.6% from April 2020),
--- Did not report: 21.6% (+13.6% from April 2020)
- Received counseling or therapy (Feb. 2021): yes: 8.9%, no: 68.4%, did not report: 22.7%
- Took prescription medication to help with mental health (Feb. 2021): yes: 19.4%, no: 57.7%, did not report: 22.9%

20 / 51
Monkey Business Images // Shutterstock

Maryland

- Frequency of feeling depressed or hopeless (Feb. 2021):
--- Rarely: 40.0% (-4.5% from April 2020),
--- Occasionally: 22.4% (-8.1% from April 2020),
--- Frequently: 7.5% (-0.5% from April 2020),
--- Nearly everyday: 8.8% (+1.6% from April 2020),
--- Did not report: 21.4% (+11.5% from April 2020)
- Frequency of feeling anxious or on edge (Feb. 2021):
--- Rarely: 30.5% (-1.5% from April 2020),
--- Occasionally: 22.0% (-10.7% from April 2020),
--- Frequently: 12.3% (+0.3% from April 2020),
--- Nearly everyday: 14.2% (+0.8% from April 2020),
--- Did not report: 21.0% (+11.2% from April 2020)
- Received counseling or therapy (Feb. 2021): yes: 9.0%, no: 66.7%, did not report: 24.3%
- Took prescription medication to help with mental health (Feb. 2021): yes: 14.4%, no: 61.1%, did not report: 24.4%

21 / 51
Altitude Visual // Shutterstock

Massachusetts

- Frequency of feeling depressed or hopeless (Feb. 2021):
--- Rarely: 36.0% (-6.2% from April 2020),
--- Occasionally: 24.3% (-4.6% from April 2020),
--- Frequently: 9.6% (-1.3% from April 2020),
--- Nearly everyday: 7.4% (-1.5% from April 2020),
--- Did not report: 22.7% (+13.7% from April 2020)
- Frequency of feeling anxious or on edge (Feb. 2021):
--- Rarely: 26.0% (+2.1% from April 2020),
--- Occasionally: 27.1% (-7.6% from April 2020),
--- Frequently: 10.2% (-2.8% from April 2020),
--- Nearly everyday: 14.4% (-5.1% from April 2020),
--- Did not report: 22.4% (+13.3% from April 2020)
- Received counseling or therapy (Feb. 2021): yes: 14.0%, no: 61.5%, did not report: 24.6%
- Took prescription medication to help with mental health (Feb. 2021): yes: 18.5%, no: 57.0%, did not report: 24.6%

22 / 51
evrymmnt // Shutterstock

Michigan

- Frequency of feeling depressed or hopeless (Feb. 2021):
--- Rarely: 35.2% (-10.1% from April 2020),
--- Occasionally: 24.0% (-1.6% from April 2020),
--- Frequently: 8.1% (-2.1% from April 2020),
--- Nearly everyday: 7.8% (-1.2% from April 2020),
--- Did not report: 24.9% (+14.9% from April 2020)
- Frequency of feeling anxious or on edge (Feb. 2021):
--- Rarely: 26.7% (-6.5% from April 2020),
--- Occasionally: 24.6% (-5.5% from April 2020),
--- Frequently: 9.5% (-1.6% from April 2020),
--- Nearly everyday: 14.6% (-1.5% from April 2020),
--- Did not report: 24.7% (+15.2% from April 2020)
- Received counseling or therapy (Feb. 2021): yes: 8.4%, no: 64.5%, did not report: 27.0%
- Took prescription medication to help with mental health (Feb. 2021): yes: 16.0%, no: 56.6%, did not report: 27.3%

23 / 51
Africa Studio // Shutterstock

Minnesota

- Frequency of feeling depressed or hopeless (Feb. 2021):
--- Rarely: 45.5% (-4.0% from April 2020),
--- Occasionally: 20.6% (-7.6% from April 2020),
--- Frequently: 6.4% (-0.9% from April 2020),
--- Nearly everyday: 6.5% (-0.6% from April 2020),
--- Did not report: 21.0% (+13.2% from April 2020)
- Frequency of feeling anxious or on edge (Feb. 2021):
--- Rarely: 35.2% (-0.3% from April 2020),
--- Occasionally: 24.0% (-7.0% from April 2020),
--- Frequently: 8.0% (-3.9% from April 2020),
--- Nearly everyday: 12.0% (-1.7% from April 2020),
--- Did not report: 20.7% (+12.9% from April 2020)
- Received counseling or therapy (Feb. 2021): yes: 8.3%, no: 68.7%, did not report: 23.0%
- Took prescription medication to help with mental health (Feb. 2021): yes: 18.0%, no: 58.9%, did not report: 23.1%

24 / 51
fizkes // Shutterstock

Mississippi

- Frequency of feeling depressed or hopeless (Feb. 2021):
--- Rarely: 34.0% (-15.7% from April 2020),
--- Occasionally: 21.4% (-0.6% from April 2020),
--- Frequently: 6.8% (-1.8% from April 2020),
--- Nearly everyday: 12.5% (+4.7% from April 2020),
--- Did not report: 25.3% (+13.4% from April 2020)
- Frequency of feeling anxious or on edge (Feb. 2021):
--- Rarely: 24.3% (-12.6% from April 2020),
--- Occasionally: 20.1% (-6.3% from April 2020),
--- Frequently: 9.9% (-2.8% from April 2020),
--- Nearly everyday: 19.3% (+7.4% from April 2020),
--- Did not report: 26.3% (+14.4% from April 2020)
- Received counseling or therapy (Feb. 2021): yes: 8.7%, no: 64.5%, did not report: 26.8%
- Took prescription medication to help with mental health (Feb. 2021): yes: 15.8%, no: 57.4%, did not report: 26.7%

25 / 51
fizkes // Shutterstock

Missouri

- Frequency of feeling depressed or hopeless (Feb. 2021):
--- Rarely: 35.9% (-13.3% from April 2020),
--- Occasionally: 24.7% (-3.2% from April 2020),
--- Frequently: 6.5% (-2.8% from April 2020),
--- Nearly everyday: 9.3% (+1.6% from April 2020),
--- Did not report: 23.6% (+17.6% from April 2020)
- Frequency of feeling anxious or on edge (Feb. 2021):
--- Rarely: 27.7% (-10.6% from April 2020),
--- Occasionally: 23.3% (-4.0% from April 2020),
--- Frequently: 9.8% (-5.6% from April 2020),
--- Nearly everyday: 16.0% (+3.0% from April 2020),
--- Did not report: 23.2% (+17.1% from April 2020)
- Received counseling or therapy (Feb. 2021): yes: 6.1%, no: 69.8%, did not report: 24.2%
- Took prescription medication to help with mental health (Feb. 2021): yes: 17.6%, no: 57.7%, did not report: 24.7%

26 / 51
Maridav // Shutterstock

Montana

- Frequency of feeling depressed or hopeless (Feb. 2021):
--- Rarely: 45.5% (-6.5% from April 2020),
--- Occasionally: 24.4% (-3.5% from April 2020),
--- Frequently: 5.8% (-1.4% from April 2020),
--- Nearly everyday: 7.8% (+1.7% from April 2020),
--- Did not report: 16.3% (+9.6% from April 2020)
- Frequency of feeling anxious or on edge (Feb. 2021):
--- Rarely: 36.6% (+0.1% from April 2020),
--- Occasionally: 25.9% (-9.2% from April 2020),
--- Frequently: 9.3% (+0.3% from April 2020),
--- Nearly everyday: 11.8% (-1.0% from April 2020),
--- Did not report: 16.3% (+9.9% from April 2020)
- Received counseling or therapy (Feb. 2021): yes: 8.3%, no: 73.3%, did not report: 18.4%
- Took prescription medication to help with mental health (Feb. 2021): yes: 17.3%, no: 64.3%, did not report: 18.4%

27 / 51
fizkes // Shutterstock

Nebraska

- Frequency of feeling depressed or hopeless (Feb. 2021):
--- Rarely: 42.0% (-11.0% from April 2020),
--- Occasionally: 23.9% (-0.8% from April 2020),
--- Frequently: 5.9% (-2.1% from April 2020),
--- Nearly everyday: 6.4% (-0.6% from April 2020),
--- Did not report: 21.7% (+14.5% from April 2020)
- Frequency of feeling anxious or on edge (Feb. 2021):
--- Rarely: 36.0% (-2.9% from April 2020),
--- Occasionally: 25.8% (-5.4% from April 2020),
--- Frequently: 8.3% (-2.7% from April 2020),
--- Nearly everyday: 8.3% (-3.3% from April 2020),
--- Did not report: 21.6% (+14.3% from April 2020)
- Received counseling or therapy (Feb. 2021): yes: 4.8%, no: 71.8%, did not report: 23.5%
- Took prescription medication to help with mental health (Feb. 2021): yes: 15.7%, no: 61.4%, did not report: 22.8%

28 / 51
Studio4dich // Shutterstock

Nevada

- Frequency of feeling depressed or hopeless (Feb. 2021):
--- Rarely: 32.8% (-11.6% from April 2020),
--- Occasionally: 21.2% (-5.0% from April 2020),
--- Frequently: 9.0% (-3.5% from April 2020),
--- Nearly everyday: 14.3% (+4.8% from April 2020),
--- Did not report: 22.7% (+15.3% from April 2020)
- Frequency of feeling anxious or on edge (Feb. 2021):
--- Rarely: 25.7% (-9.9% from April 2020),
--- Occasionally: 21.4% (-7.7% from April 2020),
--- Frequently: 12.1% (-1.2% from April 2020),
--- Nearly everyday: 18.1% (+3.5% from April 2020),
--- Did not report: 22.6% (+15.2% from April 2020)
- Received counseling or therapy (Feb. 2021): yes: 6.3%, no: 69.3%, did not report: 24.4%
- Took prescription medication to help with mental health (Feb. 2021): yes: 13.7%, no: 61.7%, did not report: 24.6%

29 / 51
FotoDuets // Shutterstock

New Hampshire

- Frequency of feeling depressed or hopeless (Feb. 2021):
--- Rarely: 39.8% (-11.0% from April 2020),
--- Occasionally: 27.8% (+1.6% from April 2020),
--- Frequently: 7.1% (+0.0% from April 2020),
--- Nearly everyday: 8.2% (+0.9% from April 2020),
--- Did not report: 17.2% (+8.5% from April 2020)
- Frequency of feeling anxious or on edge (Feb. 2021):
--- Rarely: 34.1% (+1.8% from April 2020),
--- Occasionally: 25.8% (-5.5% from April 2020),
--- Frequently: 8.7% (-2.2% from April 2020),
--- Nearly everyday: 14.2% (-3.0% from April 2020),
--- Did not report: 17.3% (+8.9% from April 2020)
- Received counseling or therapy (Feb. 2021): yes: 9.2%, no: 72.8%, did not report: 18.1%
- Took prescription medication to help with mental health (Feb. 2021): yes: 19.2%, no: 62.8%, did not report: 18.0%

30 / 51
ArtmannWitte // Shutterstock

New Jersey

- Frequency of feeling depressed or hopeless (Feb. 2021):
--- Rarely: 35.4% (-5.3% from April 2020),
--- Occasionally: 24.9% (-7.5% from April 2020),
--- Frequently: 8.4% (+0.5% from April 2020),
--- Nearly everyday: 7.7% (-0.2% from April 2020),
--- Did not report: 23.7% (+12.5% from April 2020)
- Frequency of feeling anxious or on edge (Feb. 2021):
--- Rarely: 26.5% (-1.7% from April 2020),
--- Occasionally: 26.6% (-7.4% from April 2020),
--- Frequently: 10.1% (-2.4% from April 2020),
--- Nearly everyday: 13.3% (-0.9% from April 2020),
--- Did not report: 23.5% (+12.4% from April 2020)
- Received counseling or therapy (Feb. 2021): yes: 6.8%, no: 66.7%, did not report: 26.4%
- Took prescription medication to help with mental health (Feb. 2021): yes: 11.3%, no: 62.6%, did not report: 26.2%

31 / 51
Pressmaster // Shutterstock

New Mexico

- Frequency of feeling depressed or hopeless (Feb. 2021):
--- Rarely: 33.9% (-14.7% from April 2020),
--- Occasionally: 28.8% (+1.6% from April 2020),
--- Frequently: 8.8% (-0.5% from April 2020),
--- Nearly everyday: 10.3% (+4.6% from April 2020),
--- Did not report: 18.1% (+9.0% from April 2020)
- Frequency of feeling anxious or on edge (Feb. 2021):
--- Rarely: 27.7% (-5.0% from April 2020),
--- Occasionally: 28.0% (-5.8% from April 2020),
--- Frequently: 11.5% (+2.7% from April 2020),
--- Nearly everyday: 14.7% (-0.9% from April 2020),
--- Did not report: 18.2% (+9.1% from April 2020)
- Received counseling or therapy (Feb. 2021): yes: 7.5%, no: 73.1%, did not report: 19.4%
- Took prescription medication to help with mental health (Feb. 2021): yes: 18.3%, no: 62.2%, did not report: 19.5%

32 / 51
Rido // Shutterstock

New York

- Frequency of feeling depressed or hopeless (Feb. 2021):
--- Rarely: 37.0% (-3.0% from April 2020),
--- Occasionally: 23.9% (-4.6% from April 2020),
--- Frequently: 7.7% (-4.0% from April 2020),
--- Nearly everyday: 9.4% (+0.5% from April 2020),
--- Did not report: 21.9% (+11.1% from April 2020)
- Frequency of feeling anxious or on edge (Feb. 2021):
--- Rarely: 26.9% (-1.2% from April 2020),
--- Occasionally: 25.9% (-3.6% from April 2020),
--- Frequently: 9.0% (-7.2% from April 2020),
--- Nearly everyday: 16.4% (+1.2% from April 2020),
--- Did not report: 21.7% (+10.7% from April 2020)
- Received counseling or therapy (Feb. 2021): yes: 7.7%, no: 68.2%, did not report: 24.2%
- Took prescription medication to help with mental health (Feb. 2021): yes: 14.0%, no: 62.0%, did not report: 24.0%

33 / 51
gdefilip // Shutterstock

North Carolina

- Frequency of feeling depressed or hopeless (Feb. 2021):
--- Rarely: 36.9% (-10.8% from April 2020),
--- Occasionally: 22.7% (-5.0% from April 2020),
--- Frequently: 9.5% (+3.3% from April 2020),
--- Nearly everyday: 9.5% (+0.9% from April 2020),
--- Did not report: 21.4% (+11.7% from April 2020)
- Frequency of feeling anxious or on edge (Feb. 2021):
--- Rarely: 29.6% (-3.3% from April 2020),
--- Occasionally: 24.7% (-7.2% from April 2020),
--- Frequently: 10.1% (-1.0% from April 2020),
--- Nearly everyday: 14.1% (-0.1% from April 2020),
--- Did not report: 21.4% (+11.7% from April 2020)
- Received counseling or therapy (Feb. 2021): yes: 7.8%, no: 68.1%, did not report: 24.2%
- Took prescription medication to help with mental health (Feb. 2021): yes: 18.8%, no: 57.1%, did not report: 24.1%

34 / 51
Vadym Pastukh// Shutterstock

North Dakota

- Frequency of feeling depressed or hopeless (Feb. 2021):
--- Rarely: 47.2% (+2.0% from April 2020),
--- Occasionally: 21.6% (-10.0% from April 2020),
--- Frequently: 4.7% (-4.2% from April 2020),
--- Nearly everyday: 6.9% (+2.6% from April 2020),
--- Did not report: 19.6% (+9.6% from April 2020)
- Frequency of feeling anxious or on edge (Feb. 2021):
--- Rarely: 38.3% (+0.7% from April 2020),
--- Occasionally: 22.5% (-10.5% from April 2020),
--- Frequently: 8.8% (-1.3% from April 2020),
--- Nearly everyday: 10.4% (+1.2% from April 2020),
--- Did not report: 20.0% (+9.9% from April 2020)
- Received counseling or therapy (Feb. 2021): yes: 8.8%, no: 70.2%, did not report: 21.0%
- Took prescription medication to help with mental health (Feb. 2021): yes: 20.7%, no: 58.2%, did not report: 21.1%

35 / 51
czechexplorerphotography // Shutterstock

Ohio

- Frequency of feeling depressed or hopeless (Feb. 2021):
--- Rarely: 38.7% (-7.3% from April 2020),
--- Occasionally: 20.9% (-8.6% from April 2020),
--- Frequently: 7.9% (+0.8% from April 2020),
--- Nearly everyday: 10.7% (+1.7% from April 2020),
--- Did not report: 21.9% (+13.5% from April 2020)
- Frequency of feeling anxious or on edge (Feb. 2021):
--- Rarely: 31.6% (-0.4% from April 2020),
--- Occasionally: 20.2% (-11.9% from April 2020),
--- Frequently: 8.7% (-3.6% from April 2020),
--- Nearly everyday: 17.7% (+2.6% from April 2020),
--- Did not report: 21.8% (+13.4% from April 2020)
- Received counseling or therapy (Feb. 2021): yes: 8.4%, no: 66.9%, did not report: 24.8%
- Took prescription medication to help with mental health (Feb. 2021): yes: 16.6%, no: 58.4%, did not report: 25.0%

36 / 51
Suzanne Tucker // Shutterstock

Oklahoma

- Frequency of feeling depressed or hopeless (Feb. 2021):
--- Rarely: 34.9% (-14.3% from April 2020),
--- Occasionally: 24.2% (-2.7% from April 2020),
--- Frequently: 8.0% (+0.2% from April 2020),
--- Nearly everyday: 10.8% (+3.6% from April 2020),
--- Did not report: 22.0% (+13.2% from April 2020)
- Frequency of feeling anxious or on edge (Feb. 2021):
--- Rarely: 25.9% (-7.7% from April 2020),
--- Occasionally: 24.2% (-8.5% from April 2020),
--- Frequently: 11.3% (+0.1% from April 2020),
--- Nearly everyday: 16.7% (+3.1% from April 2020),
--- Did not report: 21.9% (+13.0% from April 2020)
- Received counseling or therapy (Feb. 2021): yes: 6.3%, no: 71.4%, did not report: 22.2%
- Took prescription medication to help with mental health (Feb. 2021): yes: 18.0%, no: 59.8%, did not report: 22.2%

37 / 51
Sunti // Shutterstock

Oregon

- Frequency of feeling depressed or hopeless (Feb. 2021):
--- Rarely: 37.7% (-7.1% from April 2020),
--- Occasionally: 27.8% (-4.1% from April 2020),
--- Frequently: 10.5% (+1.7% from April 2020),
--- Nearly everyday: 9.3% (+1.8% from April 2020),
--- Did not report: 14.6% (+7.6% from April 2020)
- Frequency of feeling anxious or on edge (Feb. 2021):
--- Rarely: 26.8% (-3.5% from April 2020),
--- Occasionally: 27.6% (-5.7% from April 2020),
--- Frequently: 13.2% (+0.4% from April 2020),
--- Nearly everyday: 18.0% (+1.5% from April 2020),
--- Did not report: 14.5% (+7.5% from April 2020)
- Received counseling or therapy (Feb. 2021): yes: 10.3%, no: 74.2%, did not report: 15.5%
- Took prescription medication to help with mental health (Feb. 2021): yes: 17.6%, no: 66.8%, did not report: 15.6%

38 / 51
Chanintorn.v // Shutterstock

Pennsylvania

- Frequency of feeling depressed or hopeless (Feb. 2021):
--- Rarely: 37.3% (-7.8% from April 2020),
--- Occasionally: 23.3% (-4.5% from April 2020),
--- Frequently: 8.8% (-0.1% from April 2020),
--- Nearly everyday: 9.3% (+0.2% from April 2020),
--- Did not report: 21.3% (+12.1% from April 2020)
- Frequency of feeling anxious or on edge (Feb. 2021):
--- Rarely: 27.5% (-3.3% from April 2020),
--- Occasionally: 25.8% (-6.6% from April 2020),
--- Frequently: 10.3% (-0.2% from April 2020),
--- Nearly everyday: 15.1% (-2.1% from April 2020),
--- Did not report: 21.3% (+12.2% from April 2020)
- Received counseling or therapy (Feb. 2021): yes: 8.6%, no: 68.8%, did not report: 22.6%
- Took prescription medication to help with mental health (Feb. 2021): yes: 19.6%, no: 57.3%, did not report: 23.1%

39 / 51
Aonprom Photo // Shutterstock

Rhode Island

- Frequency of feeling depressed or hopeless (Feb. 2021):
--- Rarely: 34.7% (-13.0% from April 2020),
--- Occasionally: 22.9% (-0.8% from April 2020),
--- Frequently: 9.0% (-2.1% from April 2020),
--- Nearly everyday: 8.2% (+0.2% from April 2020),
--- Did not report: 25.1% (+15.9% from April 2020)
- Frequency of feeling anxious or on edge (Feb. 2021):
--- Rarely: 30.2% (-4.1% from April 2020),
--- Occasionally: 20.0% (-12.7% from April 2020),
--- Frequently: 11.5% (+1.4% from April 2020),
--- Nearly everyday: 13.6% (+0.1% from April 2020),
--- Did not report: 24.8% (+15.2% from April 2020)
- Received counseling or therapy (Feb. 2021): yes: 9.1%, no: 64.1%, did not report: 26.8%
- Took prescription medication to help with mental health (Feb. 2021): yes: 16.6%, no: 56.7%, did not report: 26.8%

40 / 51
Motortion Films // Shutterstock

South Carolina

- Frequency of feeling depressed or hopeless (Feb. 2021):
--- Rarely: 40.0% (-6.9% from April 2020),
--- Occasionally: 20.3% (-3.0% from April 2020),
--- Frequently: 10.1% (+2.0% from April 2020),
--- Nearly everyday: 8.8% (+0.5% from April 2020),
--- Did not report: 20.8% (+7.4% from April 2020)
- Frequency of feeling anxious or on edge (Feb. 2021):
--- Rarely: 32.6% (+0.5% from April 2020),
--- Occasionally: 24.2% (-7.4% from April 2020),
--- Frequently: 9.2% (-0.3% from April 2020),
--- Nearly everyday: 13.3% (-0.2% from April 2020),
--- Did not report: 20.8% (+7.4% from April 2020)
- Received counseling or therapy (Feb. 2021): yes: 6.8%, no: 69.6%, did not report: 23.5%
- Took prescription medication to help with mental health (Feb. 2021): yes: 16.7%, no: 60.4%, did not report: 22.9%

41 / 51
Rido // Shutterstock

South Dakota

- Frequency of feeling depressed or hopeless (Feb. 2021):
--- Rarely: 46.3% (-6.5% from April 2020),
--- Occasionally: 23.6% (-3.0% from April 2020),
--- Frequently: 7.1% (+1.3% from April 2020),
--- Nearly everyday: 6.8% (+2.4% from April 2020),
--- Did not report: 16.3% (+5.7% from April 2020)
- Frequency of feeling anxious or on edge (Feb. 2021):
--- Rarely: 39.1% (+0.1% from April 2020),
--- Occasionally: 23.0% (-6.5% from April 2020),
--- Frequently: 11.2% (-3.0% from April 2020),
--- Nearly everyday: 10.7% (+4.0% from April 2020),
--- Did not report: 16.1% (+5.4% from April 2020)
- Received counseling or therapy (Feb. 2021): yes: 7.0%, no: 74.2%, did not report: 18.8%
- Took prescription medication to help with mental health (Feb. 2021): yes: 15.7%, no: 66.1%, did not report: 18.2%

42 / 51
Tommaso79// Shutterstock

Tennessee

- Frequency of feeling depressed or hopeless (Feb. 2021):
--- Rarely: 36.0% (-11.7% from April 2020),
--- Occasionally: 23.2% (-5.3% from April 2020),
--- Frequently: 8.6% (+0.6% from April 2020),
--- Nearly everyday: 10.7% (+1.6% from April 2020),
--- Did not report: 21.4% (+14.7% from April 2020)
- Frequency of feeling anxious or on edge (Feb. 2021):
--- Rarely: 27.7% (-8.7% from April 2020),
--- Occasionally: 23.3% (-9.5% from April 2020),
--- Frequently: 11.4% (+1.2% from April 2020),
--- Nearly everyday: 16.3% (+3.1% from April 2020),
--- Did not report: 21.2% (+13.9% from April 2020)
- Received counseling or therapy (Feb. 2021): yes: 8.3%, no: 68.7%, did not report: 22.9%
- Took prescription medication to help with mental health (Feb. 2021): yes: 17.9%, no: 59.1%, did not report: 23.0%

43 / 51
FotoDuets // Shutterstock

Texas

- Frequency of feeling depressed or hopeless (Feb. 2021):
--- Rarely: 34.5% (-15.0% from April 2020),
--- Occasionally: 21.2% (-1.9% from April 2020),
--- Frequently: 8.0% (-0.5% from April 2020),
--- Nearly everyday: 8.3% (-0.8% from April 2020),
--- Did not report: 28.0% (+18.2% from April 2020)
- Frequency of feeling anxious or on edge (Feb. 2021):
--- Rarely: 25.9% (-8.8% from April 2020),
--- Occasionally: 22.4% (-7.6% from April 2020),
--- Frequently: 8.3% (-2.3% from April 2020),
--- Nearly everyday: 15.5% (+0.7% from April 2020),
--- Did not report: 27.8% (+18.0% from April 2020)
- Received counseling or therapy (Feb. 2021): yes: 6.0%, no: 63.3%, did not report: 30.7%
- Took prescription medication to help with mental health (Feb. 2021): yes: 13.3%, no: 56.0%, did not report: 30.7%

44 / 51
fizkes // Shutterstock

Utah

- Frequency of feeling depressed or hopeless (Feb. 2021):
--- Rarely: 42.0% (-4.9% from April 2020),
--- Occasionally: 23.9% (-5.8% from April 2020),
--- Frequently: 9.1% (+0.4% from April 2020),
--- Nearly everyday: 8.8% (+2.3% from April 2020),
--- Did not report: 16.2% (+8.0% from April 2020)
- Frequency of feeling anxious or on edge (Feb. 2021):
--- Rarely: 32.1% (-1.6% from April 2020),
--- Occasionally: 24.9% (-6.9% from April 2020),
--- Frequently: 9.5% (-2.4% from April 2020),
--- Nearly everyday: 17.1% (+2.8% from April 2020),
--- Did not report: 16.4% (+8.1% from April 2020)
- Received counseling or therapy (Feb. 2021): yes: 12.7%, no: 69.9%, did not report: 17.4%
- Took prescription medication to help with mental health (Feb. 2021): yes: 23.0%, no: 59.5%, did not report: 17.5%

45 / 51
CandyRetriever // Shutterstock

Vermont

- Frequency of feeling depressed or hopeless (Feb. 2021):
--- Rarely: 44.0% (-0.9% from April 2020),
--- Occasionally: 21.4% (-11.0% from April 2020),
--- Frequently: 10.1% (-0.1% from April 2020),
--- Nearly everyday: 10.9% (+4.5% from April 2020),
--- Did not report: 13.6% (+7.6% from April 2020)
- Frequency of feeling anxious or on edge (Feb. 2021):
--- Rarely: 33.3% (+2.8% from April 2020),
--- Occasionally: 27.2% (-8.2% from April 2020),
--- Frequently: 10.8% (-3.3% from April 2020),
--- Nearly everyday: 15.0% (+1.2% from April 2020),
--- Did not report: 13.7% (+7.5% from April 2020)
- Received counseling or therapy (Feb. 2021): yes: 10.1%, no: 75.4%, did not report: 14.4%
- Took prescription medication to help with mental health (Feb. 2021): yes: 17.6%, no: 67.8%, did not report: 14.6%

46 / 51
sunabesyou // Shutterstock

Virginia

- Frequency of feeling depressed or hopeless (Feb. 2021):
--- Rarely: 41.2% (-8.8% from April 2020),
--- Occasionally: 23.7% (-2.5% from April 2020),
--- Frequently: 7.6% (+0.8% from April 2020),
--- Nearly everyday: 9.0% (+1.5% from April 2020),
--- Did not report: 18.5% (+9.1% from April 2020)
- Frequency of feeling anxious or on edge (Feb. 2021):
--- Rarely: 31.9% (-3.1% from April 2020),
--- Occasionally: 25.6% (-5.3% from April 2020),
--- Frequently: 10.7% (-0.8% from April 2020),
--- Nearly everyday: 13.7% (+0.2% from April 2020),
--- Did not report: 18.2% (+8.9% from April 2020)
- Received counseling or therapy (Feb. 2021): yes: 8.3%, no: 70.5%, did not report: 21.2%
- Took prescription medication to help with mental health (Feb. 2021): yes: 15.5%, no: 63.2%, did not report: 21.3%

47 / 51
fizkes // Shutterstock

Washington

- Frequency of feeling depressed or hopeless (Feb. 2021):
--- Rarely: 39.6% (-6.9% from April 2020),
--- Occasionally: 28.0% (-0.9% from April 2020),
--- Frequently: 8.5% (0.0% from April 2020),
--- Nearly everyday: 9.3% (+1.4% from April 2020),
--- Did not report: 14.6% (+6.4% from April 2020)
- Frequency of feeling anxious or on edge (Feb. 2021):
--- Rarely: 30.4% (-0.5% from April 2020),
--- Occasionally: 26.5% (-6.9% from April 2020),
--- Frequently: 11.7% (-0.5% from April 2020),
--- Nearly everyday: 17.1% (+1.7% from April 2020),
--- Did not report: 14.3% (+6.2% from April 2020)
- Received counseling or therapy (Feb. 2021): yes: 10.4%, no: 73.4%, did not report: 16.2%
- Took prescription medication to help with mental health (Feb. 2021): yes: 18.0%, no: 65.7%, did not report: 16.4%

48 / 51
fizkes // Shutterstock

Washington D.C.

- Frequency of feeling depressed or hopeless (Feb. 2021):
--- Rarely: 38.5% (-0.1% from April 2020),
--- Occasionally: 31.9% (-1.6% from April 2020),
--- Frequently: 6.8% (-4.3% from April 2020),
--- Nearly everyday: 7.3% (-2.1% from April 2020),
--- Did not report: 15.5% (+8.1% from April 2020)
- Frequency of feeling anxious or on edge (Feb. 2021):
--- Rarely: 26.9% (+1.0% from April 2020),
--- Occasionally: 29.5% (-8.2% from April 2020),
--- Frequently: 11.9% (-1.9% from April 2020),
--- Nearly everyday: 16.2% (+1.3% from April 2020),
--- Did not report: 15.5% (+7.9% from April 2020)
- Received counseling or therapy (Feb. 2021): yes: 15.5%, no: 66.5%, did not report: 18.0%
- Took prescription medication to help with mental health (Feb. 2021): yes: 15.2%, no: 66.8%, did not report: 18.0%

49 / 51
Pormezz // Shutterstock

West Virginia

- Frequency of feeling depressed or hopeless (Feb. 2021):
--- Rarely: 34.2% (-10.3% from April 2020),
--- Occasionally: 25.2% (-3.6% from April 2020),
--- Frequently: 6.0% (-1.8% from April 2020),
--- Nearly everyday: 11.9% (+2.2% from April 2020),
--- Did not report: 22.8% (+13.5% from April 2020)
- Frequency of feeling anxious or on edge (Feb. 2021):
--- Rarely: 31.1% (-4.0% from April 2020),
--- Occasionally: 22.0% (-8.1% from April 2020),
--- Frequently: 7.4% (-3.5% from April 2020),
--- Nearly everyday: 16.7% (+2.1% from April 2020),
--- Did not report: 22.8% (+13.5% from April 2020)
- Received counseling or therapy (Feb. 2021): yes: 6.1%, no: 69.1%, did not report: 24.7%
- Took prescription medication to help with mental health (Feb. 2021): yes: 21.0%, no: 54.3%, did not report: 24.7%

50 / 51
Africa Studio // Shutterstock

Wisconsin

- Frequency of feeling depressed or hopeless (Feb. 2021):
--- Rarely: 47.0% (+0.3% from April 2020),
--- Occasionally: 20.4% (-6.2% from April 2020),
--- Frequently: 7.9% (+0.7% from April 2020),
--- Nearly everyday: 7.3% (-2.2% from April 2020),
--- Did not report: 17.4% (+7.4% from April 2020)
- Frequency of feeling anxious or on edge (Feb. 2021):
--- Rarely: 38.6% (+2.8% from April 2020),
--- Occasionally: 23.9% (-6.7% from April 2020),
--- Frequently: 7.9% (-1.2% from April 2020),
--- Nearly everyday: 12.7% (-1.9% from April 2020),
--- Did not report: 17.0% (+7.0% from April 2020)
- Received counseling or therapy (Feb. 2021): yes: 5.9%, no: 74.2%, did not report: 19.9%
- Took prescription medication to help with mental health (Feb. 2021): yes: 17.3%, no: 62.8%, did not report: 19.8%

51 / 51
VK Studio // Shutterstock

Wyoming

- Frequency of feeling depressed or hopeless (Feb. 2021):
--- Rarely: 34.7% (-12.7% from April 2020),
--- Occasionally: 25.6% (-5.6% from April 2020),
--- Frequently: 8.3% (-0.4% from April 2020),
--- Nearly everyday: 10.9% (+5.1% from April 2020),
--- Did not report: 20.5% (+13.5% from April 2020)
- Frequency of feeling anxious or on edge (Feb. 2021):
--- Rarely: 34.8% (-4.1% from April 2020),
--- Occasionally: 17.4% (-13.1% from April 2020),
--- Frequently: 9.9% (-1.6% from April 2020),
--- Nearly everyday: 17.1% (+5.0% from April 2020),
--- Did not report: 20.8% (+13.8% from April 2020)
- Received counseling or therapy (Feb. 2021): yes: 8.2%, no: 70.6%, did not report: 21.1%
- Took prescription medication to help with mental health (Feb. 2021): yes: 18.5%, no: 61.0%, did not report: 20.5%

Trending Now