How are children hurt at school? An analysis of emergency room admission data
How are children hurt at school? An analysis of emergency room admission data
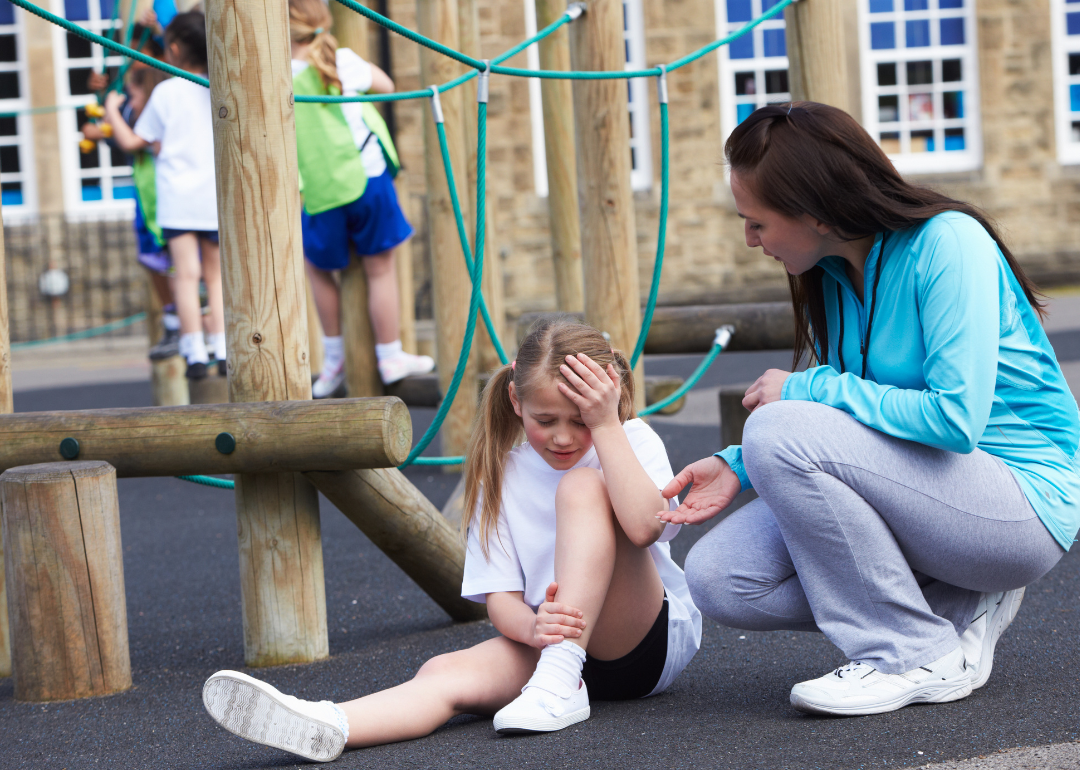
The 2023-2024 school year is in full swing, and students are back in classrooms across the country. While a new school year is full of excitement, it also brings the risk of students getting injured while on campus.
What do you need to know about school injuries as your kids return to class this fall?
To answer that question, The Fine Law Firm analyzed records of school injuries collected by the National Electronic Injury Surveillance System (NEISS), a database maintained by the U.S. Consumer Product Safety Commission that uses a sample of emergency departments to estimate the total number of emergency department visits nationwide caused by certain consumer products or other factors.
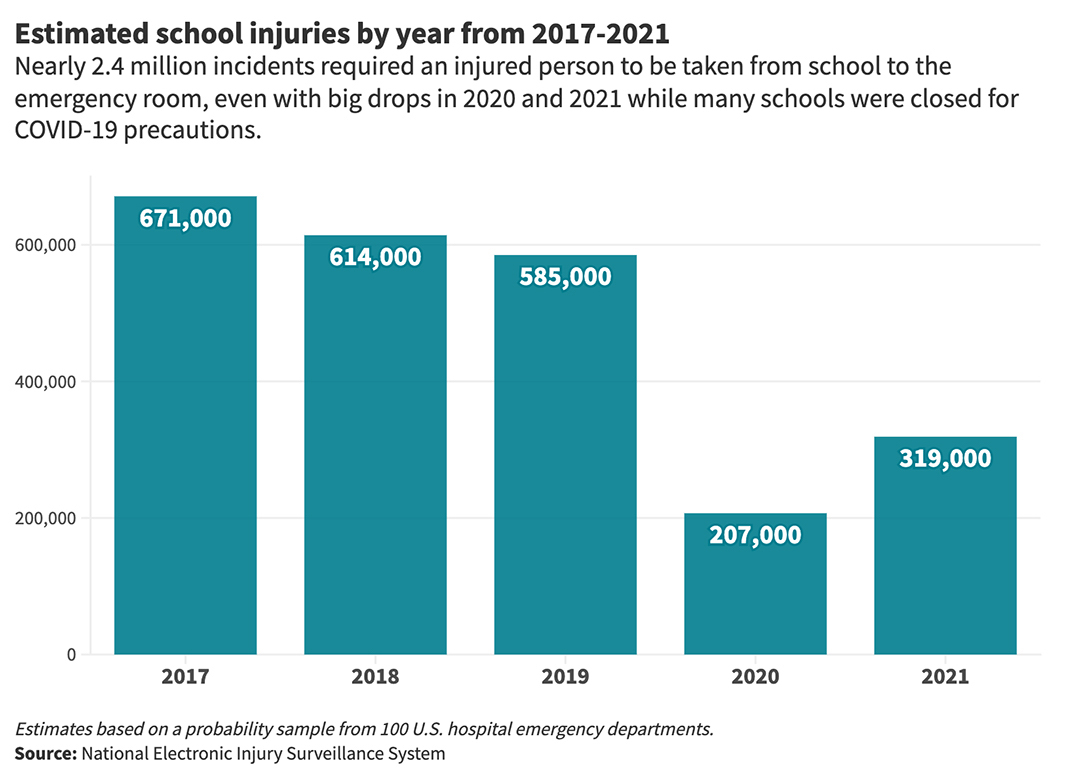
While school injuries dropped during the onset of COVID, they began to rebound alongside returns to in-person learning in 2021
NEISS data estimates that nearly 2.4 million people were taken from U.S. schools to the hospital from January 2017 through December 2021, even with a significant dip in 2020 and early 2021 while many schools went remote as a COVID-19 precaution.
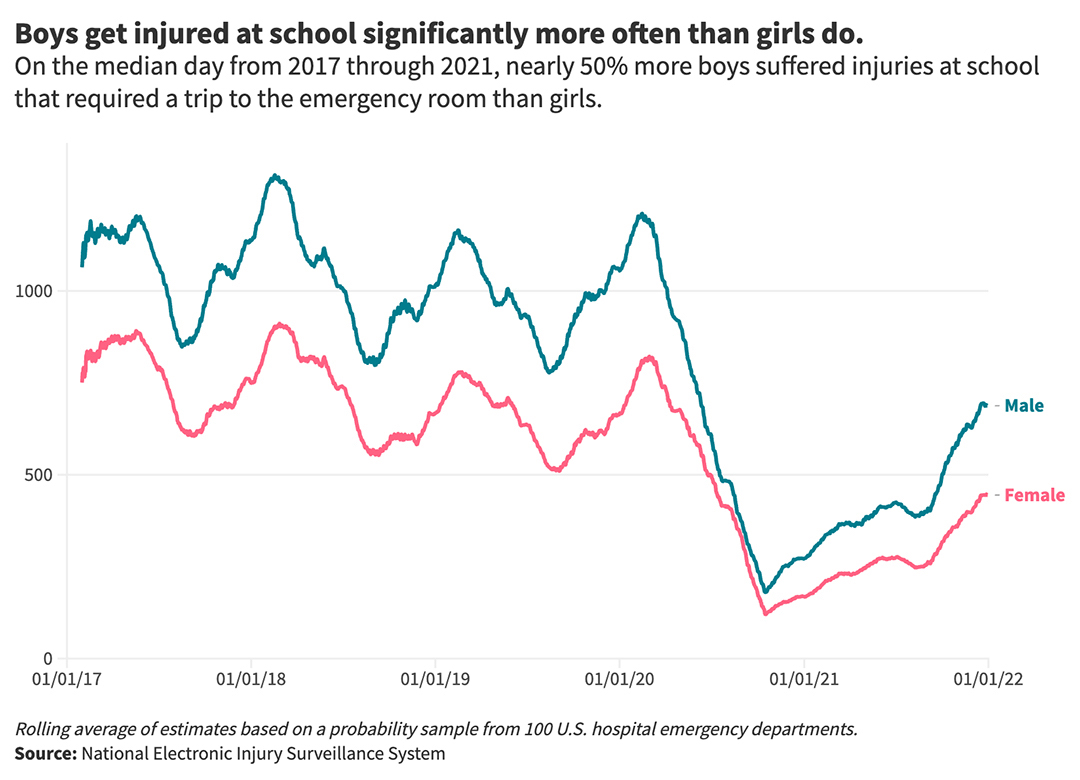
Boys are much more likely to get injured at school than girls
One trend that stands out is that male students require emergency medical treatment significantly more often than female students. In fact, on the median day during the time period examined, nearly 50% more boys than girls were taken from school to the emergency department.
Injuries are more common early in the school year
Additionally, many of the days with most injuries occur in the fall semester. We'll set aside 2020 and 2021 because seasonality data is skewed by school closings, but in each year from 2017-2019, 42% of the total injuries occurred after September 1st – and at least seven of the 10 days with the most student emergency department visits each year fell in the fall.
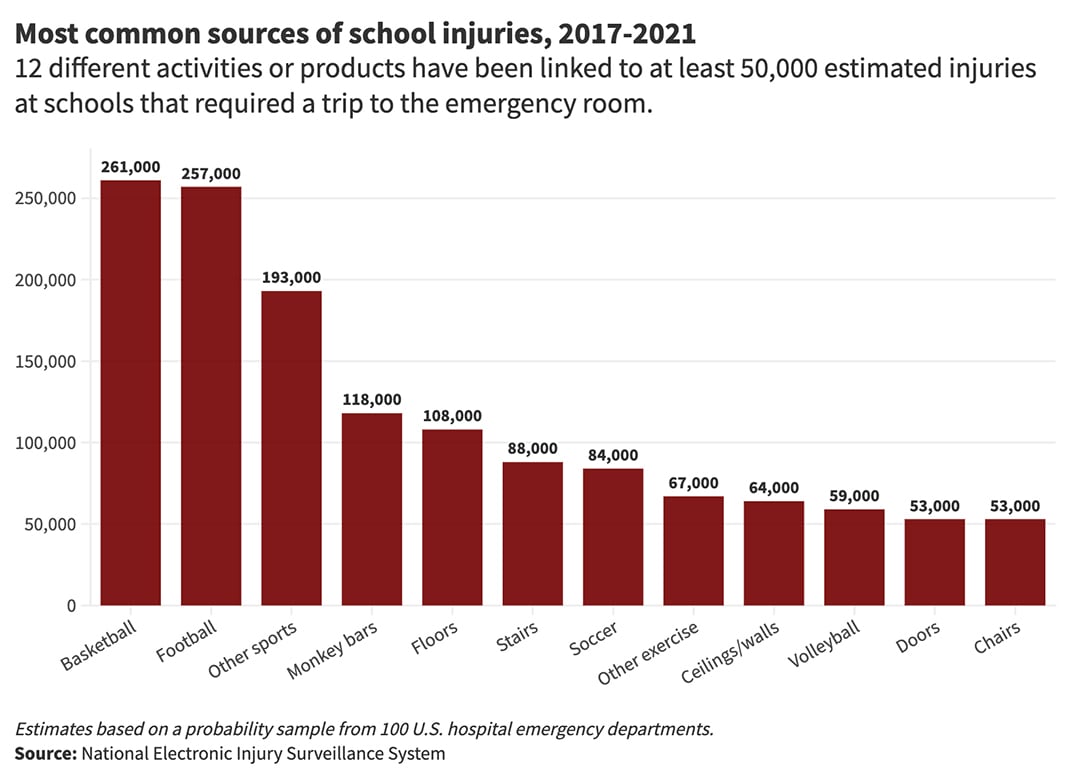
Sports are a frequent source of school injuries, but so are floors and stairs
One likely reason that boys are injured more often than girls, and that so many injuries take place in the fall semester, is that the two most common sources of injuries requiring students to head to the emergency room are football and basketball, which account for more than 20% of the total emergency department visits by students – an estimated 250,000 injuries or more for each sport.
Soccer and volleyball, as well as exercise and other unspecified sports/recreational activity, are also on the list of the top 10 sources linked to school injuries, along with floors, stairs, ceilings and walls, and playground climbing apparatus like monkey bars — all of which were linked to at least 50,000 injuries from 2017-2021.
Sports occupying several of the top spots on the list of injury causes could also explain part of the gap between boys and girls. While female participation in high school sports has been on the rise for decades, there were still nearly 1.2 million more boys participating in athletics.
Here are the top 10 sources linked to school injuries:
1. Basketball
Estimated number of injuries: 261,000
Most common diagnosis: Strain/sprain (36%)
2. Football
Estimated number of injuries: 257,000
Most common diagnosis: Strain/sprain (25%)
3. Other sports/recreation
Estimated number of injuries: 193,000
Most common diagnosis: Strain/sprain (34%)
4. Monkey bars/other playground climbing apparatus
Estimated number of injuries: 118,000
Most common diagnosis: Fracture (49%)
5. Floor/flooring materials
Estimated number of injuries: 108,000
Most common diagnosis: Internal injury (27%)
6. Stairs/steps
Estimated number of injuries: 88,000
Most common diagnosis: Strain/sprain (31%)
7. Soccer
Estimated number of injuries: 84,000
Most common diagnosis: Strain/sprain (27%)
8.Exercise (with no other equipment)
Estimated number of injuries: 67,000
Most common diagnosis: Strain/sprain (37%)
9. Interior ceilings/walls
Estimated number of injuries: 64,000
Most common diagnosis: Internal injury (22%)
10. Volleyball
Estimated number of injuries: 59,000
Most common diagnosis: Strain/sprain (42%)
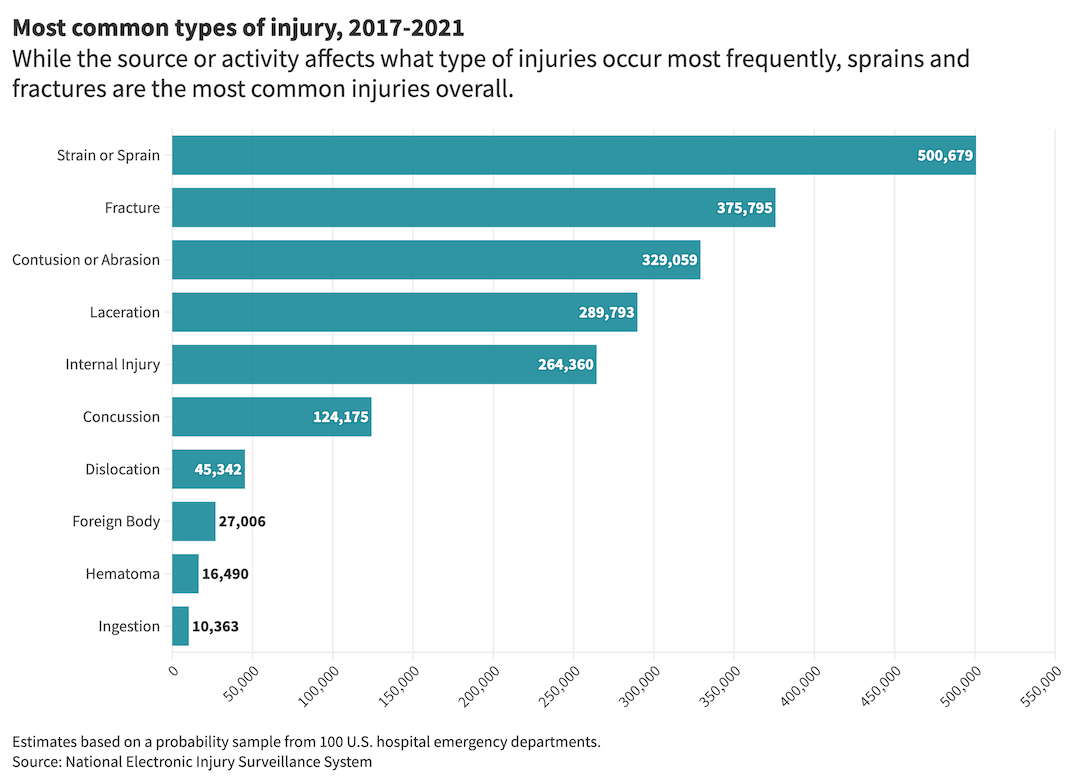
Common sources of school injuries
Sprains or strains and fractures, which occur commonly in athletic contexts, are the most frequent types of school injuries that require emergency department visits, making up more than one-third of the incidents in the NEISS data.
But the context of the injury matters. For example, injuries caused by floors or ceilings are significantly more likely to involve internal injuries, while nearly half of injuries incurred on the monkey bars are fractures. Football, perhaps unsurprisingly, is responsible for a little over 10% of the total injuries, but it accounts for more than 20% of the concussions.
Injuries to the head or face are the most common
Head injuries are the most common type of school injury. In fact, close to 30% of all injuries involve the head or face, where lacerations (cuts) and internal injuries are more common. Another 15% of injuries are to knees and ankles, where strains and sprains are the most common — more than 70% of ankle injuries at schools are strains or sprains. An additional 9% of school injuries involve fingers, where fractures are the most frequent outcome.
Most injured students are treated and released
Fortunately, the overwhelming majority of school injuries — even when they require a trip to the hospital — are not very serious. In the NEISS dataset, 97% of injuries are either treated on an outpatient basis or examined and released without the need for further treatment. An additional 2% of school-related injuries are either admitted to the hospital where they are initially taken or transferred to a different facility for treatment. And less than 1 in 42,000 school injuries — an estimated 57 nationwide from 2017 through 2021 — were fatal.
Data sources and methodology
This analysis is based on data from the National Electronic Injury Surveillance System. NEISS uses data collected from 100 hospitals' emergency departments as a probability sample to estimate the number of injuries associated with specific consumer products or activities. We isolated any injuries that indicated that they took place in a school setting from January 2017 through December 2021.
This story was produced by The Fine Law Firm and reviewed and distributed by Stacker Media.


