Stacker compiled a list of the counties with the best commutes in Idaho using data from the U.S. Census Bureau. Counties are ranked by the shortest average travel time to work, with ties broken by lowest percent of residents that commute over 60 minutes, and any further ties broken by lowest percent of residents that work outside the county of residence.
You may also like: Best private colleges in Idaho
#44. Boise County
- Mean travel time to work: 35.3
- Workers with 60+ minute commute: 17.9%
- Worked outside of county of residence: 50.2%
#43. Camas County
- Mean travel time to work: 35.2
- Workers with 60+ minute commute: 23.2%
- Worked outside of county of residence: 53.4%
#42. Lincoln County
- Mean travel time to work: 32.6
- Workers with 60+ minute commute: 21.7%
- Worked outside of county of residence: 51.2%
David Gilder // Shutterstock
4 / 44#41. Clark County
- Mean travel time to work: 30.4
- Workers with 60+ minute commute: 17.1%
- Worked outside of county of residence: 34.9%
MKStyle // Shutterstock
6 / 44#39. Gem County
- Mean travel time to work: 29.4
- Workers with 60+ minute commute: 12.9%
- Worked outside of county of residence: 41.6%
#38. Teton County
- Mean travel time to work: 28.2
- Workers with 60+ minute commute: 10.9%
- Worked outside of county of residence: 3.7%
#37. Owyhee County
- Mean travel time to work: 26.7
- Workers with 60+ minute commute: 12.5%
- Worked outside of county of residence: 54.8%
#36. Clearwater County
- Mean travel time to work: 26.1
- Workers with 60+ minute commute: 17.1%
- Worked outside of county of residence: 12.6%
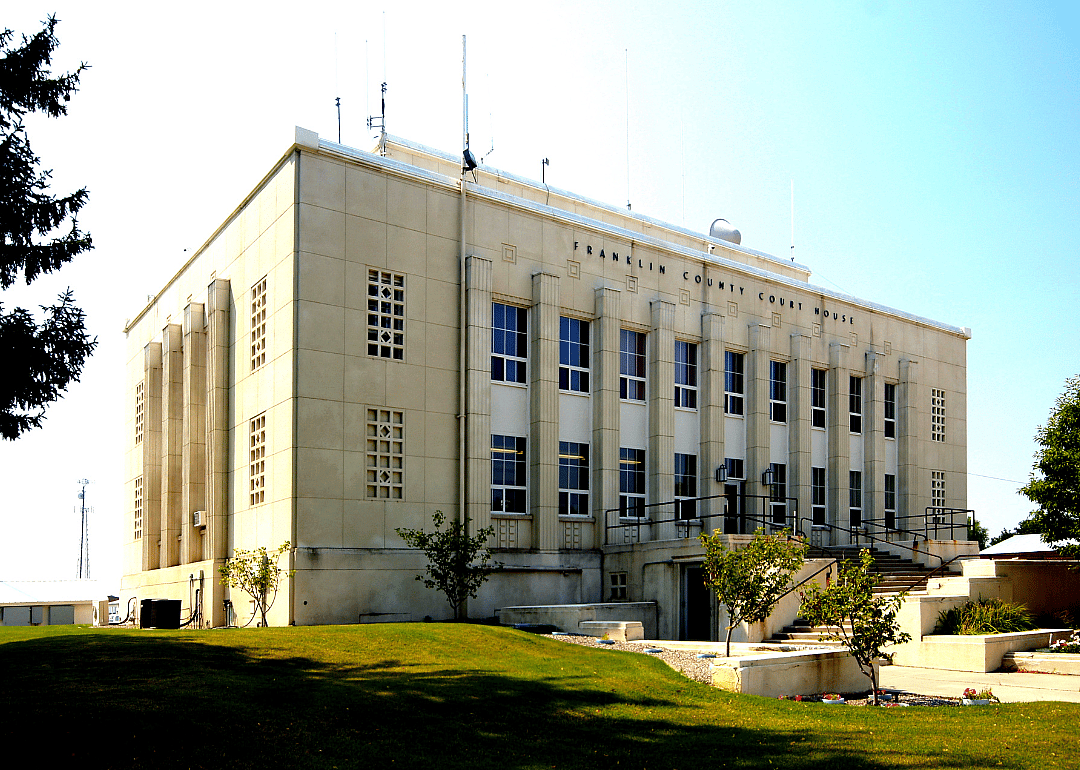
#34. Franklin County
- Mean travel time to work: 25.9
- Workers with 60+ minute commute: 7.9%
- Worked outside of county of residence: 1.5%
#33. Canyon County
- Mean travel time to work: 25.2
- Workers with 60+ minute commute: 4.3%
- Worked outside of county of residence: 34.6%
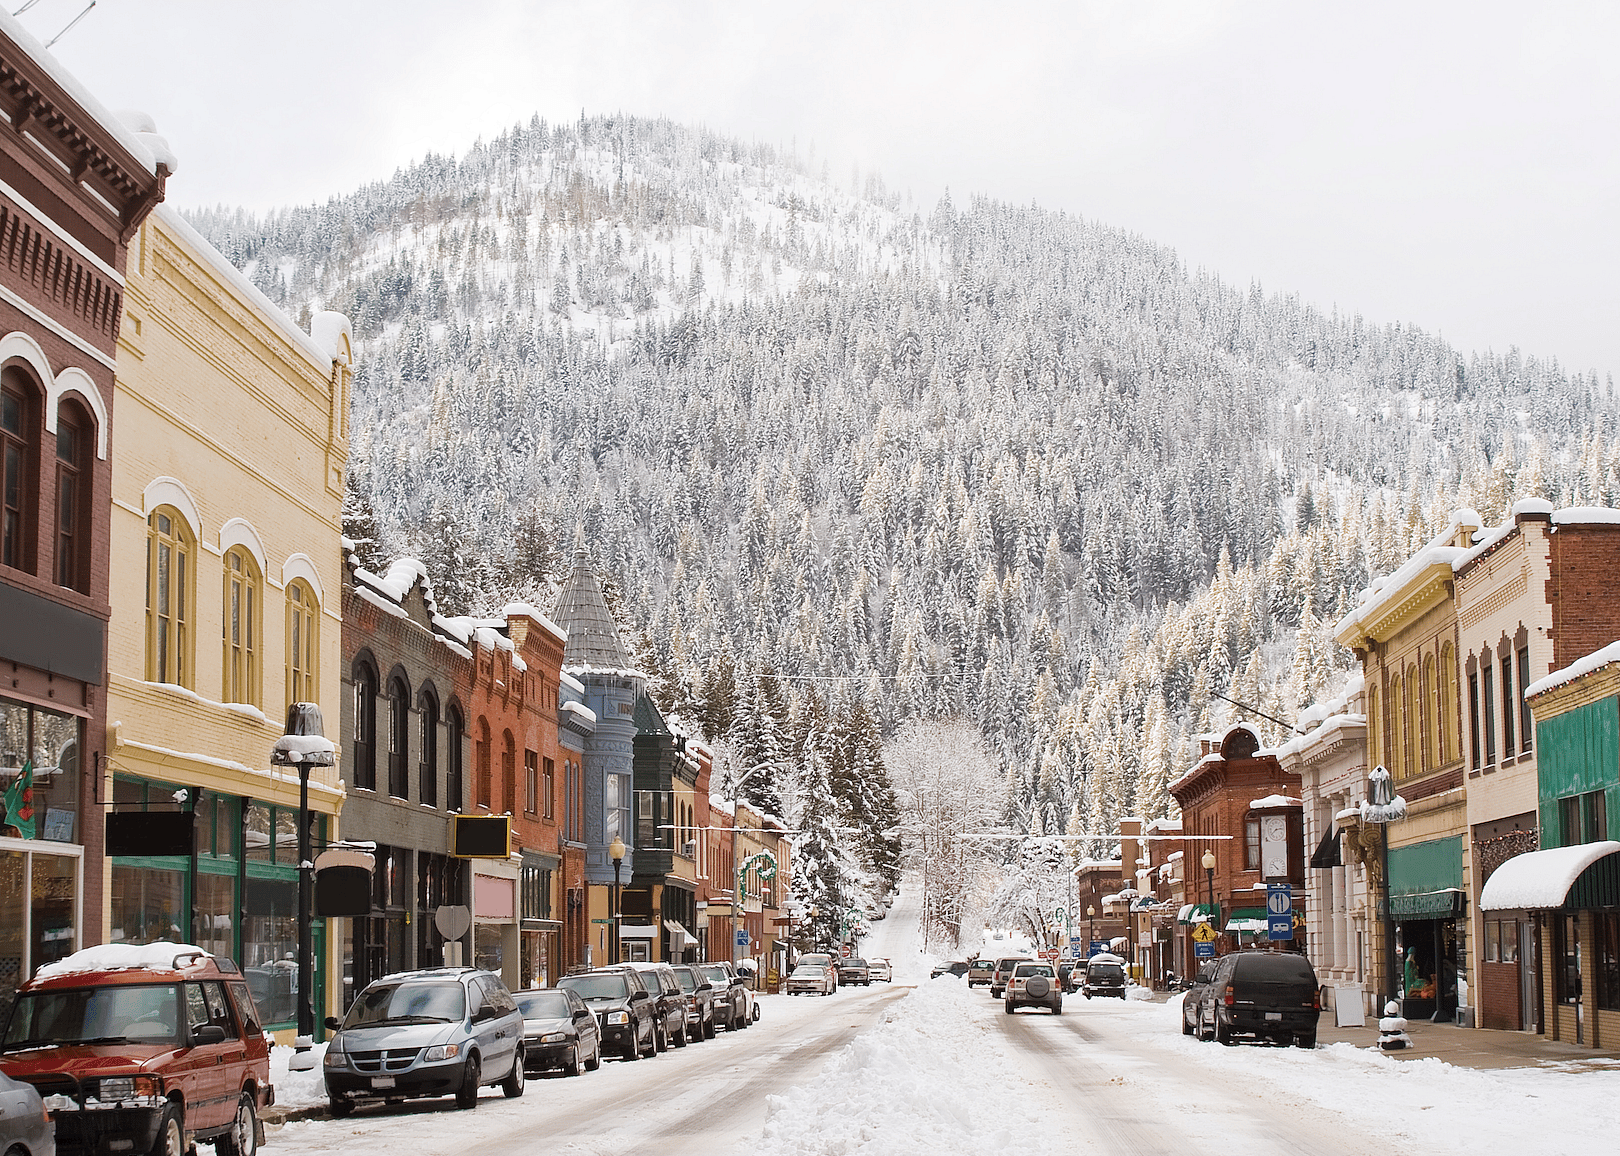
#32. Boundary County
- Mean travel time to work: 24.8
- Workers with 60+ minute commute: 9.2%
- Worked outside of county of residence: 9.9%
#31. Adams County
- Mean travel time to work: 24.5
- Workers with 60+ minute commute: 11.0%
- Worked outside of county of residence: 40.6%
#29. Bonner County
- Mean travel time to work: 24.1
- Workers with 60+ minute commute: 8.2%
- Worked outside of county of residence: 11.1%
B Brown // Shutterstock
17 / 44#28. Jefferson County
- Mean travel time to work: 23.2
- Workers with 60+ minute commute: 6.3%
- Worked outside of county of residence: 52.1%
Tucker James // Shutterstock
18 / 44#27. Bingham County
- Mean travel time to work: 22.9
- Workers with 60+ minute commute: 4.6%
- Worked outside of county of residence: 36.3%
Norm Lane // Shutterstock
19 / 44#26. Benewah County
- Mean travel time to work: 22.4
- Workers with 60+ minute commute: 10.5%
- Worked outside of county of residence: 21.0%
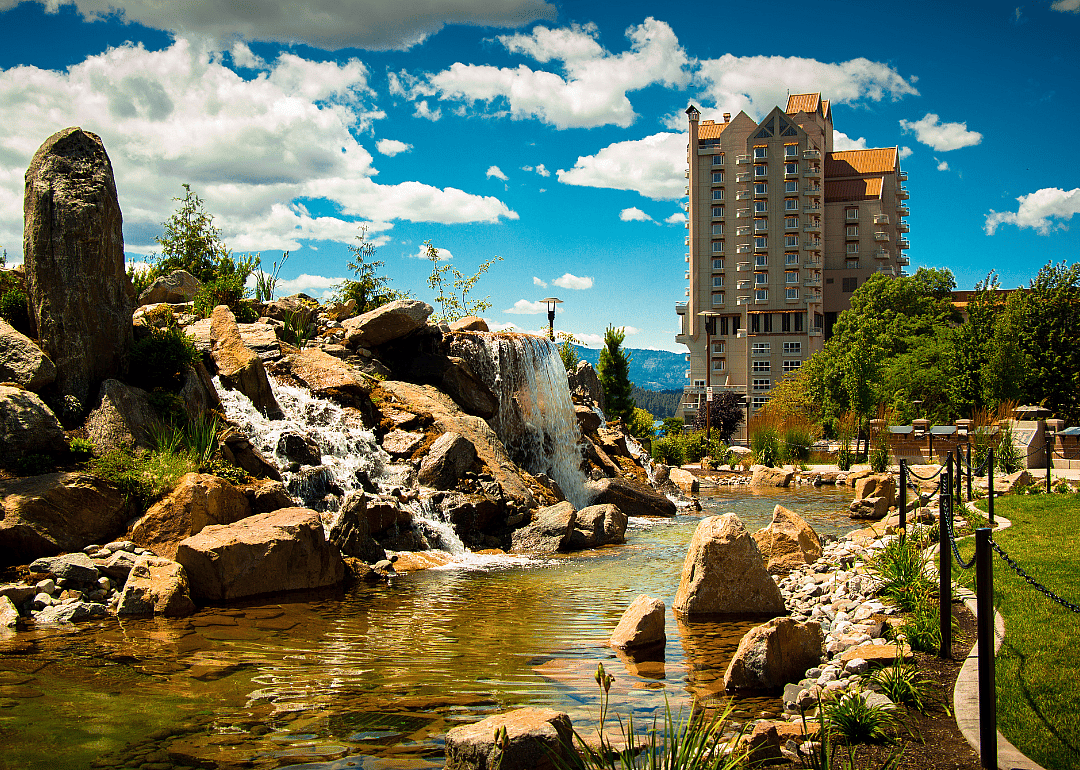
#24. Kootenai County
- Mean travel time to work: 22.1
- Workers with 60+ minute commute: 4.9%
- Worked outside of county of residence: 2.5%
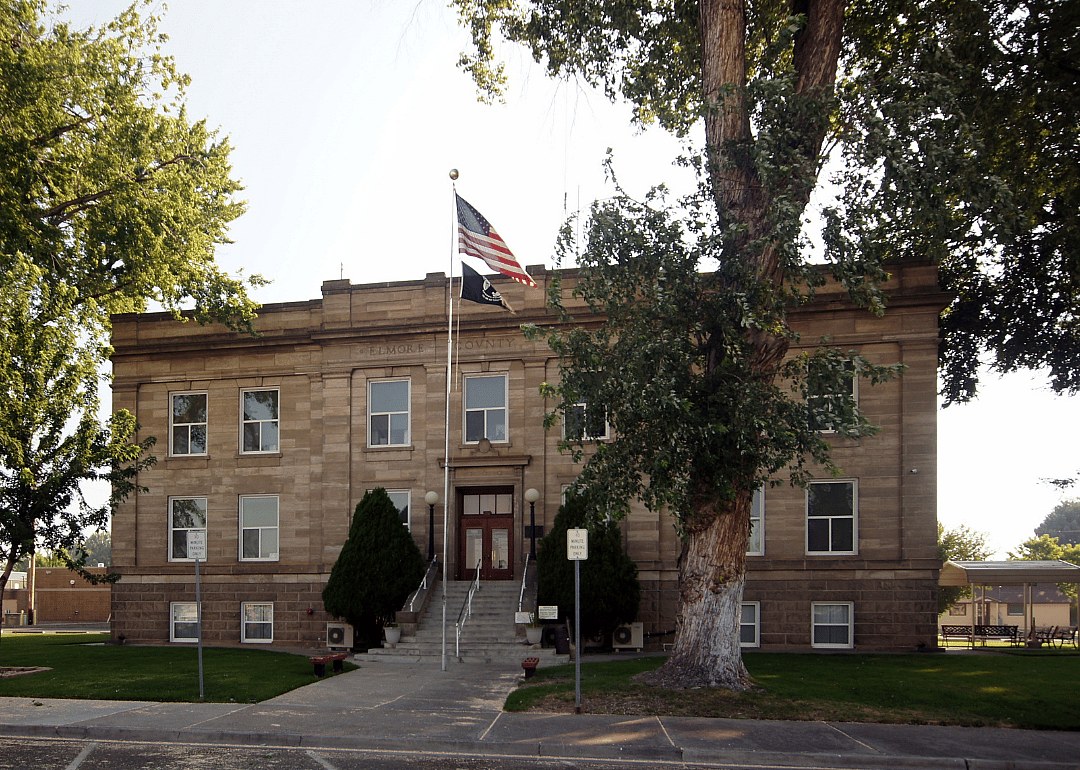
#23. Elmore County
- Mean travel time to work: 21.6
- Workers with 60+ minute commute: 8.0%
- Worked outside of county of residence: 14.9%
melissamn // Shutterstock
23 / 44#22. Lewis County
- Mean travel time to work: 21.4
- Workers with 60+ minute commute: 10.1%
- Worked outside of county of residence: 36.9%
Charles Knowles // Shutterstock
24 / 44#21. Ada County
- Mean travel time to work: 21.0
- Workers with 60+ minute commute: 2.6%
- Worked outside of county of residence: 6.8%
jfergusonphotos // Shutterstock
25 / 44#19. Bonneville County
- Mean travel time to work: 20.1
- Workers with 60+ minute commute: 7.3%
- Worked outside of county of residence: 11.0%
#18. Payette County
- Mean travel time to work: 20.1
- Workers with 60+ minute commute: 5.2%
- Worked outside of county of residence: 18.9%
davidrh // Shutterstock
28 / 44#17. Butte County
- Mean travel time to work: 19.8
- Workers with 60+ minute commute: 6.1%
- Worked outside of county of residence: 15.5%
Danita Delimont // Shutterstock
29 / 44#16. Latah County
- Mean travel time to work: 19.2
- Workers with 60+ minute commute: 4.7%
- Worked outside of county of residence: 6.6%
#14. Caribou County
- Mean travel time to work: 19.0
- Workers with 60+ minute commute: 8.5%
- Worked outside of county of residence: 9.4%
#13. Twin Falls County
- Mean travel time to work: 18.9
- Workers with 60+ minute commute: 4.2%
- Worked outside of county of residence: 12.6%
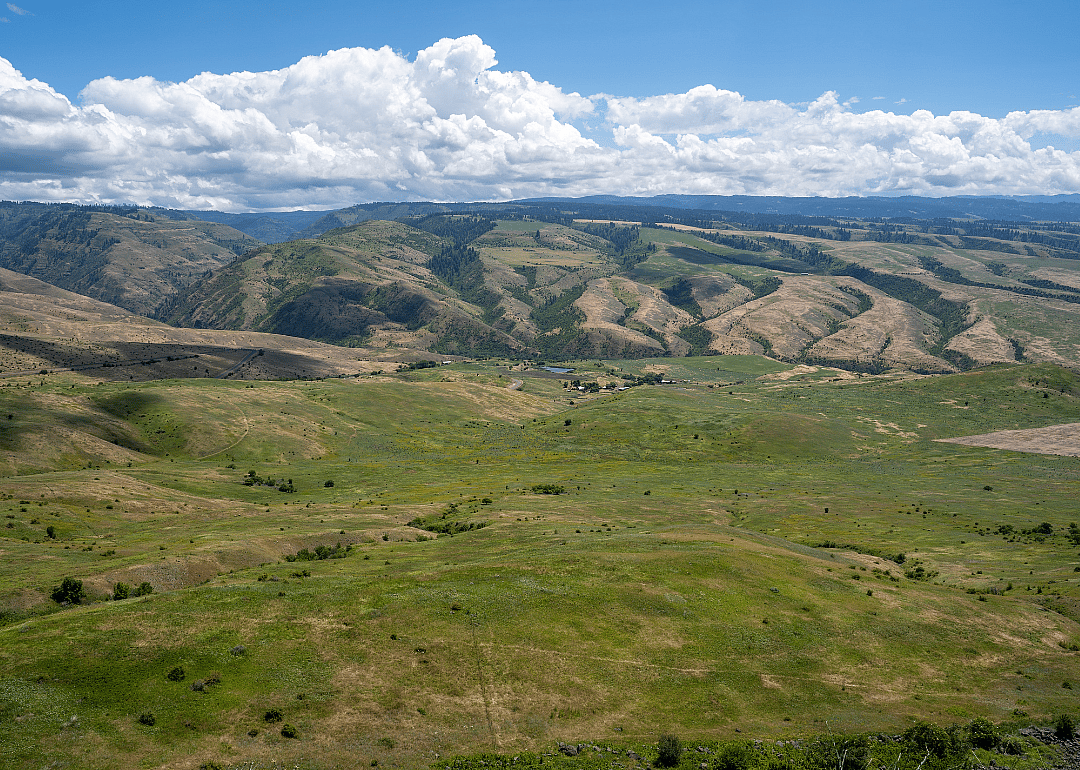
#12. Idaho County
- Mean travel time to work: 18.5
- Workers with 60+ minute commute: 8.7%
- Worked outside of county of residence: 18.9%
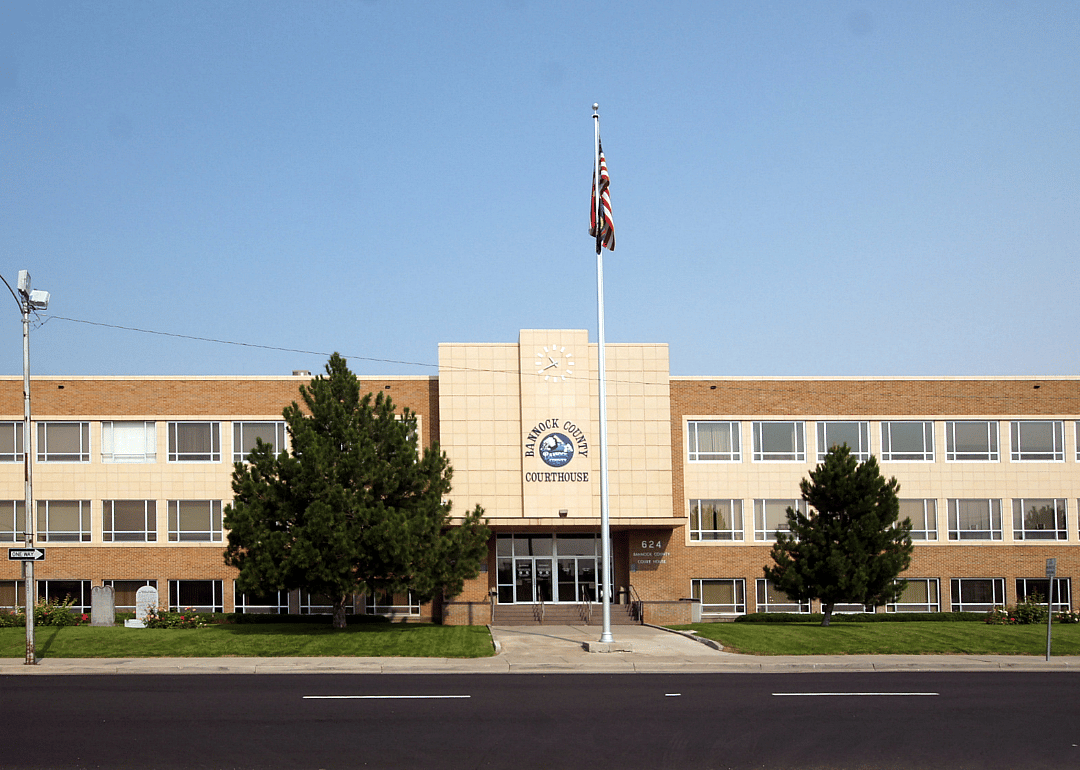
#11. Bannock County
- Mean travel time to work: 18.2
- Workers with 60+ minute commute: 5.3%
- Worked outside of county of residence: 12.0%
#9. Nez Perce County
- Mean travel time to work: 17.3
- Workers with 60+ minute commute: 3.7%
- Worked outside of county of residence: 3.3%
#8. Power County
- Mean travel time to work: 17.2
- Workers with 60+ minute commute: 1.0%
- Worked outside of county of residence: 29.6%
#7. Washington County
- Mean travel time to work: 17.1
- Workers with 60+ minute commute: 4.5%
- Worked outside of county of residence: 10.6%
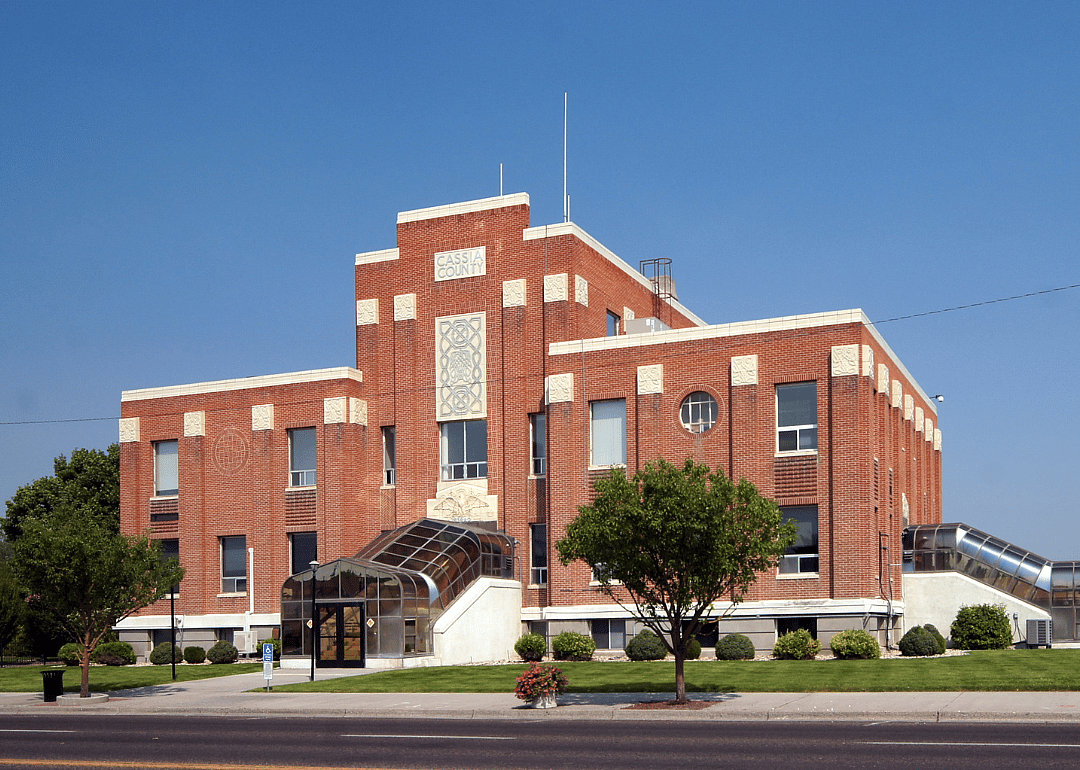
#6. Cassia County
- Mean travel time to work: 16.0
- Workers with 60+ minute commute: 2.9%
- Worked outside of county of residence: 26.3%
#4. Madison County
- Mean travel time to work: 15.3
- Workers with 60+ minute commute: 3.2%
- Worked outside of county of residence: 17.1%
#3. Lemhi County
- Mean travel time to work: 15.1
- Workers with 60+ minute commute: 5.0%
- Worked outside of county of residence: 3.8%
#2. Custer County
- Mean travel time to work: 14.7
- Workers with 60+ minute commute: 5.6%
- Worked outside of county of residence: 9.8%
#1. Valley County
- Mean travel time to work: 11.4
- Workers with 60+ minute commute: 1.3%
- Worked outside of county of residence: 1.6%