Counties with the most bridges in dire need of repair in Illinois
One in three U.S. bridges is in need of repair or replacement, according to data from the American Road & Transportation Builders Association, including 29% of interstate bridges. The cost to make these repairs is estimated to be in excess of $54 billion.
Stacker investigated which counties in Illinois have the most bridges in dire need of repair using data from the Federal Highway Administration. The data is accurate as of June 15, 2022. Counties are ranked by percent of bridges in "poor" condition and ties are broken by percent square meters of bridges in poor condition. Counties that have no bridges or have no bridges in poor condition are excluded from the list.
- Bridges in poor condition: 11.5% (13 of 113 bridges)
- Square meters of bridges in poor condition: 9.9% (2,957 of 29,771 square meters of bridges)
2 / 20
Canva
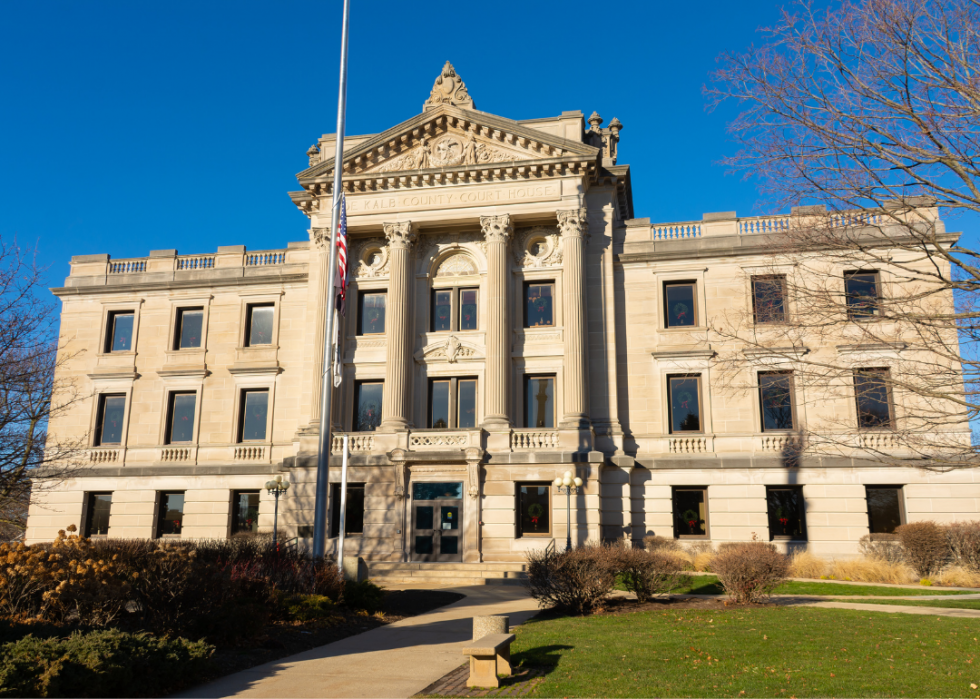
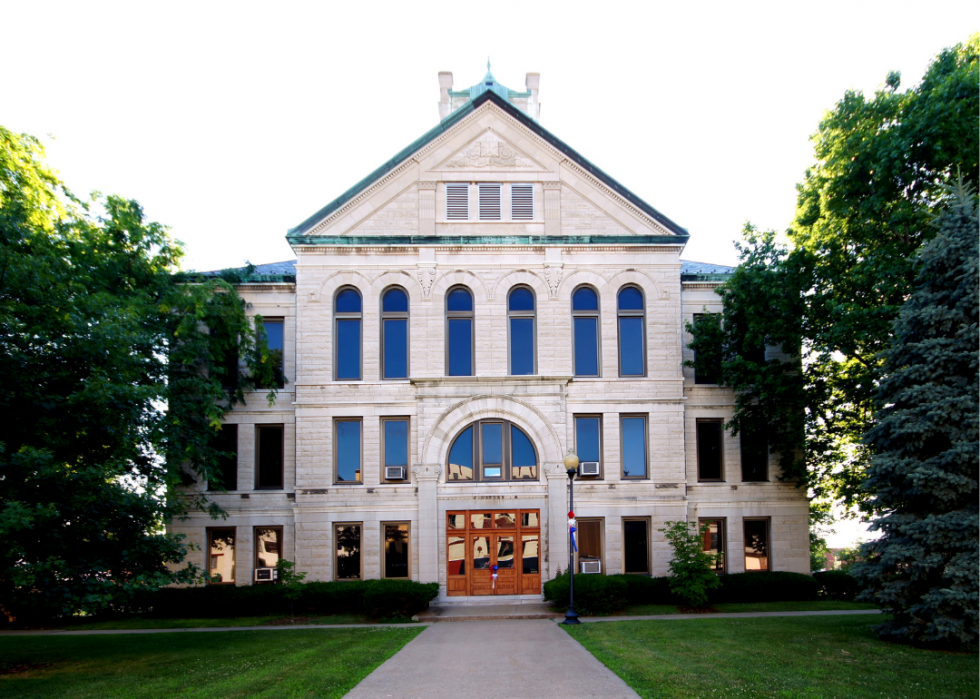
#19. DeKalb County
- Bridges in poor condition: 12.3% (32 of 261 bridges)
- Square meters of bridges in poor condition: 9.3% (5,794 of 62,364 square meters of bridges)
3 / 20
Canva
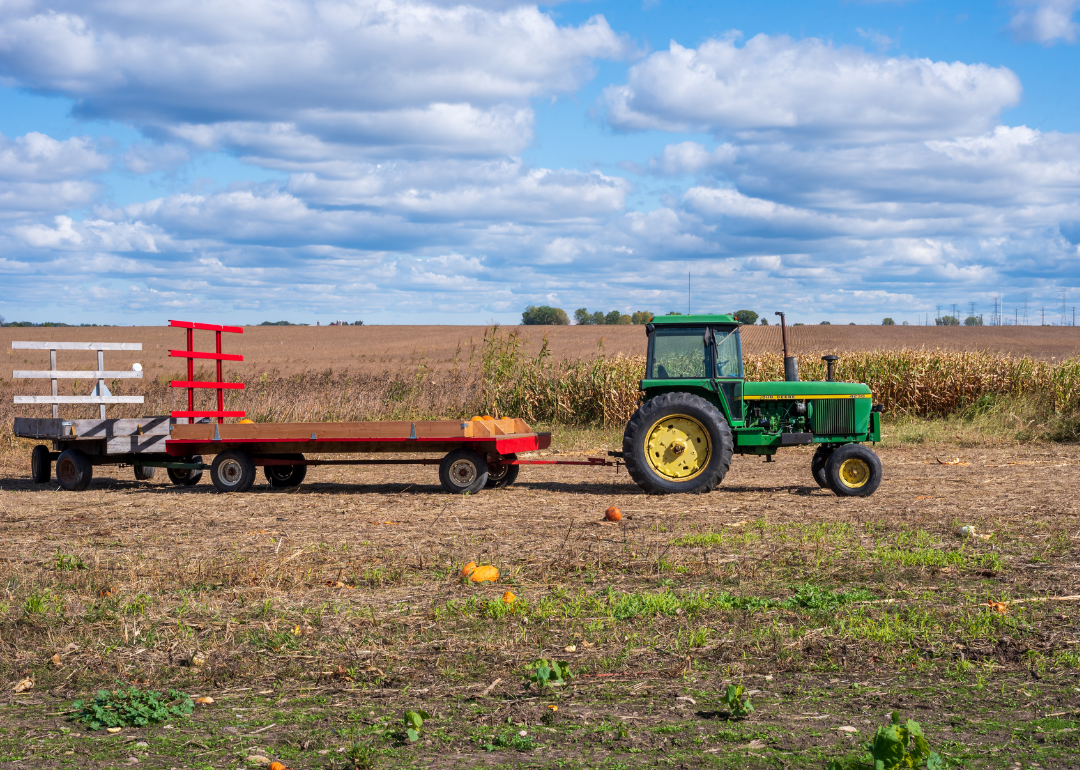
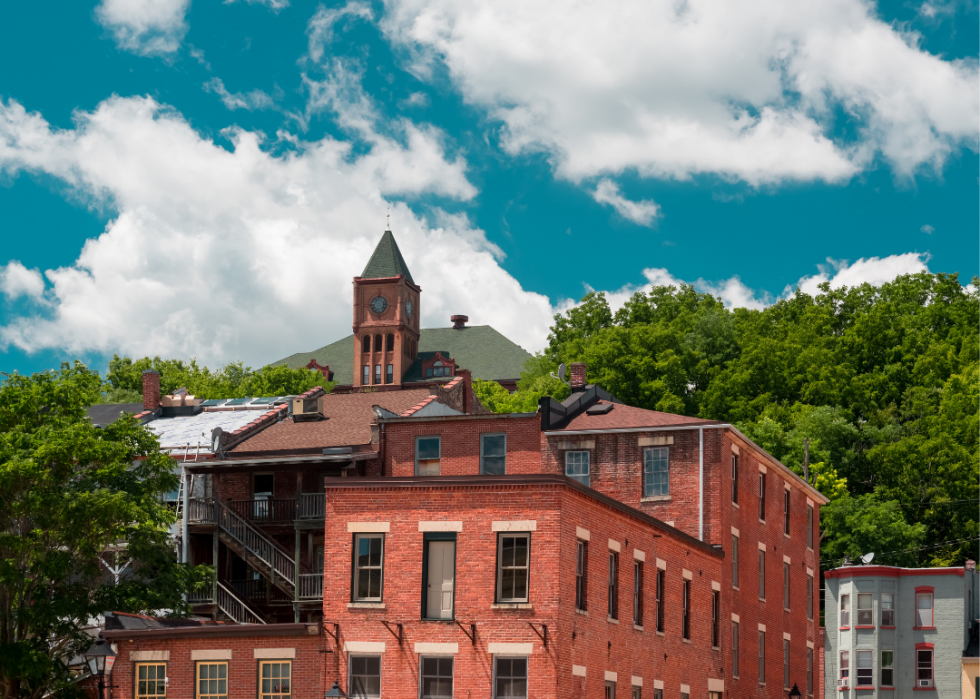
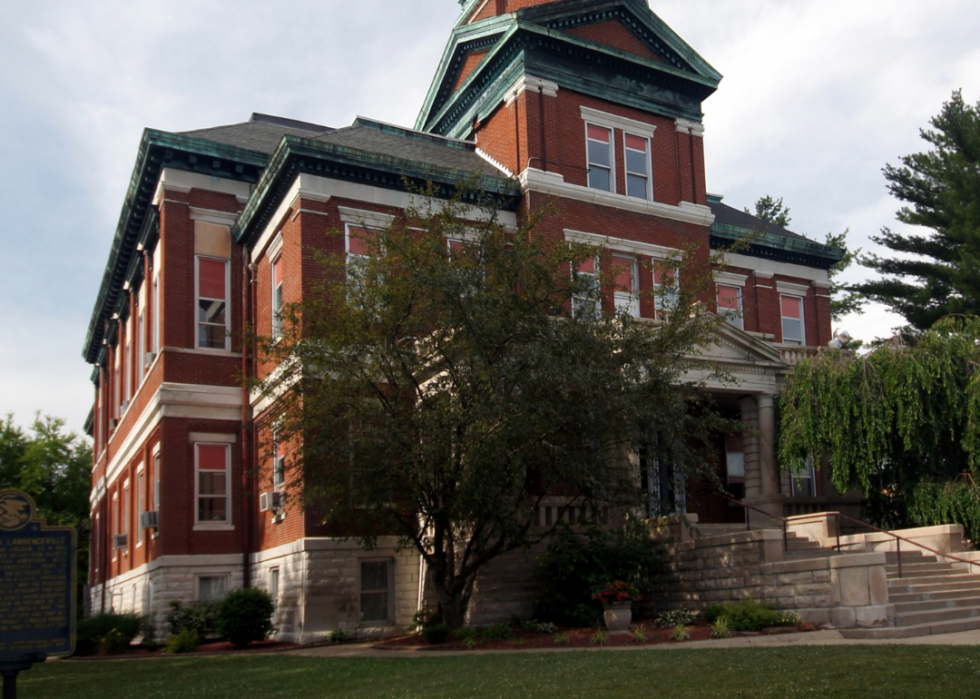
#18. Jo Daviess County
- Bridges in poor condition: 12.4% (24 of 194 bridges)
- Square meters of bridges in poor condition: 6.0% (3,764 of 63,059 square meters of bridges)
4 / 20
Canva
#17. Lee County
- Bridges in poor condition: 13.0% (48 of 370 bridges)
- Square meters of bridges in poor condition: 7.0% (6,883 of 98,457 square meters of bridges)
5 / 20
Canva
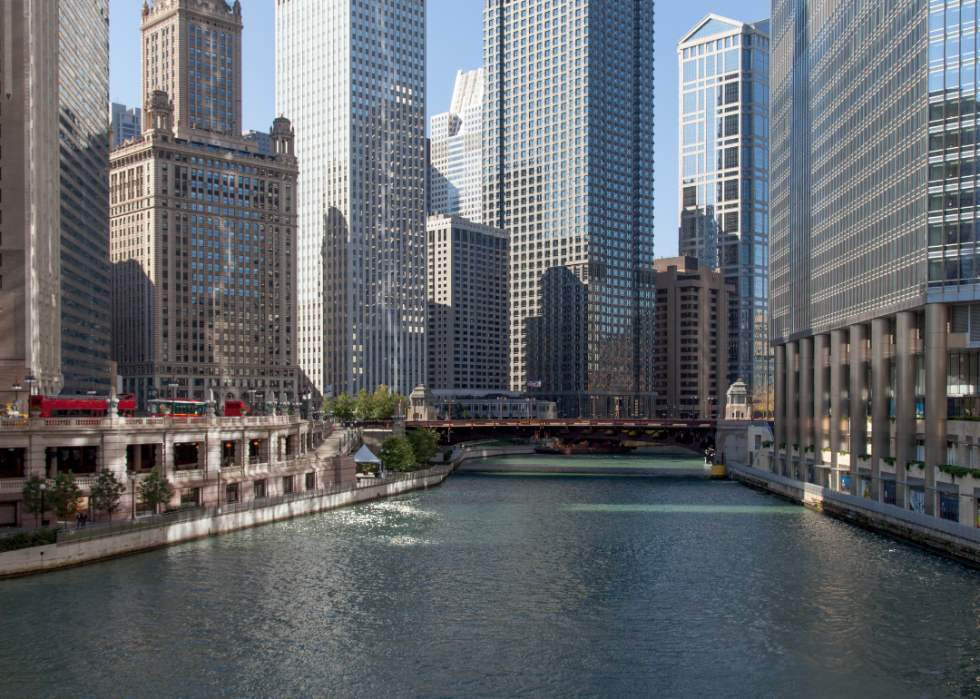
#16. Cook County
- Bridges in poor condition: 13.8% (237 of 1,715 bridges)
- Square meters of bridges in poor condition: 17.1% (548,031 of 3,204,178 square meters of bridges)
- Bridges in poor condition: 14.0% (7 of 50 bridges)
- Square meters of bridges in poor condition: 15.5% (1,451 of 9,383 square meters of bridges)
7 / 20
Ken Schulze // Shutterstock
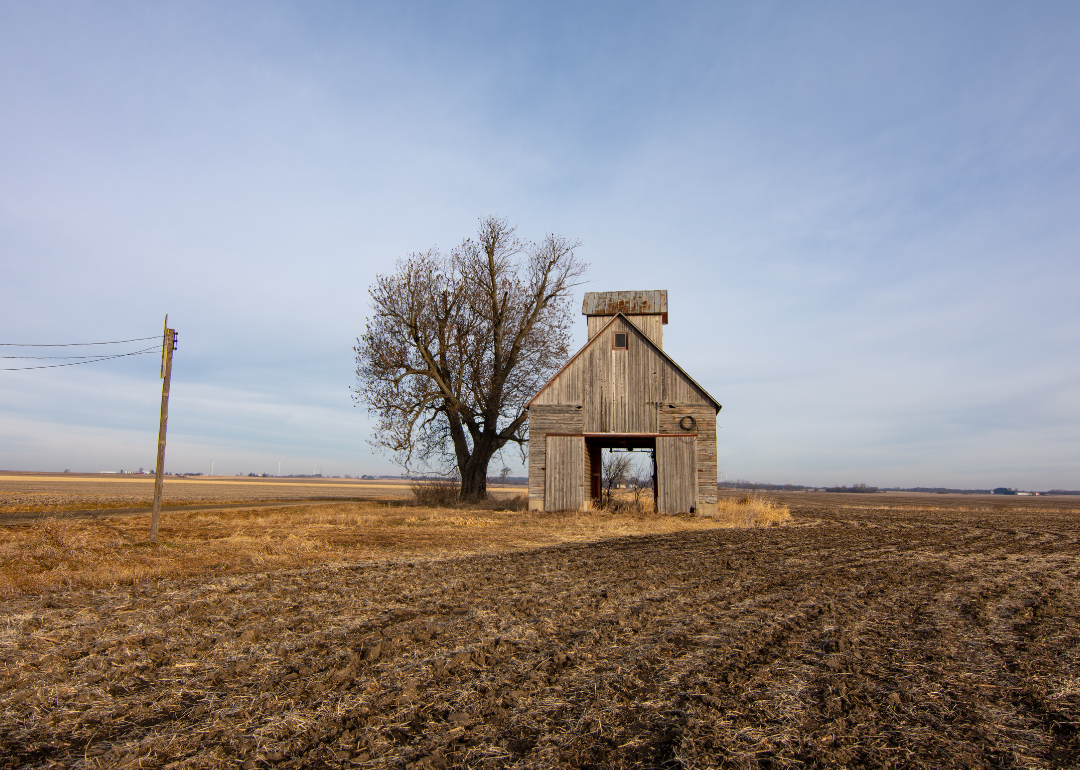
#14. Brown County
- Bridges in poor condition: 14.3% (10 of 70 bridges)
- Square meters of bridges in poor condition: 9.8% (1,557 of 15,819 square meters of bridges)
8 / 20
Canva
#13. Iroquois County
- Bridges in poor condition: 14.4% (82 of 569 bridges)
- Square meters of bridges in poor condition: 11.0% (16,246 of 147,752 square meters of bridges)
9 / 20
Canva
#12. Macon County
- Bridges in poor condition: 15.6% (54 of 347 bridges)
- Square meters of bridges in poor condition: 13.4% (21,260 of 158,692 square meters of bridges)
10 / 20
Henryk Sadura // Shutterstock
#11. Tazewell County
- Bridges in poor condition: 15.9% (57 of 358 bridges)
- Square meters of bridges in poor condition: 27.5% (85,442 of 310,432 square meters of bridges)
- Bridges in poor condition: 18.6% (50 of 269 bridges)
- Square meters of bridges in poor condition: 17.3% (18,122 of 104,767 square meters of bridges)
17 / 20
Canva
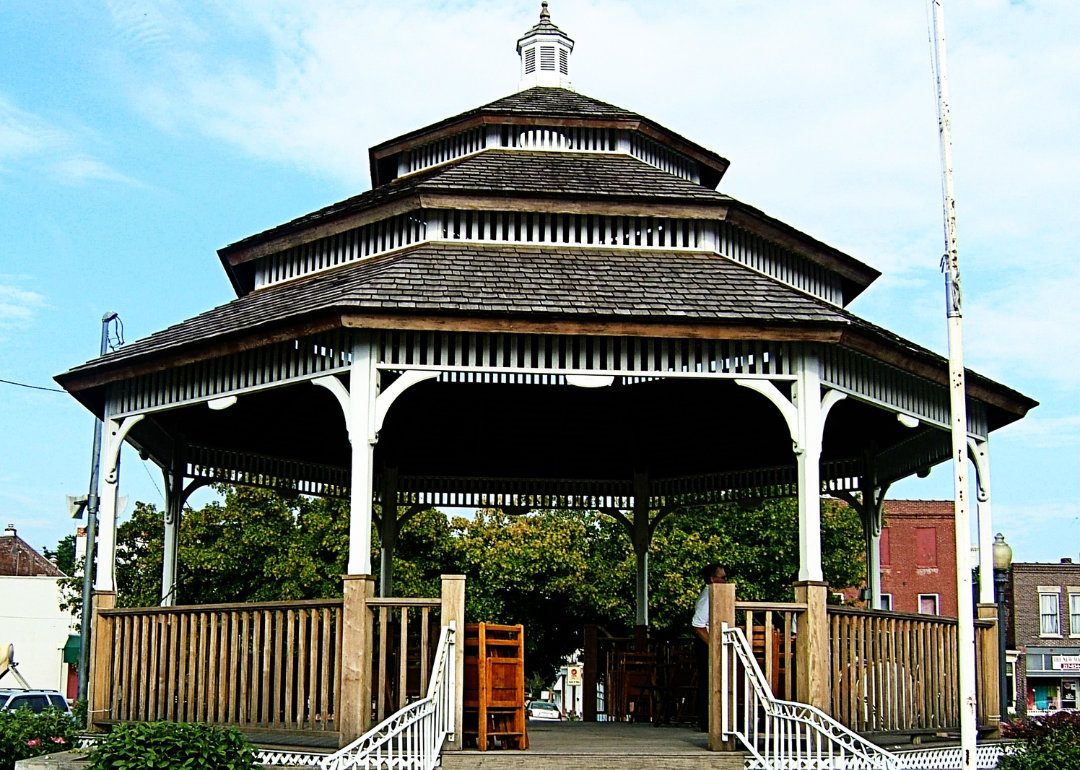
#4. Fulton County
- Bridges in poor condition: 20.0% (42 of 210 bridges)
- Square meters of bridges in poor condition: 30.0% (20,506 of 68,307 square meters of bridges)
18 / 20
Canva
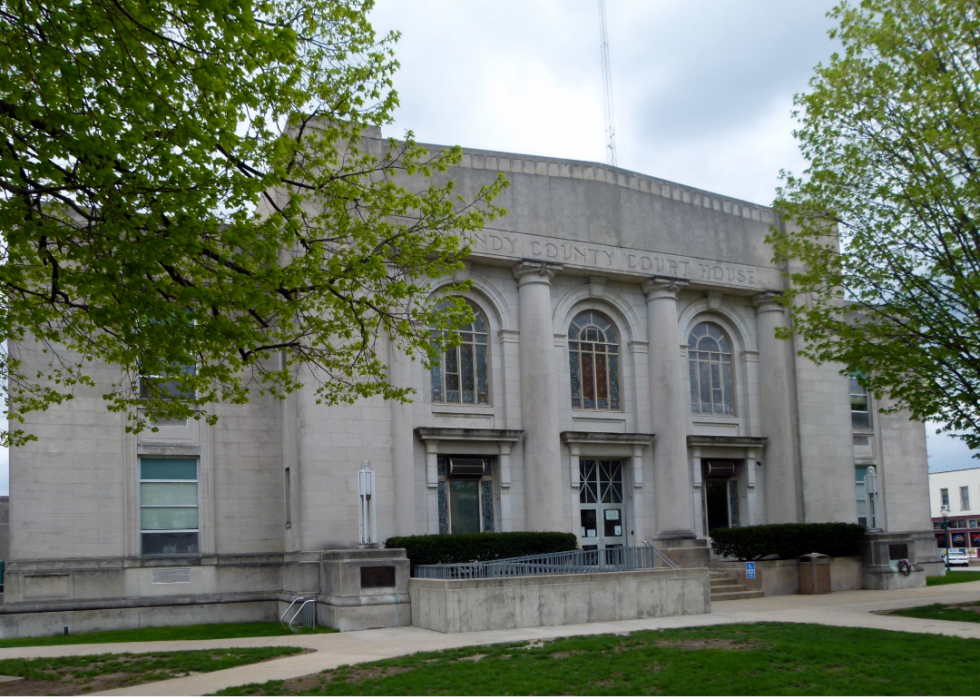
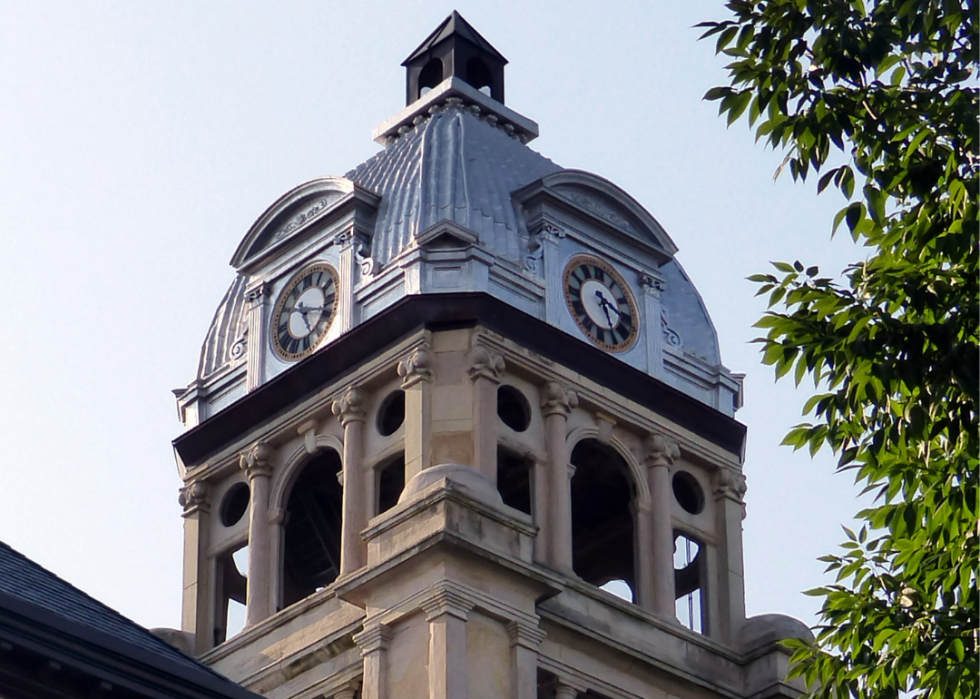
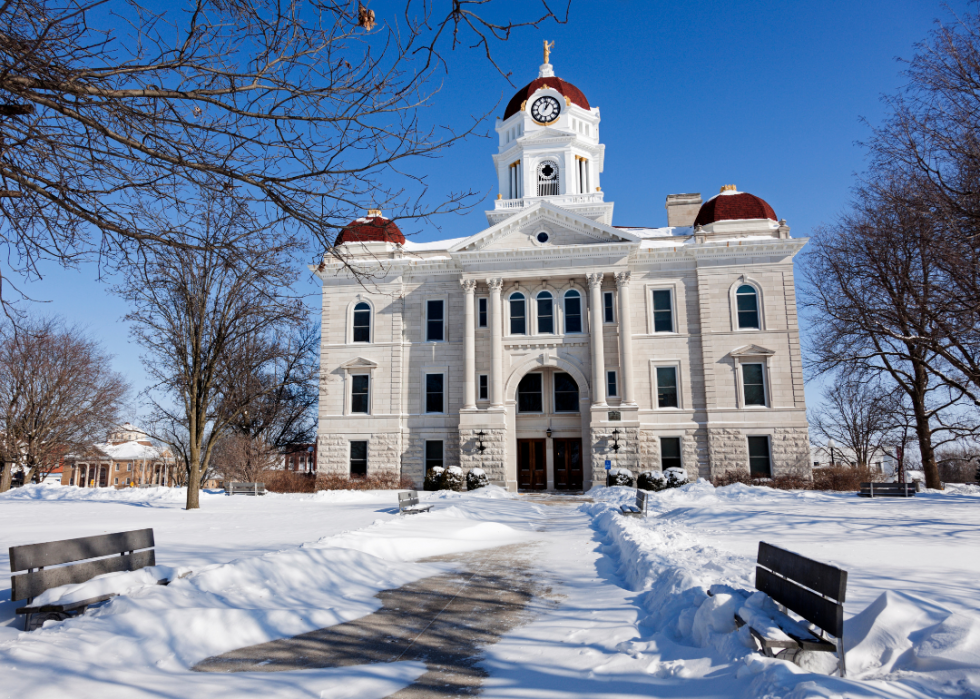
#3. Hancock County
- Bridges in poor condition: 20.2% (60 of 297 bridges)
- Square meters of bridges in poor condition: 15.7% (15,111 of 96,513 square meters of bridges)
19 / 20
Canva
#2. Cass County
- Bridges in poor condition: 22.1% (17 of 77 bridges)
- Square meters of bridges in poor condition: 38.0% (13,168 of 34,651 square meters of bridges)
20 / 20
Canva
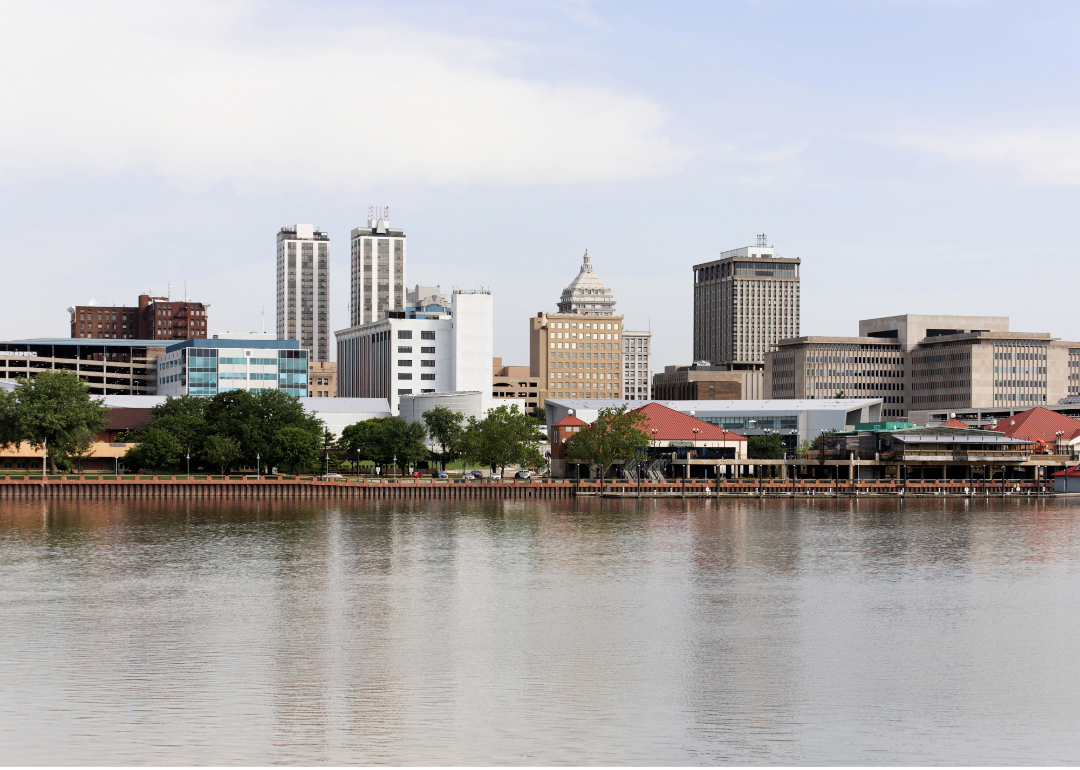
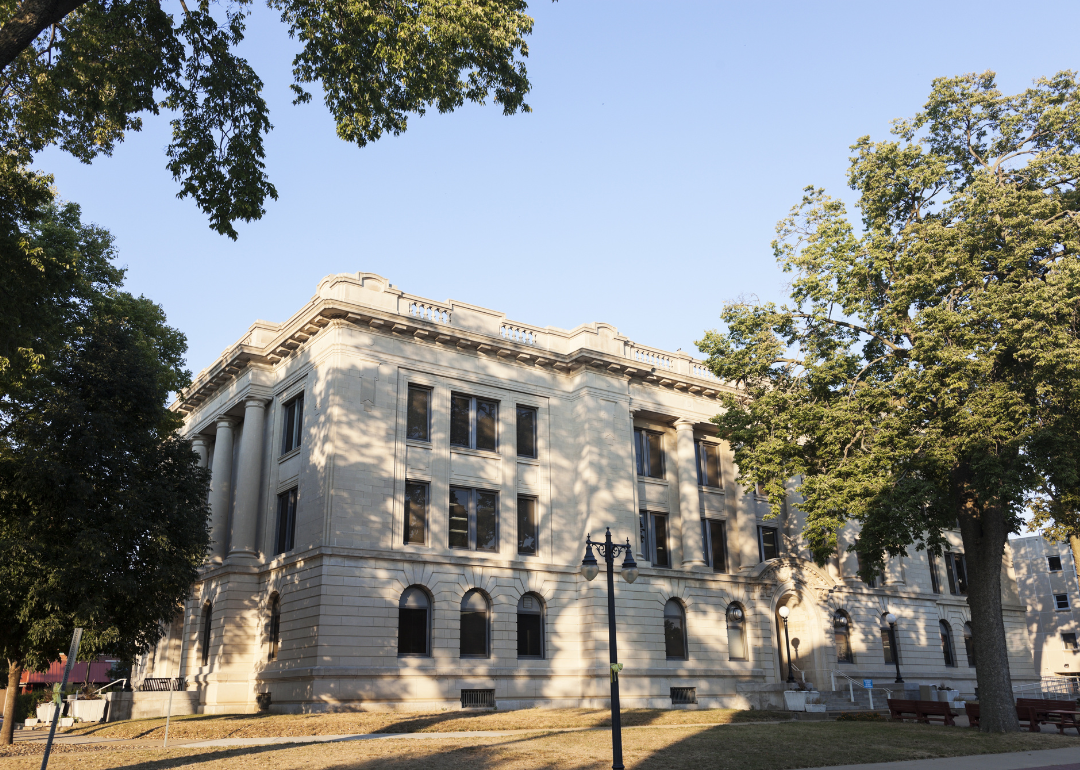
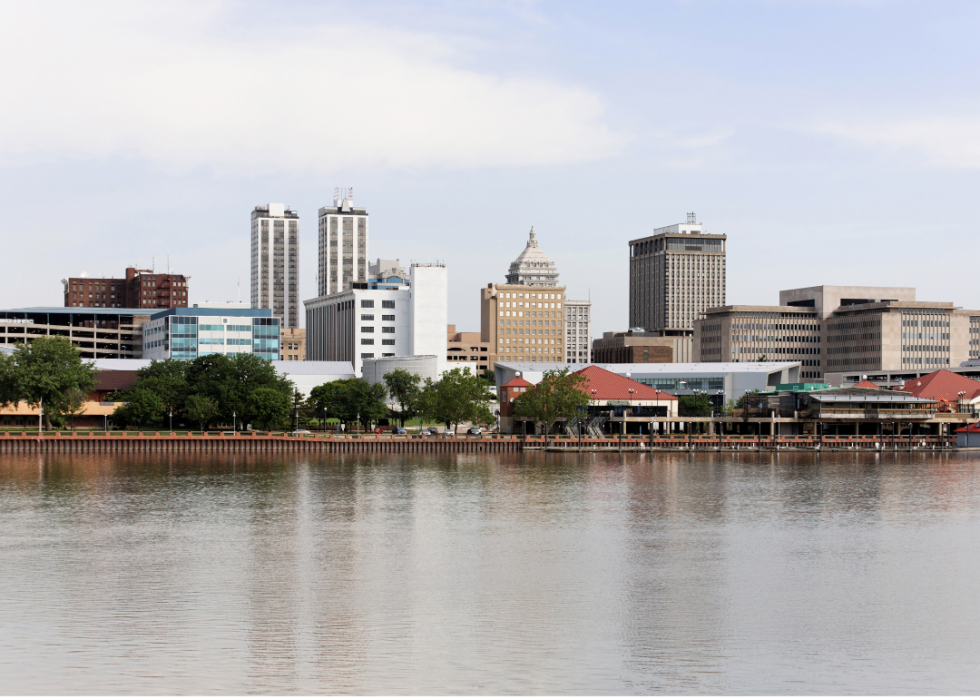
#1. Peoria County
- Bridges in poor condition: 22.4% (79 of 353 bridges)
- Square meters of bridges in poor condition: 31.6% (60,810 of 192,476 square meters of bridges)