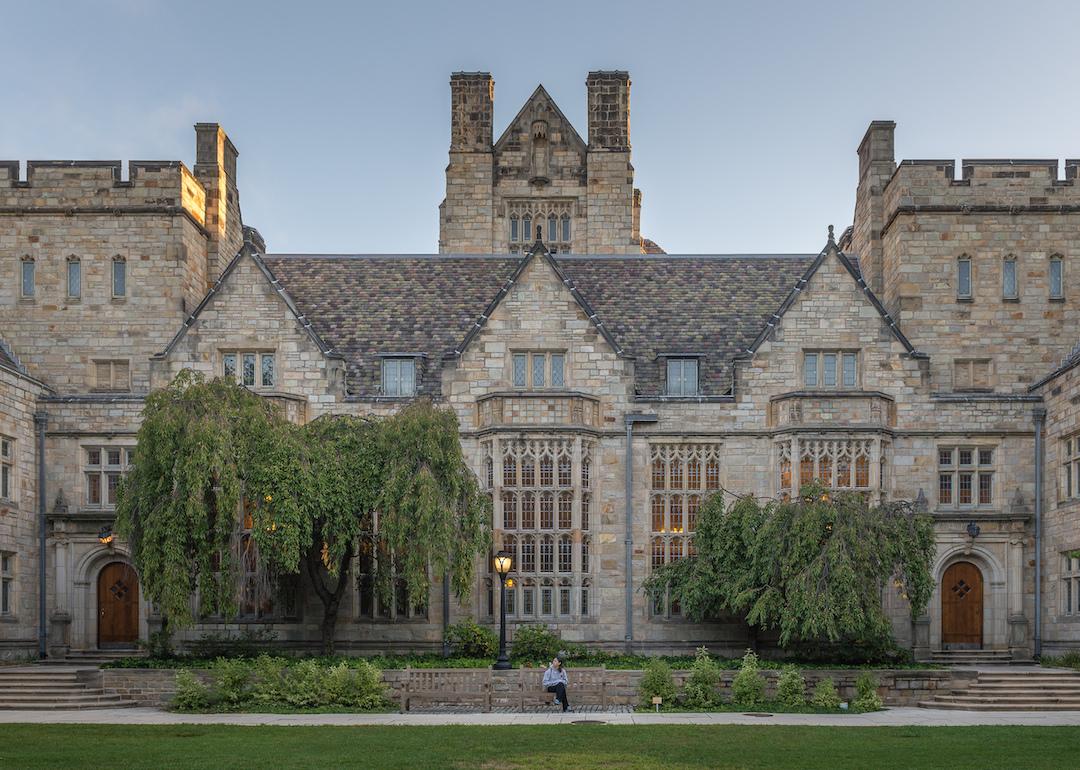
Counties with the oldest homes in Maryland
Counties with the oldest homes in Maryland
There's an undeniable charm that comes with pre-World War II American architecture, characterized by high ceilings, crown molding, hardwood floors, and ornate details. In fact, 12.8% of all housing units in America were built in 1939 or before, showing the popularity of the preservation of these units. Owning a piece of history can sometimes come with a cost: Many old homes come with asbestos, lead piping, knob-and-tube wiring, and other outdated building styles that can rack up a hefty price tag to modernize. However, with more and more modernized pre-war homes on the market, generally located just outside bustling downtown metros, investing in property that has withstood the test of time is an attractive prospect.
Stacker compiled a list of the counties in Maryland with the oldest homes using data from the U.S. Census Bureau. Counties are ranked by median year the structure was built according to 2020 5-year estimates. Ties broken by the highest percentage of homes built before 1939.
The country's domestic architecture is perhaps best characterized by a rugged individualism as opposed to the hybridization of disparate architectural elements. As Maya Angelou once perceptively observed, "the ache for home lives in all of us," a phrase that has meant very different things to different people.
Modest or palatial, there is no shortage of noteworthy homes in the U.S. Log cabins constructed by industrious pioneers have dotted the landscape alongside traditional Native American dwellings ever since immigrant Swedes introduced them to the New World in 1638. The unprecedented personal fortunes amassed by the so-called "Robber Barons" at the close of the 19th century gave way to the construction of a staggering number of Gilded Age estates.
The ravages of time spared neither the sumptuous nor the humble. Stately mansions, often prohibitively costly to maintain in the modern era, were frequently neglected; simple structures were forgotten, discarded by their owners, and damaged by natural elements. However, the tireless efforts of architectural preservationists and local historical societies have saved many of these homes from demolition, leading to their inclusion in the National Register of Historic Places and thereby safeguarding them for future generations.
Keep reading to learn more about which counties in Maryland have the oldest homes.
#24. Charles County
- Homes built 1939 or earlier: 2.9% (1,776 homes)
- Homes built since 2000: 30.9% (18,896 homes)
- Total homes built: 61,226
#23. St. Mary's County
- Homes built 1939 or earlier: 4.0% (1,813 homes)
- Homes built since 2000: 31.4% (14,404 homes)
- Total homes built: 45,867
#22. Calvert County
- Homes built 1939 or earlier: 4.0% (1,421 homes)
- Homes built since 2000: 23.9% (8,453 homes)
- Total homes built: 35,421
#21. Howard County
- Homes built 1939 or earlier: 2.1% (2,597 homes)
- Homes built since 2000: 24.3% (29,348 homes)
- Total homes built: 120,834
#20. Queen Anne's County
- Homes built 1939 or earlier: 8.1% (1,737 homes)
- Homes built since 2000: 27.2% (5,803 homes)
- Total homes built: 21,363
#19. Frederick County
- Homes built 1939 or earlier: 11.5% (11,409 homes)
- Homes built since 2000: 25.4% (25,169 homes)
- Total homes built: 99,179
#18. Cecil County
- Homes built 1939 or earlier: 10.0% (4,277 homes)
- Homes built since 2000: 25.2% (10,737 homes)
- Total homes built: 42,690
#17. Harford County
- Homes built 1939 or earlier: 5.6% (5,657 homes)
- Homes built since 2000: 21.3% (21,551 homes)
- Total homes built: 100,952
#16. Worcester County
- Homes built 1939 or earlier: 4.9% (2,796 homes)
- Homes built since 2000: 19.4% (10,942 homes)
- Total homes built: 56,485
#15. Anne Arundel County
- Homes built 1939 or earlier: 4.7% (10,737 homes)
- Homes built since 2000: 19.9% (45,127 homes)
- Total homes built: 226,330
#14. Wicomico County
- Homes built 1939 or earlier: 10.2% (4,327 homes)
- Homes built since 2000: 23.4% (9,945 homes)
- Total homes built: 42,452
#13. Carroll County
- Homes built 1939 or earlier: 11.8% (7,552 homes)
- Homes built since 2000: 17.6% (11,207 homes)
- Total homes built: 63,767
#12. Garrett County
- Homes built 1939 or earlier: 13.4% (2,594 homes)
- Homes built since 2000: 20.9% (4,051 homes)
- Total homes built: 19,428
#11. Talbot County
- Homes built 1939 or earlier: 17.6% (3,571 homes)
- Homes built since 2000: 18.4% (3,727 homes)
- Total homes built: 20,252
#10. Caroline County
- Homes built 1939 or earlier: 18.2% (2,482 homes)
- Homes built since 2000: 18.4% (2,514 homes)
- Total homes built: 13,645
#9. Montgomery County
- Homes built 1939 or earlier: 4.6% (18,024 homes)
- Homes built since 2000: 16.7% (65,208 homes)
- Total homes built: 390,475
#8. Somerset County
- Homes built 1939 or earlier: 19.4% (2,226 homes)
- Homes built since 2000: 21.1% (2,424 homes)
- Total homes built: 11,476
#7. Prince George's County
- Homes built 1939 or earlier: 4.5% (15,084 homes)
- Homes built since 2000: 15.6% (52,009 homes)
- Total homes built: 334,407
#6. Kent County
- Homes built 1939 or earlier: 21.4% (2,291 homes)
- Homes built since 2000: 17.5% (1,865 homes)
- Total homes built: 10,687
#5. Washington County
- Homes built 1939 or earlier: 20.2% (12,442 homes)
- Homes built since 2000: 17.3% (10,661 homes)
- Total homes built: 61,621
#4. Dorchester County
- Homes built 1939 or earlier: 21.3% (3,568 homes)
- Homes built since 2000: 21.1% (3,540 homes)
- Total homes built: 16,754
#3. Baltimore County
- Homes built 1939 or earlier: 7.9% (26,645 homes)
- Homes built since 2000: 11.7% (39,341 homes)
- Total homes built: 337,580
#2. Allegany County
- Homes built 1939 or earlier: 33.5% (10,996 homes)
- Homes built since 2000: 6.3% (2,061 homes)
- Total homes built: 32,823
#1. Baltimore
- Homes built 1939 or earlier: 44.3% (130,102 homes)
- Homes built since 2000: 6.4% (18,948 homes)
- Total homes built: 293,936


