Counties with the most emergency shelters in Minnesota

Written by:
January 20, 2023
McGhiever // Wikimedia Commons

Counties with the most emergency shelters in Minnesota

As climate change drives weather to greater extremes, and devastating hurricanes, wildfires, droughts, and blizzards preoccupy an increasing number of Americans, it is hard to avoid comparing the reality of everyday news coverage to the computer-generated images seen in disaster movies.

Over the last 50 years, natural disasters have become five times more common due to climate change, according to the World Meteorological Organization. They've also become more economically debilitating—the five most expensive climate disasters in American history have all taken place over the last two decades.

The increasing frequency and severity of natural disasters means that the need for emergency evacuation and shelter plans has never been greater. According to the Federal Emergency Management Association, understanding your climate risk, or proximity to probable natural disaster, is an important first step for making a plan. Tools like the Climate Mapping for Resilience and Adaptation allow you to assess your risk by location.

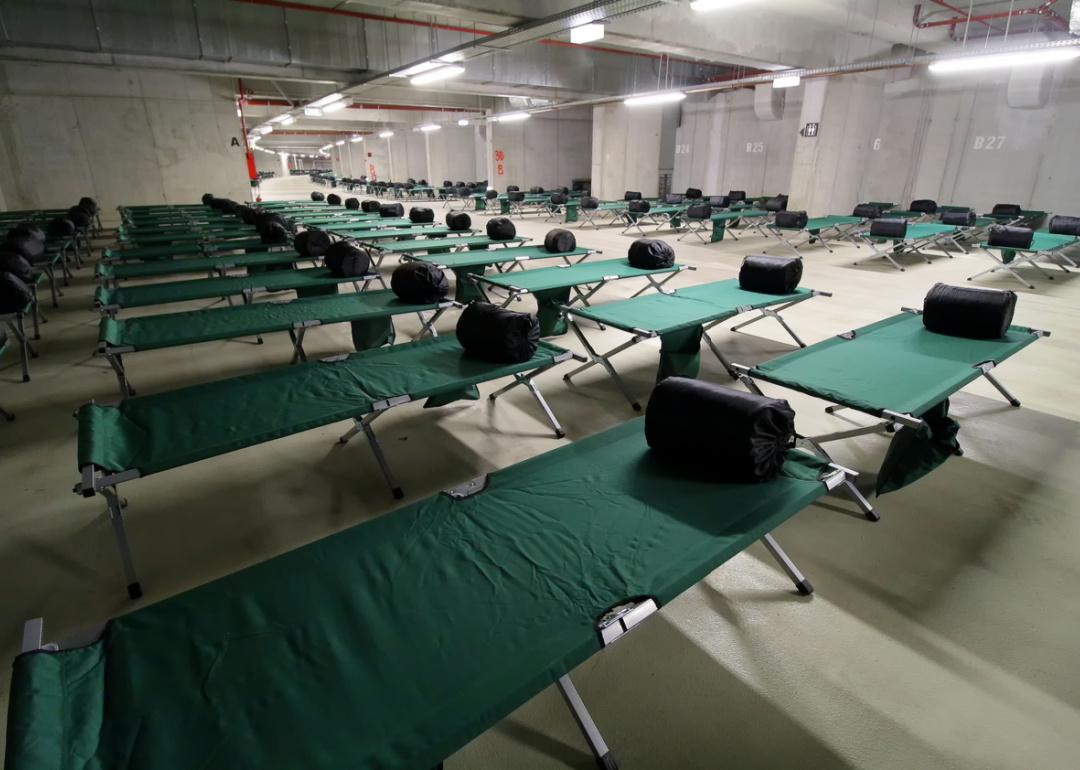
Knowing where nearby emergency shelters are located is another way to prepare for the worst. In the event of flooding, hurricane-level winds, or other disasters, emergency shelters offer a place to sleep, and also often provide food, water, and first aid services. Stacker examined the Department of Homeland Security's National Shelter System Facilities database to identify the counties with the most emergency shelters in Minnesota. Counties are ranked by emergency shelters per 100K people, with total capacity per 100K people serving as a tiebreaker.

1 / 50
Bobak Ha'Eri // Wikimedia Commons

#50. Blue Earth County

- Emergency shelters per 100K people: 39.4 (27 shelters in database)
- Emergency shelter capacity per 100K: 5,171,764 people (3,546,537 total capacity)
- Shelters with generators: 4
- Shelters in 100-year floodplain: 0
2 / 50
McGhiever // Wikimedia Commons

#49. Cass County

- Emergency shelters per 100K people: 40.1 (12 shelters in database)
- Emergency shelter capacity per 100K: 7,718,027 people (2,309,002 total capacity)
- Shelters with generators: 0
- Shelters in 100-year floodplain: 0
3 / 50
McGhiever // Wikimedia Commons

#48. Rice County

- Emergency shelters per 100K people: 41.9 (28 shelters in database)
- Emergency shelter capacity per 100K: 14,517,664 people (9,697,074 total capacity)
- Shelters with generators: 0
- Shelters in 100-year floodplain: 0
4 / 50
McGhiever // Wikimedia Commons

#47. Crow Wing County

- Emergency shelters per 100K people: 42.5 (28 shelters in database)
- Emergency shelter capacity per 100K: 10,360,846 people (6,825,622 total capacity)
- Shelters with generators: 1
- Shelters in 100-year floodplain: 0
5 / 50
Bobak Ha'Eri // Wikimedia Commons

#46. McLeod County

- Emergency shelters per 100K people: 43.6 (16 shelters in database)
- Emergency shelter capacity per 100K: 10,644,517 people (3,902,493 total capacity)
- Shelters with generators: 0
- Shelters in 100-year floodplain: 0
6 / 50
Elkman // Wikimedia Commons

#45. Sibley County

- Emergency shelters per 100K people: 46.8 (7 shelters in database)
- Emergency shelter capacity per 100K: 11,857,439 people (1,772,450 total capacity)
- Shelters with generators: 1
- Shelters in 100-year floodplain: 0
7 / 50
Darb02 // Wikimedia Commons

#44. Mower County

- Emergency shelters per 100K people: 47.5 (19 shelters in database)
- Emergency shelter capacity per 100K: 6,597,447 people (2,637,989 total capacity)
- Shelters with generators: 2
- Shelters in 100-year floodplain: 0
8 / 50
McGhiever // Wikimedia Commons

#43. Chippewa County

- Emergency shelters per 100K people: 48.0 (6 shelters in database)
- Emergency shelter capacity per 100K: 9,135,255 people (1,142,729 total capacity)
- Shelters with generators: 0
- Shelters in 100-year floodplain: 0
9 / 50
SH5544 // Wikimedia Commons

#42. Otter Tail County

- Emergency shelters per 100K people: 48.6 (29 shelters in database)
- Emergency shelter capacity per 100K: 15,868,032 people (9,477,658 total capacity)
- Shelters with generators: 2
- Shelters in 100-year floodplain: 0
10 / 50
McGhiever // Wikimedia Commons

#41. Clay County

- Emergency shelters per 100K people: 50.8 (33 shelters in database)
- Emergency shelter capacity per 100K: 15,612,837 people (10,144,441 total capacity)
- Shelters with generators: 4
- Shelters in 100-year floodplain: 1
11 / 50
David Daniel // Wikimedia Commons

#40. Cottonwood County

- Emergency shelters per 100K people: 52.2 (6 shelters in database)
- Emergency shelter capacity per 100K: 18,182,672 people (2,088,098 total capacity)
- Shelters with generators: 0
- Shelters in 100-year floodplain: 0
12 / 50
McGhiever // Wikimedia Commons

#39. Beltrami County

- Emergency shelters per 100K people: 56.5 (26 shelters in database)
- Emergency shelter capacity per 100K: 9,480,040 people (4,363,947 total capacity)
- Shelters with generators: 3
- Shelters in 100-year floodplain: 0
13 / 50
McGhiever // Wikimedia Commons

#38. Douglas County

- Emergency shelters per 100K people: 56.8 (22 shelters in database)
- Emergency shelter capacity per 100K: 9,010,353 people (3,490,791 total capacity)
- Shelters with generators: 0
- Shelters in 100-year floodplain: 0
14 / 50
Jonathunder // Wikimedia Commons

#37. Houston County

- Emergency shelters per 100K people: 58.5 (11 shelters in database)
- Emergency shelter capacity per 100K: 16,141,779 people (3,035,623 total capacity)
- Shelters with generators: 1
- Shelters in 100-year floodplain: 1
15 / 50
ACNWelc // Wikimedia Commons

#36. Pine County

- Emergency shelters per 100K people: 58.6 (17 shelters in database)
- Emergency shelter capacity per 100K: 12,330,369 people (3,575,437 total capacity)
- Shelters with generators: 1
- Shelters in 100-year floodplain: 0
16 / 50
McGhiever // Wikimedia Commons

#35. Mille Lacs County

- Emergency shelters per 100K people: 60.6 (16 shelters in database)
- Emergency shelter capacity per 100K: 11,536,580 people (3,045,311 total capacity)
- Shelters with generators: 0
- Shelters in 100-year floodplain: 0
17 / 50
Jonathunder // Wikimedia Commons

#34. Freeborn County

- Emergency shelters per 100K people: 61.5 (19 shelters in database)
- Emergency shelter capacity per 100K: 10,638,401 people (3,285,351 total capacity)
- Shelters with generators: 0
- Shelters in 100-year floodplain: 0
18 / 50
Mathieu Nicklay // Wikimedia Commons

#33. Norman County

- Emergency shelters per 100K people: 61.5 (4 shelters in database)
- Emergency shelter capacity per 100K: 21,562,785 people (1,401,581 total capacity)
- Shelters with generators: 1
- Shelters in 100-year floodplain: 1
19 / 50
Jatakuck // Wikimedia Commons

#32. Watonwan County

- Emergency shelters per 100K people: 62.4 (7 shelters in database)
- Emergency shelter capacity per 100K: 13,477,172 people (1,512,543 total capacity)
- Shelters with generators: 0
- Shelters in 100-year floodplain: 0
20 / 50
Jonathunder // Wikimedia Commons

#31. Pipestone County

- Emergency shelters per 100K people: 64.0 (6 shelters in database)
- Emergency shelter capacity per 100K: 22,411,451 people (2,099,953 total capacity)
- Shelters with generators: 0
- Shelters in 100-year floodplain: 0
21 / 50
McGhiever // Wikimedia Commons

#30. Nicollet County

- Emergency shelters per 100K people: 64.1 (22 shelters in database)
- Emergency shelter capacity per 100K: 9,327,444 people (3,198,847 total capacity)
- Shelters with generators: 0
- Shelters in 100-year floodplain: 0
22 / 50
Jonathunder // Wikimedia Commons

#29. Dodge County

- Emergency shelters per 100K people: 67.3 (14 shelters in database)
- Emergency shelter capacity per 100K: 23,114,525 people (4,807,359 total capacity)
- Shelters with generators: 1
- Shelters in 100-year floodplain: 0
23 / 50
McGhiever // Wikimedia Commons

#28. Kandiyohi County

- Emergency shelters per 100K people: 69.0 (30 shelters in database)
- Emergency shelter capacity per 100K: 12,667,557 people (5,510,894 total capacity)
- Shelters with generators: 0
- Shelters in 100-year floodplain: 0
24 / 50
Myotus // Wikimedia Commons

#27. Roseau County

- Emergency shelters per 100K people: 71.8 (11 shelters in database)
- Emergency shelter capacity per 100K: 21,738,999 people (3,330,632 total capacity)
- Shelters with generators: 0
- Shelters in 100-year floodplain: 0
25 / 50
Jet Lowe // Wikimedia Commons

#26. Lac qui Parle County

- Emergency shelters per 100K people: 74.0 (5 shelters in database)
- Emergency shelter capacity per 100K: 15,328,772 people (1,035,152 total capacity)
- Shelters with generators: 0
- Shelters in 100-year floodplain: 0
26 / 50
Tony Webster // Wikimedia Commons

#25. Renville County

- Emergency shelters per 100K people: 74.5 (11 shelters in database)
- Emergency shelter capacity per 100K: 8,485,211 people (1,253,096 total capacity)
- Shelters with generators: 0
- Shelters in 100-year floodplain: 0
27 / 50
Tony Webster // Wikimedia Commons

#24. Lyon County

- Emergency shelters per 100K people: 74.6 (19 shelters in database)
- Emergency shelter capacity per 100K: 20,584,833 people (5,244,398 total capacity)
- Shelters with generators: 0
- Shelters in 100-year floodplain: 0
28 / 50
Bobak Ha'Eri // Wikimedia Commons

#23. Brown County

- Emergency shelters per 100K people: 77.2 (20 shelters in database)
- Emergency shelter capacity per 100K: 13,486,449 people (3,492,181 total capacity)
- Shelters with generators: 0
- Shelters in 100-year floodplain: 0
29 / 50
Tony Webster // Wikimedia Commons

#22. Carlton County

- Emergency shelters per 100K people: 77.5 (28 shelters in database)
- Emergency shelter capacity per 100K: 13,871,008 people (5,013,676 total capacity)
- Shelters with generators: 1
- Shelters in 100-year floodplain: 0
30 / 50
McGhiever // Wikimedia Commons

#21. Big Stone County

- Emergency shelters per 100K people: 77.6 (4 shelters in database)
- Emergency shelter capacity per 100K: 13,272,900 people (684,218 total capacity)
- Shelters with generators: 0
- Shelters in 100-year floodplain: 0
31 / 50
Myotus // Wikimedia Commons

#20. Steele County

- Emergency shelters per 100K people: 83.0 (31 shelters in database)
- Emergency shelter capacity per 100K: 28,479,820 people (10,640,915 total capacity)
- Shelters with generators: 0
- Shelters in 100-year floodplain: 0
32 / 50
AlexiusHoratius // Wikimedia Commons

#19. Wabasha County

- Emergency shelters per 100K people: 84.0 (18 shelters in database)
- Emergency shelter capacity per 100K: 27,829,680 people (5,962,509 total capacity)
- Shelters with generators: 0
- Shelters in 100-year floodplain: 0
33 / 50
Jonathunder // Wikimedia Commons

#18. Itasca County

- Emergency shelters per 100K people: 89.0 (40 shelters in database)
- Emergency shelter capacity per 100K: 18,266,988 people (8,214,482 total capacity)
- Shelters with generators: 2
- Shelters in 100-year floodplain: 1
34 / 50
McGhiever // Wikimedia Commons

#17. Hubbard County

- Emergency shelters per 100K people: 89.5 (19 shelters in database)
- Emergency shelter capacity per 100K: 22,517,018 people (4,777,886 total capacity)
- Shelters with generators: 1
- Shelters in 100-year floodplain: 0
35 / 50
Myotus // Wikimedia Commons

#16. Polk County

- Emergency shelters per 100K people: 92.6 (29 shelters in database)
- Emergency shelter capacity per 100K: 15,137,671 people (4,738,545 total capacity)
- Shelters with generators: 1
- Shelters in 100-year floodplain: 0
36 / 50
Myotus // Wikimedia Commons

#15. Clearwater County

- Emergency shelters per 100K people: 93.8 (8 shelters in database)
- Emergency shelter capacity per 100K: 27,183,155 people (2,317,364 total capacity)
- Shelters with generators: 0
- Shelters in 100-year floodplain: 0
37 / 50
Elkman // Wikimedia Commons

#14. Aitkin County

- Emergency shelters per 100K people: 101.6 (16 shelters in database)
- Emergency shelter capacity per 100K: 16,196,139 people (2,550,406 total capacity)
- Shelters with generators: 2
- Shelters in 100-year floodplain: 0
38 / 50
McGhiever // Wikimedia Commons

#13. Fillmore County

- Emergency shelters per 100K people: 108.6 (23 shelters in database)
- Emergency shelter capacity per 100K: 37,358,445 people (7,912,145 total capacity)
- Shelters with generators: 0
- Shelters in 100-year floodplain: 0
39 / 50
Jonathunder // Wikimedia Commons

#12. Martin County

- Emergency shelters per 100K people: 109.6 (22 shelters in database)
- Emergency shelter capacity per 100K: 38,626,388 people (7,752,316 total capacity)
- Shelters with generators: 1
- Shelters in 100-year floodplain: 0
40 / 50
McGhiever // Wikimedia Commons

#11. Lake County

- Emergency shelters per 100K people: 110.8 (12 shelters in database)
- Emergency shelter capacity per 100K: 21,196,797 people (2,296,673 total capacity)
- Shelters with generators: 2
- Shelters in 100-year floodplain: 0
41 / 50
Bobak Ha'Eri // Wikimedia Commons

#10. Swift County

- Emergency shelters per 100K people: 112.1 (11 shelters in database)
- Emergency shelter capacity per 100K: 24,842,813 people (2,437,080 total capacity)
- Shelters with generators: 1
- Shelters in 100-year floodplain: 0
42 / 50
McGhiever // Wikimedia Commons

#9. Winona County

- Emergency shelters per 100K people: 114.3 (57 shelters in database)
- Emergency shelter capacity per 100K: 18,912,077 people (9,435,046 total capacity)
- Shelters with generators: 2
- Shelters in 100-year floodplain: 0
43 / 50
McGhiever // Wikimedia Commons

#8. Wilkin County

- Emergency shelters per 100K people: 123.2 (8 shelters in database)
- Emergency shelter capacity per 100K: 39,620,600 people (2,573,358 total capacity)
- Shelters with generators: 2
- Shelters in 100-year floodplain: 1
44 / 50
Jonathunder // Wikimedia Commons

#7. Lincoln County

- Emergency shelters per 100K people: 123.8 (7 shelters in database)
- Emergency shelter capacity per 100K: 34,858,320 people (1,971,238 total capacity)
- Shelters with generators: 0
- Shelters in 100-year floodplain: 0
45 / 50
Ed Lombard // Wikimedia Commons

#6. Koochiching County

- Emergency shelters per 100K people: 139.3 (17 shelters in database)
- Emergency shelter capacity per 100K: 19,518,946 people (2,381,897 total capacity)
- Shelters with generators: 0
- Shelters in 100-year floodplain: 0
46 / 50
P199 // Wikimedia Commons

#5. Lake of the Woods County

- Emergency shelters per 100K people: 159.7 (6 shelters in database)
- Emergency shelter capacity per 100K: 56,163,082 people (2,110,047 total capacity)
- Shelters with generators: 0
- Shelters in 100-year floodplain: 0
47 / 50
Jonathunder // Wikimedia Commons

#4. Waseca County

- Emergency shelters per 100K people: 179.2 (34 shelters in database)
- Emergency shelter capacity per 100K: 26,536,870 people (5,034,575 total capacity)
- Shelters with generators: 0
- Shelters in 100-year floodplain: 0
48 / 50
McGhiever // Wikimedia Commons

#3. Cook County

- Emergency shelters per 100K people: 179.4 (10 shelters in database)
- Emergency shelter capacity per 100K: 37,290,761 people (2,078,587 total capacity)
- Shelters with generators: 1
- Shelters in 100-year floodplain: 0
49 / 50
Myotus // Wikimedia Commons

#2. Kittson County

- Emergency shelters per 100K people: 237.4 (10 shelters in database)
- Emergency shelter capacity per 100K: 38,216,592 people (1,610,065 total capacity)
- Shelters with generators: 1
- Shelters in 100-year floodplain: 0
50 / 50
McGhiever // Wikimedia Commons

#1. Marshall County

- Emergency shelters per 100K people: 429.4 (39 shelters in database)
- Emergency shelter capacity per 100K: 71,673,706 people (6,509,406 total capacity)
- Shelters with generators: 0
- Shelters in 100-year floodplain: 0

Trending Now