Counties in Missouri where landslides pose the greatest threat

·Stacker

IrinaK // Shutterstock

Hurricane Helene wrought devastation across the Southeast. The storm's high winds and flooding killed more than 230 people, and the damage to property, infrastructure, and other economic impacts is estimated to be worth tens of billions of dollars.

But heavy rains and destructive winds weren't the only natural disasters out in force: The hurricane also activated nearly 2,000 landslides, of which over half have impacted roads, rivers, and structures, according to early estimates.

Even on their own, landslides are a deadly and costly natural disaster. There were 310 fatal landslides globally in the first half of 2024 alone, which killed 2,315 people—unusually high numbers compared to previous years. In the U.S., 25 to 50 people on average are killed by landslides each year, according to the Department of Interior.

Landslides from Hurricane Helene alone killed 20 people in North Carolina, which endured the worst of the storm's landslides. A combination of fast-moving mud and water destroyed roads, rail links, water access, homes, and businesses across the state.

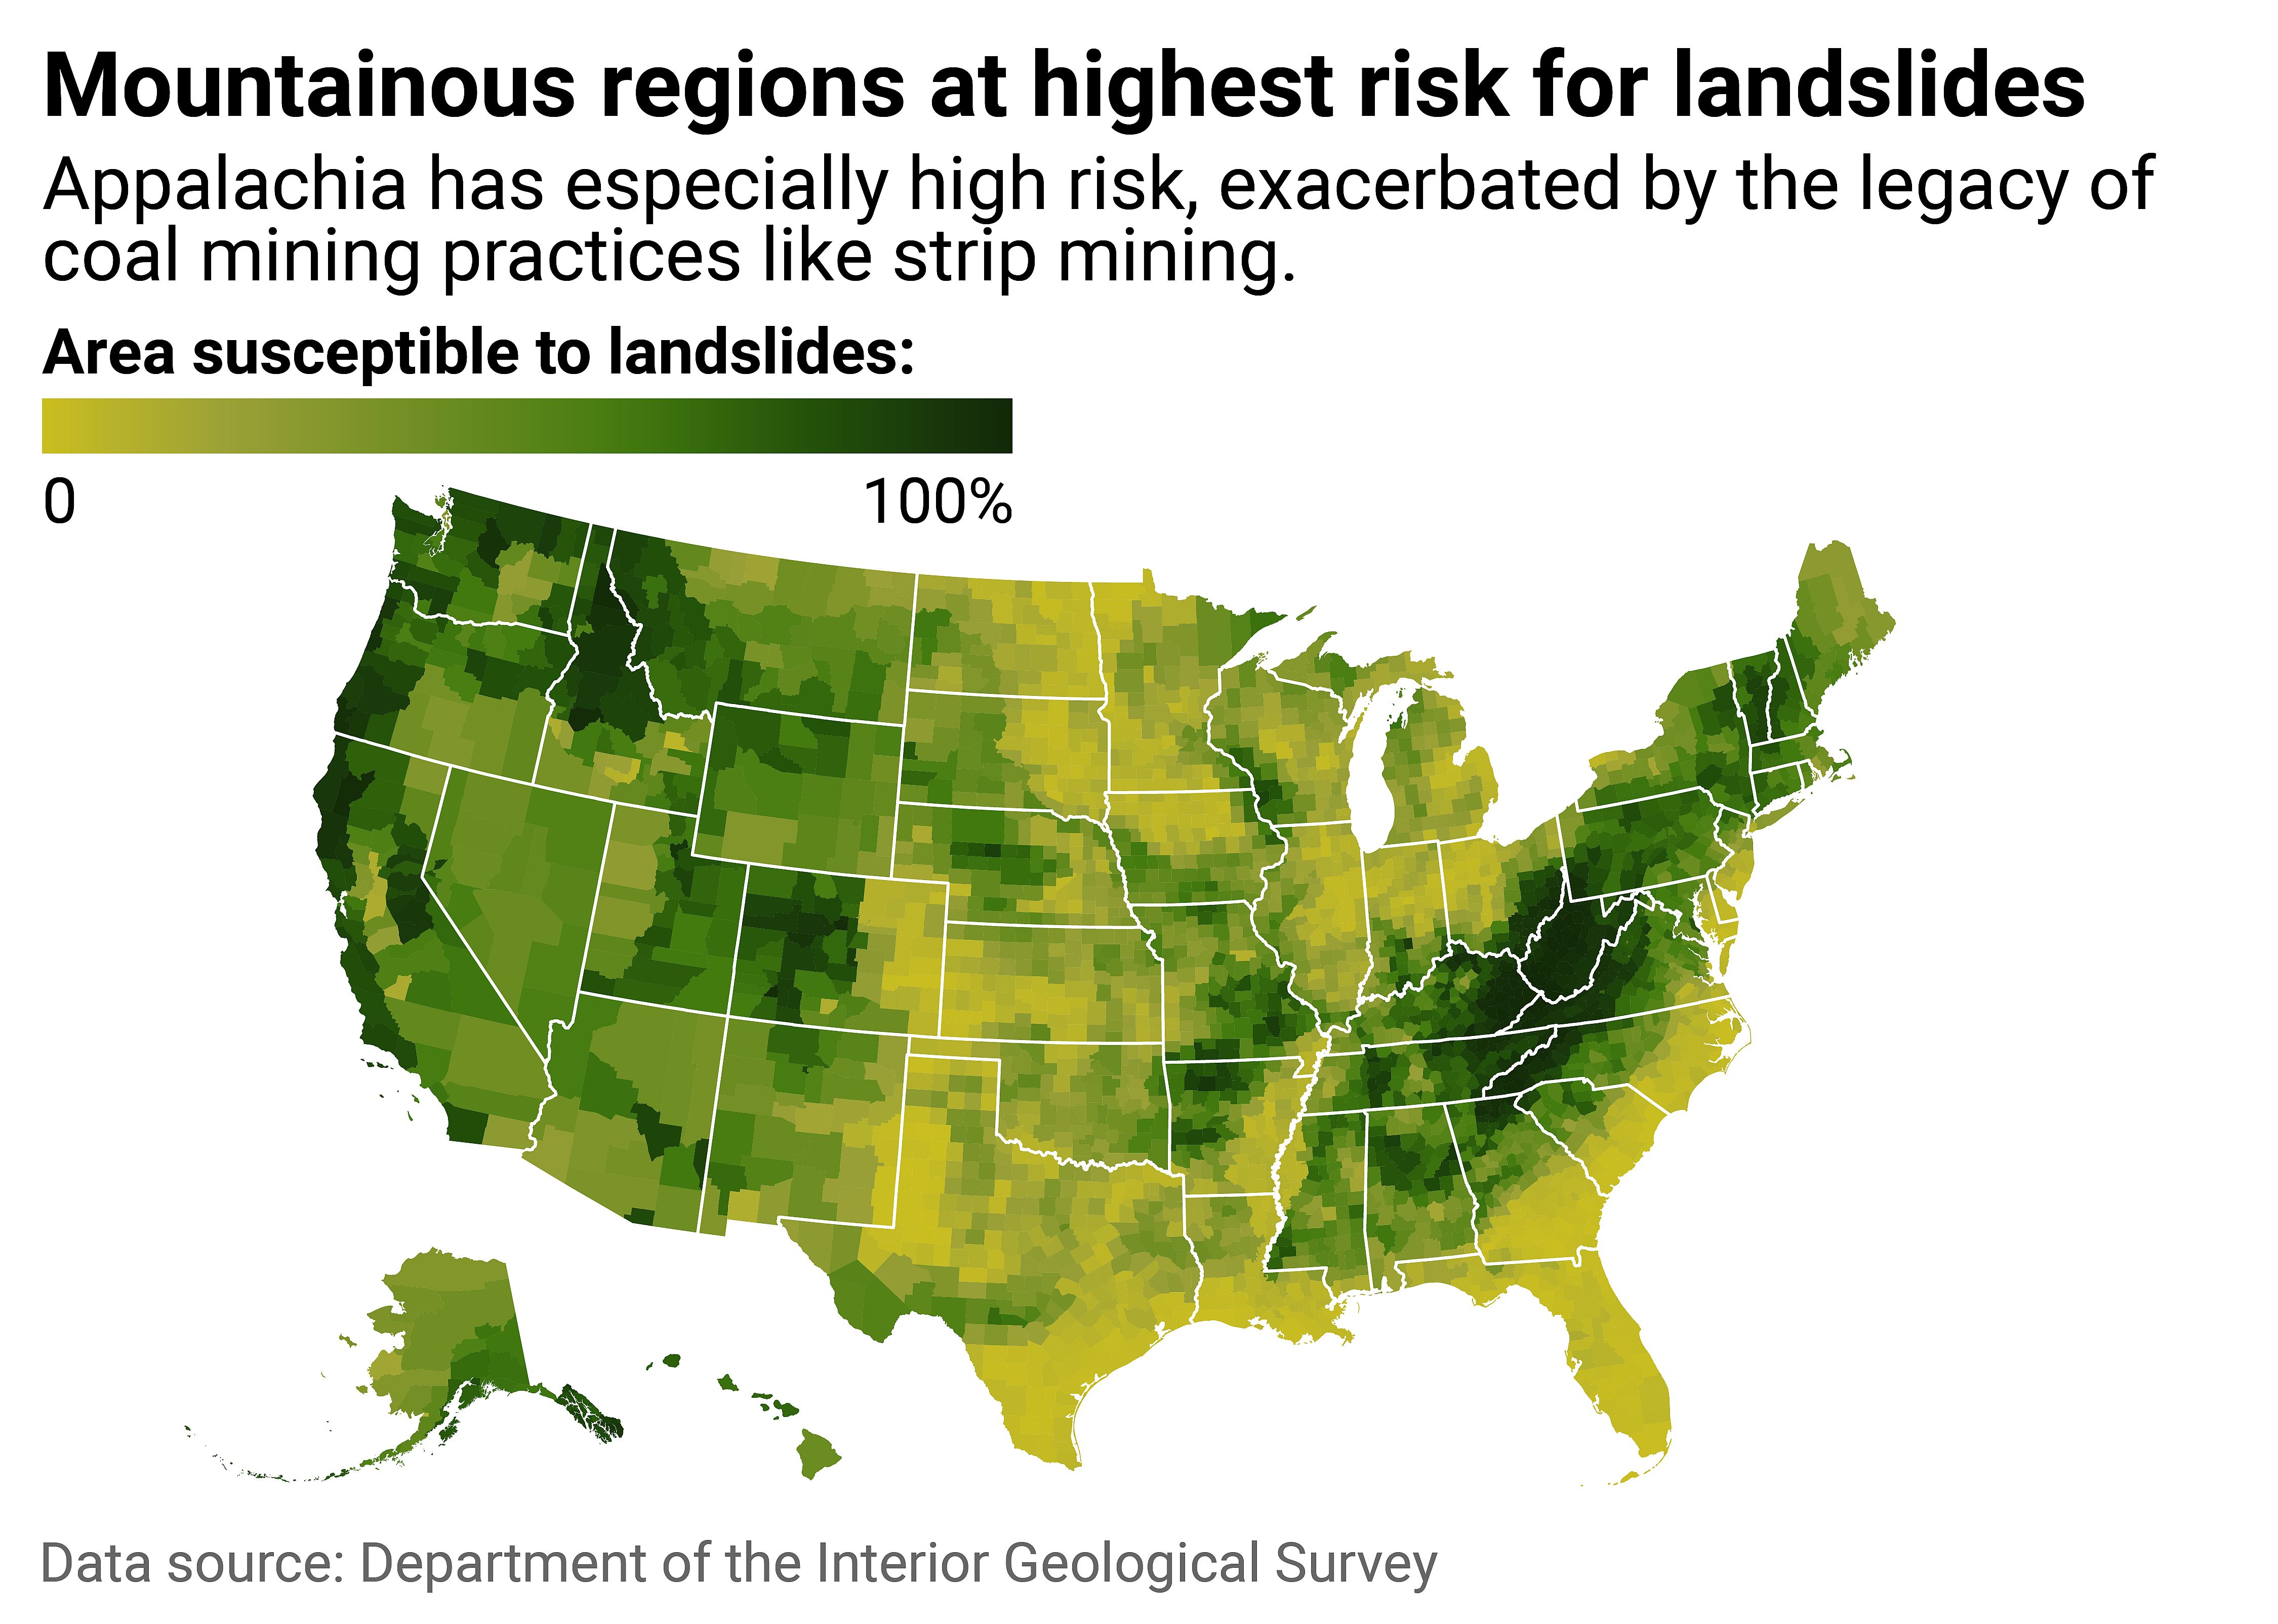
As climate change strengthens hurricanes and increases the frequency and severity of extreme weather events, the risk of landslides is also rising. To get a clearer picture of where the risk is greatest, Truck Parking Club mapped county-level data from the Department of the Interior Geological Survey, then ranked Missouri counties by the share of their land that is susceptible to landslides as part of a larger national analysis. Data was published in September 2024. Counties are displayed by the share of their land area that is susceptible to landslides.

Counties within mountain ranges have high landslide susceptibility

Truck Parking Club

1 / 51

Counties within mountain ranges have high landslide susceptibility

In Missouri, over half of the land is susceptible to landslides in 53 counties.

A landslide occurs when rock, debris, or earth moves down a slope. Inclines like hills and bluffs are a critical element of slides, meaning mountainous regions are at higher risk. Typically, landslides are triggered by forces like heavy rainfall, snowmelt, earthquakes, volcanic activity, human activities, or some combination of factors. Often, they're impossible to predict.

According to the Geological Survey, places where weak or fractured earth sit on steep slopes are likely to experience landslides—for example, areas with a history of strip mining. In Appalachia, about 1,400 square miles of land are scarred by strip mining within the Ohio River basin, according to an Inside Climate News analysis of satellite imagery. Together, the "waste rock" left behind, increasing stream flows, and heavy rainfalls brought on by climate change create a deadly recipe for landslides. This part of Appalachia is also near the Gulf of Mexico, where fast-warming waters stir up exceptionally fast-growing storms, as was the case with Hurricane Helene.

Combined, these elements create the highest vulnerability to landslides in the region. Much of West Virginia, in particular, is at risk: In 47 of the state's 55 counties, more than 90% of the land is susceptible to slides. Parts of Virginia, Kentucky, Ohio, Tennessee, and North Carolina are also exceedingly vulnerable.

Parts of California's coastline have also been plagued by major landslides. Earlier this year, a rockslide destroyed a part of Highway 1 along the state's famed Big Sur. The earth below the highway isn't sturdy, and wetter storms are further weakening it, contributing to more frequent and severe landslides. The majestic Big Sur stretch is an iconic road trip and tourism destination, where the highway winds along cliffs above the Pacific Ocean. However, it was forced to close to most traffic, and still offers just one lane at some points.

Other landslide risk factors include population growth, rapid land use changes, urbanization, heavy logging and deforestation, and inappropriate use of lands—slopes in particular. Wildfires also generate landslide hazards, leaving behind excess debris that can be dragged down during floods, as was the case in Big Sur.

The heightened frequency and severity of landslides are a direct consequence of logging, mining, and climate change, with massive repercussions for safety and critical infrastructure in the U.S. and around the world.

Hazard maps like those from the Geological Survey are a tool that federal, state, and local governments can use to identify landslide vulnerabilities and prepare for them. Preparation and mitigation efforts might include landslide drills, evacuation plans, improved drainage systems, and slope stabilization. Governments in susceptible areas can adopt disaster-resilient building codes and standards, as well as restrictions on mining and logging.

In some cases, such as Highway 1, there are no obvious solutions to fully protect against landslides. Still, with increased awareness and response plans, people can make more informed decisions on where to live (or safely visit) and can prepare themselves for landslides and their aftermath.

Read on to see where in Missouri is most vulnerable to the growing landslide threat.

#50. Boone County

Canva

2 / 51

#50. Boone County

- Percent susceptible area: 51.3%
- Total susceptible area: 352 square miles

#49. Benton County

TommyBrison // Shutterstock

3 / 51

#49. Benton County

- Percent susceptible area: 52.5%
- Total susceptible area: 376 square miles

#48. Laclede County

M. Curtis // Shutterstock

4 / 51

#48. Laclede County

- Percent susceptible area: 52.8%
- Total susceptible area: 405 square miles

#47. Macon County

Canva

5 / 51

#47. Macon County

- Percent susceptible area: 53.1%
- Total susceptible area: 428 square miles

#46. Harrison County

Canva

6 / 51

#46. Harrison County

- Percent susceptible area: 54.2%
- Total susceptible area: 394 square miles

#45. Buchanan County

APN Photography // Shutterstock

7 / 51

#45. Buchanan County

- Percent susceptible area: 56.7%
- Total susceptible area: 233 square miles

#44. Platte County

TommyBrison // Shutterstock

8 / 51

#44. Platte County

- Percent susceptible area: 56.8%
- Total susceptible area: 239 square miles

#43. Morgan County

Canva

9 / 51

#43. Morgan County

- Percent susceptible area: 57.1%
- Total susceptible area: 345 square miles

#42. Worth County

Canva

10 / 51

#42. Worth County

- Percent susceptible area: 58.1%
- Total susceptible area: 155 square miles

#41. Maries County

Loria Chaddon // Shutterstock

11 / 51

#41. Maries County

- Percent susceptible area: 58.9%
- Total susceptible area: 312 square miles

#40. Cape Girardeau County

Jacob Boomsma // Shutterstock

12 / 51

#40. Cape Girardeau County

- Percent susceptible area: 59.0%
- Total susceptible area: 340 square miles

#39. Wright County

Canva

13 / 51

#39. Wright County

- Percent susceptible area: 59.8%
- Total susceptible area: 409 square miles

#38. Texas County

Canva

14 / 51

#38. Texas County

- Percent susceptible area: 60.6%
- Total susceptible area: 714 square miles

#37. Barry County

Canva

15 / 51

#37. Barry County

- Percent susceptible area: 61.9%
- Total susceptible area: 483 square miles

#36. Oregon County

marekuliasz // Shutterstock

16 / 51

#36. Oregon County

- Percent susceptible area: 62.0%
- Total susceptible area: 491 square miles

#35. Dent County

Canva

17 / 51

#35. Dent County

- Percent susceptible area: 63.0%
- Total susceptible area: 475 square miles

#34. Perry County

Canva

18 / 51

#34. Perry County

- Percent susceptible area: 63.5%
- Total susceptible area: 301 square miles

#33. Adair County

e.backlund // Shutterstock

19 / 51

#33. Adair County

- Percent susceptible area: 63.7%
- Total susceptible area: 362 square miles

#32. Phelps County

Canva

20 / 51

#32. Phelps County

- Percent susceptible area: 64.1%
- Total susceptible area: 432 square miles

#31. St. Louis County

RellMade // Shutterstock

21 / 51

#31. St. Louis County

- Percent susceptible area: 64.8%
- Total susceptible area: 333 square miles

#30. Gasconade County

Chrysa Rene Snow // Shutterstock

22 / 51

#30. Gasconade County

- Percent susceptible area: 65.2%
- Total susceptible area: 341 square miles

#29. Bollinger County

Canva

23 / 51

#29. Bollinger County

- Percent susceptible area: 65.5%
- Total susceptible area: 405 square miles

#28. Warren County

Canva

24 / 51

#28. Warren County

- Percent susceptible area: 65.7%
- Total susceptible area: 284 square miles

#27. Howard County

APN Photography // Shutterstock

25 / 51

#27. Howard County

- Percent susceptible area: 66.1%
- Total susceptible area: 308 square miles

#26. Christian County

Colton lee garcia // Shutterstock

26 / 51

#26. Christian County

- Percent susceptible area: 66.7%
- Total susceptible area: 376 square miles

#25. Mercer County

Canva

27 / 51

#25. Mercer County

- Percent susceptible area: 69.1%
- Total susceptible area: 314 square miles

#24. Franklin County

karen_zelle_photography // Shutterstock

28 / 51

#24. Franklin County

- Percent susceptible area: 69.4%
- Total susceptible area: 642 square miles

#23. Schuyler County

Canva

29 / 51

#23. Schuyler County

- Percent susceptible area: 69.6%
- Total susceptible area: 214 square miles

#22. Cole County

Canva

30 / 51

#22. Cole County

- Percent susceptible area: 69.6%
- Total susceptible area: 274 square miles

#21. Miller County

Canva

31 / 51

#21. Miller County

- Percent susceptible area: 70.0%
- Total susceptible area: 419 square miles

#20. Madison County

Canva

32 / 51

#20. Madison County

- Percent susceptible area: 70.8%
- Total susceptible area: 352 square miles

#19. Crawford County

LanaG // Shutterstock

33 / 51

#19. Crawford County

- Percent susceptible area: 70.9%
- Total susceptible area: 527 square miles

#18. Sullivan County

Canva

34 / 51

#18. Sullivan County

- Percent susceptible area: 72.4%
- Total susceptible area: 472 square miles

#17. Pulaski County

Canva

35 / 51

#17. Pulaski County

- Percent susceptible area: 73.4%
- Total susceptible area: 405 square miles

#16. Carter County

Danita Delimont // Shutterstock

36 / 51

#16. Carter County

- Percent susceptible area: 74.9%
- Total susceptible area: 381 square miles

#15. Ste. Genevieve County

Roberto Galan // Shutterstock

37 / 51

#15. Ste. Genevieve County

- Percent susceptible area: 75.1%
- Total susceptible area: 377 square miles

#14. Wayne County

Canva

38 / 51

#14. Wayne County

- Percent susceptible area: 75.9%
- Total susceptible area: 571 square miles

#13. Putnam County

Canva

39 / 51

#13. Putnam County

- Percent susceptible area: 76.7%
- Total susceptible area: 398 square miles

#12. Washington County

E.N. May // Shutterstock

40 / 51

#12. Washington County

- Percent susceptible area: 77.4%
- Total susceptible area: 590 square miles

#11. McDonald County

Roberto Galan // Shutterstock

41 / 51

#11. McDonald County

- Percent susceptible area: 78.2%
- Total susceptible area: 422 square miles

#10. Camden County

Lisa Fitzthum Photography // Shutterstock

42 / 51

#10. Camden County

- Percent susceptible area: 79.4%
- Total susceptible area: 534 square miles

#9. Iron County

Canva

43 / 51

#9. Iron County

- Percent susceptible area: 79.8%
- Total susceptible area: 440 square miles

#8. Douglas County

GoldenPhotoDesign // Shutterstock

44 / 51

#8. Douglas County

- Percent susceptible area: 79.9%
- Total susceptible area: 651 square miles

#7. Shannon County

Canva

45 / 51

#7. Shannon County

- Percent susceptible area: 80.1%
- Total susceptible area: 804 square miles

#6. Osage County

Patrick Jennings // Shutterstock

46 / 51

#6. Osage County

- Percent susceptible area: 80.5%
- Total susceptible area: 487 square miles

#5. Ozark County

Zack Frank // Shutterstock

47 / 51

#5. Ozark County

- Percent susceptible area: 80.9%
- Total susceptible area: 605 square miles

#4. Jefferson County

Canva

48 / 51

#4. Jefferson County

- Percent susceptible area: 82.7%
- Total susceptible area: 546 square miles

#3. Taney County

Lilith Munck // Shutterstock

49 / 51

#3. Taney County

- Percent susceptible area: 86.0%
- Total susceptible area: 549 square miles

#2. Stone County

Canva

50 / 51

#2. Stone County

- Percent susceptible area: 86.9%
- Total susceptible area: 411 square miles

#1. Reynolds County

Scott Sanders // Shutterstock

51 / 51

#1. Reynolds County

- Percent susceptible area: 89.5%
- Total susceptible area: 725 square miles

This story features data reporting and writing by Paxtyn Merten and is part of a series utilizing data automation across 50 states.