Does more spending mean better roads? Here are the best—and roughest—roads by state
Does more spending mean better roads? Here are the best—and roughest—roads by state
State and local governments spend billions each year on road maintenance and operations, but does it amount to better roads for taxpayers?
MoneyGeek analyzed data from the U.S. Department of Transportation and the U.S. Census Bureau to learn more about America's urban road infrastructure, find the states with the best and worst road quality and determine if more state spending translated to better roads.
Our findings suggest that taxpayers are not necessarily getting their money's worth. At best, they are getting just enough road investment to maintain the current condition of roads, but not enough to improve them. The analysis found:
- About 1 in 10 U.S. roads are in poor condition, but urban roads are even worse: 1 in 5 are in poor condition.
- California and Rhode Island were the states ranked worst for road roughness, with 44% and 41% of roads in poor condition, respectively.
- New Hampshire and Alabama had the best roads in the U.S. and spent some of the lowest capital outlay per mile ($9.82 and $6.44, respectively).
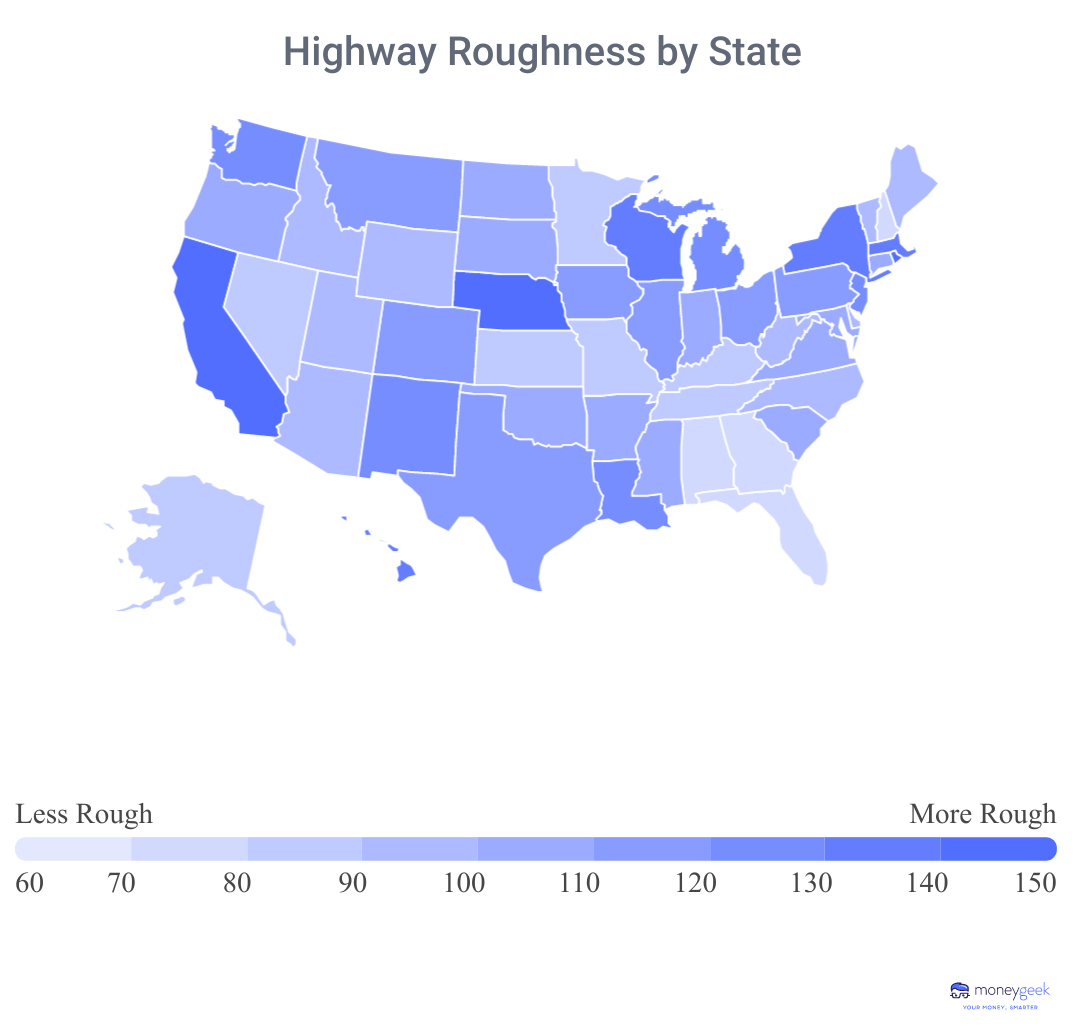
Comparing rough roads and infrastructure spending by state
MoneyGeek analyzed overall road quality and the investment levels per lane mile in every state and found that more spending on roads did not necessarily lead to better road quality.
The road roughness index is the weighted average value of the observed measurements of the international roughness index (IRI) for the state. The higher the score, the more rough the road is. The Federal Highway Administration indicates that an IRI measure of less than 95 indicates a road in good condition, between 95 and 170 is acceptable, and greater than 170 is poor condition.
For example, California's roughness index score of 160 means that the state's road conditions are borderline acceptable, on average. In reality, 44% of California's roads are in poor condition, the most of any state in the U.S.
These 10 states have the roughest roads in America
10. New Jersey
Average Road Roughness Score (higher = worse): 123
% of Roads in Poor Condition: 26%
% of Roads in Good Condition: 44%
Total Highway Spend: $6.9B
Spend Per Lane Mile: $30.39
9. Michigan
Average Road Roughness Score: 128
% of Roads in Poor Condition: 24%
% of Roads in Good Condition: 38%
Total Highway Spend: $7.8B
Spend Per Lane Mile: $7.74
8. Louisiana
Average Road Roughness Score: 128
% of Roads in Poor Condition: 26%
% of Roads in Good Condition: 36%
Total Highway Spend: $3.5B
Spend Per Lane Mile: $9.66
7. Massachusetts
Average Road Roughness Score: 131
% of Roads in Poor Condition: 31%
% of Roads in Good Condition: 37%
Total Highway Spend: $5.0B
Spend Per Lane Mile: $21.03
6. Hawaii
Average Road Roughness Score: 134
% of Roads in Poor Condition: 25%
% of Roads in Good Condition: 28%
Total Highway Spend: $1.0B
Spend Per Lane Mile: $28.87
5. New York
Average Road Roughness Score: 137
% of Roads in Poor Condition: 30%
% of Roads in Good Condition: 34%
Total Highway Spend: $16.6B
Spend Per Lane Mile: $24.84
4. Wisconsin
Average Road Roughness Score: 139
% of Roads in Poor Condition: 28%
% of Roads in Good Condition: 25%
Total Highway Spend: $7.5B
Spend Per Lane Mile: $11.32
3. Nebraska
Average Road Roughness Score: 141
% of Roads in Poor Condition: 33%
% of Roads in Good Condition: 33%
Total Highway Spend: $3.0B
Spend Per Lane Mile: $5.66
2. Rhode Island
Average Road Roughness Score: 149
% of Roads in Poor Condition: 41%
% of Roads in Good Condition: 27%
Total Highway Spend: $1.3B
Spend Per Lane Mile: $42.37
1. California
Average Road Roughness Score: 160
% of Roads in Poor Condition: 44%
% of Roads in Good Condition: 22%
Total Highway Spend: $32.0B
Spend Per Lane Mile: $23.16
5 states with the best roads
Every state in the nation has some bad and good roads. The following five states have the best road conditions on average, led by New Hampshire.
5. Minnesota
Average Road Roughness Score: 82
% of Roads in Poor Condition: 4%
% of Roads in Good Condition: 68%
Total Highway Spend: $8.6
Spend Per Lane Mile: $10.85
4. Florida
Average Road Roughness Score: 79
% of Roads in Poor Condition: 5%
% of Roads in Good Condition: 71%
Total Highway Spend: $20.4B
Spend Per Lane Mile: $29.37
3. Georgia
Average Road Roughness Score: 77
% of Roads in Poor Condition: 5%
% of Roads in Good Condition:72%
Total Highway Spend: $8.0B
Spend Per Lane Mile: $10.88
2. Alabama
Average Road Roughness Score: 74
% of Roads in Poor Condition: 5%
% of Roads in Good Condition: 75%
Total Highway Spend: $4.0B
Spend Per Lane Mile: $6.44
1. New Hampshire
Average Road Roughness Score: 71.9
% of Roads in Poor Condition: 7%
% of Roads in Good Condition: 74%
Total Highway Spend: $1.1B
Who pays for roads?
This analysis of all 50 states shows that states generally spend proportionately to the vehicle miles traveled; however, there are exceptions. New York and Pennsylvania both spend proportionately more than the vehicle miles traveled, and California spends proportionately less.
Regardless of how much money they spend on road conditions, data suggests that states are using available funds to maintain — not fix or improve — crumbling roads. Additionally, the analysis found that many of the most tax-friendly states in the U.S. had fairly good road quality. They are trying to keep roads in working order, just as states with higher taxes are.
Three-quarters of spending to maintain and fix roads and highways comes from state and local governments. According to the Urban Institute, the average state spends nearly 8% of its budget on roads. The rate of investment has not changed much over time. In 1977, 8% of state and local budgets combined went toward roads and highways, compared with 6% in 2017. It's no wonder state highways are the deadliest type of road in the U.S., accounting for 33% of all traffic fatalities.
Through the Highway Trust Fund (HTF), the federal government provides grants to states to maintain and improve the Interstate Highway System. Funded by transportation-related taxes such as gasoline and diesel taxes, the HTF spends more than it raises in revenue. According to the Congressional Budget Office (CBO), the fund ran a $16 billion deficit in 2020. The CBO's projections predict that the fund, which has relied on transfers from general tax funds since 2008, will be depleted by 2023.
Why are roads in good repair important?
Quality roads and highways are essential to the broader U.S. economy. Most consumer goods travel along the nation's highways, and investing in improving roads has historically boosted economic growth. Better roads mean lower costs to deliver goods due to lower maintenance and gas costs. The Infrastructure Investment and Jobs Act passed in late 2021 is expected to spur economic growth as funds are deployed on infrastructure projects including the repair of crumbling roads.
For the consumer, poor road conditions translate directly into higher car repair and maintenance costs. They may even have a harder time finding cheap car insurance due to increased claims. Drivers in states with rough road conditions that don't want to be left paying for damage due to potholes should purchase full coverage car insurance. Full coverage includes comprehensive and collision insurance which is the provision that insures damages to your car, unlike liability-only insurance which will only cover damages you owe to others in accidents where you are at fault. Adding comprehensive and collision insurance can cost drivers hundreds more every year, but there are affordable full coverage options and the coverage you get is worth it.
Methodology
MoneyGeek determined how states rank on the condition of their urban and suburban roads and their highway infrastructure spending by comparing the roughness measure of each state's urban and suburban highways and state and local (municipal and county) government expenditures on their highway system. We used the metrics below to establish final scores and rankings:
- Road Roughness Index: We developed a composite roughness score of all major urban roadways in each state by weighting each category of measured pavement roughness and aggregating this information across the entire state system.
- Percentage Poor vs. Good Condition: We designated each category of measured pavement roughness into larger groupings and compared the number of lane miles across the state by groupings of higher and lower pavement roughness.
Capital Outlays per Lane Mile: This value is calculated as the total state expenditure on capital outlays for highways divided by the total lane miles in each state's functional road system.
- Total Highway Spend: This value is calculated as the total state expenditure on both capital outlays and other expenditures for highways.
Sources
Congressional Budget Office. "Budget and Economic Data." Accessed October 21, 2021.
Urban Institute. "Highway and Road Expenditures." Accessed September 21, 2022.
U.S. Census. "2020 State & Local Government Finance Historical Datasets and Tables." Accessed September 13, 2022.
U.S. Department of Transportation. "Highway Statistics 2020 - Functional System Length - 2020." Accessed September 13, 2022.
U.S. Department of Transportation. "Highway Statistics 2020 - Annual Vehicle Miles." Accessed September 13, 2022.
U.S. Department of Transportation. "Highway Statistics 2020 - Functional System Lane-Length." Accessed September 13, 2022.
This story was produced by MoneyGeek and reviewed and distributed by Stacker Media.


