
How much value every state gets from the federal government
How much value every state gets from the federal government
As the United States faces a crucial decision concerning the future of its budget and debt ceiling, it is important to consider how this could affect individuals and state governments. To help put this into perspective, MoneyGeek analyzed which states are most dependent on the federal government. The analysis take into consideration political affiliation, net benefits that individuals and organizations in the state receive, state government revenue from federal sources and GDP per capita to assess which states are most dependent on federal funding.
KEY FINDINGS
- 7 of the 10 states most dependent on the federal government were Republican-voting, with the average red state receiving $1.05 per dollar sent to the IRS.
- Twenty-nine states sent more to the federal government than they received, compared to just nine states in 2021.
- Of the states that sent more than they received, 52% were Democrat-voting and 48% were Republican-voting.
- New Mexico had the highest return on federal spending of any state ($3.69), and Delaware had the lowest ($0.32).

Federal dependency rankings by state
To find the states in the U.S. that were most dependent on the federal government in 2022, MoneyGeek analyzed the return on taxes sent to the federal government and the percent of each state's revenue provided by the federal government. This analysis also compared states by political affiliation and per capita GDP to learn more about the factors that contribute to federal dependency.
The states that are the most federally dependent
11. Louisiana
Dependency Score: 44.7
Return on Tax Dollars (dollars received per dollar of federal taxes): $1.25
Federal Funding as % of State Revenue: 33%
GDP (in $M): $281,047
10. Alabama
Dependency Score: 46.2
Return on Tax Dollars: $1.80
Federal Funding as % of State Revenue: 27%
GDP (in $M): $275,396
9. Maine
Dependency Score: 47.2
Return on Tax Dollars: $1.72
Federal Funding as % of State Revenue: 28%
GDP (in $M): $83,514
8. Arizona
Dependency Score: 49.8
Return on Tax Dollars: $1.71
Federal Funding as % of State Revenue: 30%
GDP (in $M): $453,602
7. Vermont
Dependency Score: 54.9
Return on Tax Dollars: $1.50
Federal Funding as % of State Revenue: 36%
GDP (in $M): $40,249
6. Montana
Dependency Score: 50.8
Return on Tax Dollars: $1.59
Federal Funding as % of State Revenue: 32%
GDP (in $M): $64,757
5. Kentucky
Dependency Score: 57.8
Return on Tax Dollars: $1.89
Federal Funding as % of State Revenue: 32%
GDP (in $M): $258,293
4. Alaska
Dependency Score: 73
Return on Tax Dollars: $2.41
Federal Funding as % of State Revenue: 34%
GDP (in $M): $64,257
3. Mississippi
Dependency Score: 75
Return on Tax Dollars: $2.60
Federal Funding as % of State Revenue: 32%
GDP (in $M): $138,156
2. West Virginia
Dependency Score: 89.5
Return on Tax Dollars: $3.09
Federal Funding as % of State Revenue: 34%
GDP (in $M): $96,724
1. New Mexico
Dependency Score: 100
Return on Tax Dollars: $3.69
Federal Funding as % of State Revenue: 32%
GDP (in $M): $122,359
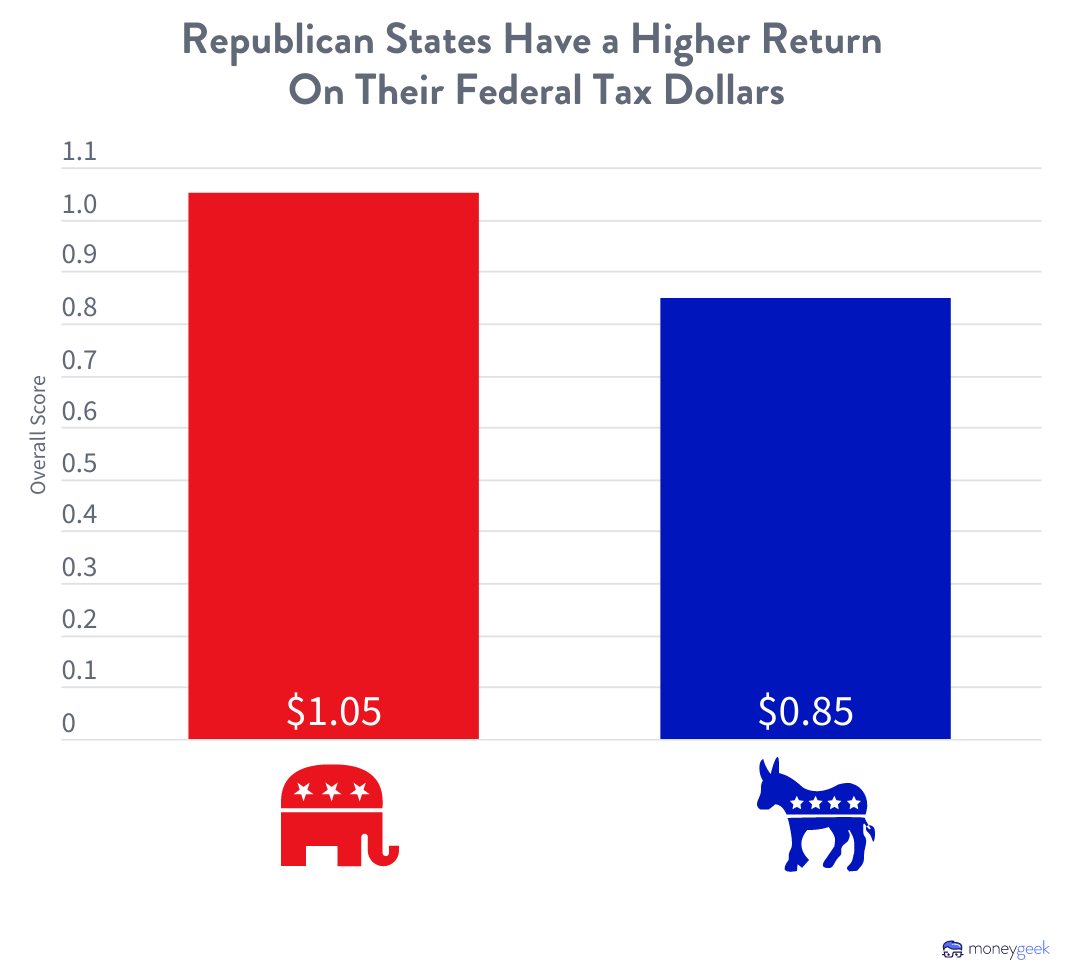
Red states lead with federal dependence
Democratic-leaning blue states tend to be wealthier and pay more to the federal government than they get. In contrast, Republican-leaning red states tend to have less wealth and receive more federal government funds than they pay. In the MoneyGeek rankings, 7 of the 10 most dependent states are considered red states.
Policy choices may partially explain this relationship.
"A really conservative state might choose to tax itself at a lower rate, which means by default, they can give fewer state-funded services," explains Kathy Fallon, human services practice area director at Public Consulting Group. "That can exacerbate the situation."
But a correlation between states' economic health and political affiliation may reflect economic factors beyond those explained by political philosophy.
"If red states pay less in taxes than they receive in benefits, that's because they are generally poorer and program rules are progressive — not because they are 'takers' while blue states are 'donors' in any value-laden sense," says Mark Shepard, assistant professor at the Harvard Kennedy School of Government and faculty research fellow at the National Bureau of Economic Research (NBER).
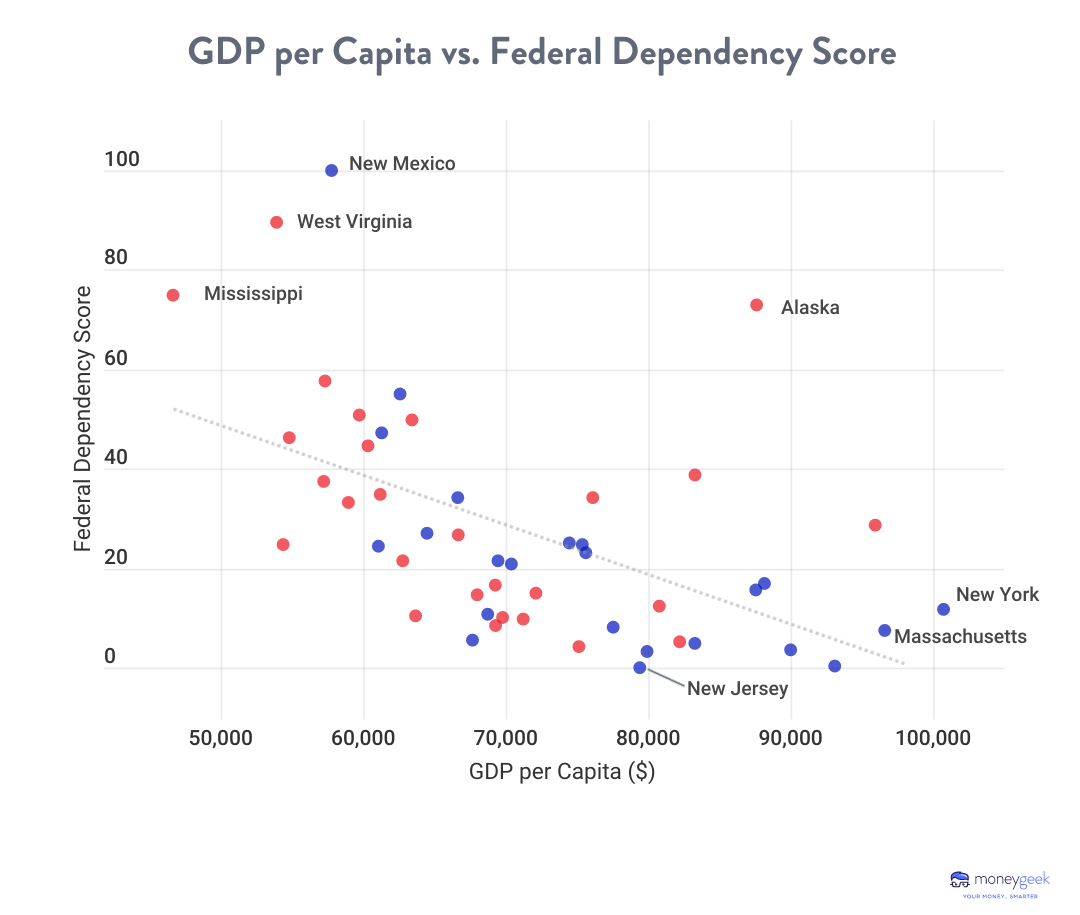
Higher GDP equals less federal dependence
MoneyGeek analysis shows that states with higher per capita GDP are less dependent on the federal government.
"Higher-income states produce the majority of the tax dollars that go into the federal government's pocket," Fallon says. Because of the higher income, states and their residents need less support and use fewer federal dollars.
Fallon noted that tax code changes have made wealthy states' contributions more pronounced.
"Before, people who paid large state income taxes would deduct those from their federal tax payments," she says. Now, state tax deductions are capped. "Ironically, it means the wealthier states' populations are paying even more."
Take action in your state
Taxes may be one of life's only two certainties — along with death — according to writing attributed to Benjamin Franklin. But how much you pay in taxes and what you get for your tax dollars can vary greatly depending on where you live and your income tax bracket.
Suppose you're in a state that provides net contributions to the federal government and, therefore, to other states. In that case, you may consider whether your policy priorities are reflected in how the federal government spends and distributes that contribution.
If your state receives more than it contributes, you might examine the role the federal government plays in the day-to-day life of your state. Educate yourself, decide how you feel about how your state budgets and spends money and show your approval or disapproval at the polls when you vote. No matter how divided the nation feels politically, states remain interconnected economically, bound to each other through tax contributions and receipts. Participating in the process and voting ensures that your voice is heard at the state and national level.

Methodology
When evaluating the states most dependent on the federal government in 2022, MoneyGeek created an overall score focused on two key metrics: return on taxes sent to the federal government and the percent of each state's revenue provided by the federal government. This final overall score was converted to a 100-point scale.
To determine the return on taxes sent to the federal government, MoneyGeek utilized reporting by the Internal Revenue Service (IRS) to identify the amount of taxes paid by the residents and businesses of each state for individual income tax, business income tax, estate and gift taxes, unemployment insurance taxes and excise taxes. Data from the Treasury Department was used on payments from the federal government to individuals and organizations within each state and calculated the monetary benefit provided by the federal government to each state relative to the amount of taxes provided by each state (Medicare payments were removed from this calculation as this information was consolidated to a handful of states). This metric was given a double weighting and converted to a 100-point scale for inclusion in the final score.
MoneyGeek defined each state as being Republican or Democrat-led based on its voting history in the past five presidential elections. States where the Democratic candidate won three out of the five elections were labeled as blue, and states where the republican candidate won three out of the five elections were labeled as red.
The percentage of each state's revenue provided by the federal government was calculated using information on each state's revenue sources collected by the U.S. Census. This metric was given a full weighting and converted to a 100-point scale for inclusion in the final score.
SOURCES
Bureau of Economic Analysis. "Gross Domestic Product by State, 1st Quarter 2021." Accessed October 7, 2022.
Internal Revenue Service. "SOI Tax Stats - Gross Collections, by Type of Tax and State - IRS Data Book Table 5." Accessed October 7, 2022.
USAspending.gov. "State Profiles." Accessed October 7, 2022.
U.S. Census Bureau. "2019 State & Local Government Finance Historical Datasets and Tables." Accessed October 7, 2022.
The Washington Post. "The final GOP tax bill is complete. Here's what is in it." Accessed October 17, 2020.
This story was produced by MoneyGeek and reviewed and distributed by Stacker Media.


