Warmest and coldest Februaries in Orleans County, New York history
Warmest and coldest Februaries in Orleans County, New York history
Every February, a groundhog predicts what the rest of winter will look like. Punxsutawney Phil, a rodent resident of Pennsylvania, may not be known for his accuracy. Data from the National Oceanic and Atmospheric Administration shows his forecast has only been accurate about 40% of the time. Still, he has become a symbol for that time of the year when people are ready to move on from the wintry cold weather to the warmer promises of spring.
Across much of the country, February is often the coldest month. The average temperature for the month from 1901-2000 in the contiguous U.S. was 33.82 degrees Fahrenheit. In 2023, it was above average, reaching 36.45 F.
The average February temperature in Orleans County, New York from 1901-2000 was 23.4 degrees.
Phil did not see his shadow on this year's Groundhog Day, a relatively rare occurrence meaning he is forecasting an early spring. He last saw no shadow in 2020, and the average contiguous U.S. temperature which followed was 2.36 degrees above the February average. That same year, March's temperature reached 4.58 degrees above the 1901-2000 average.
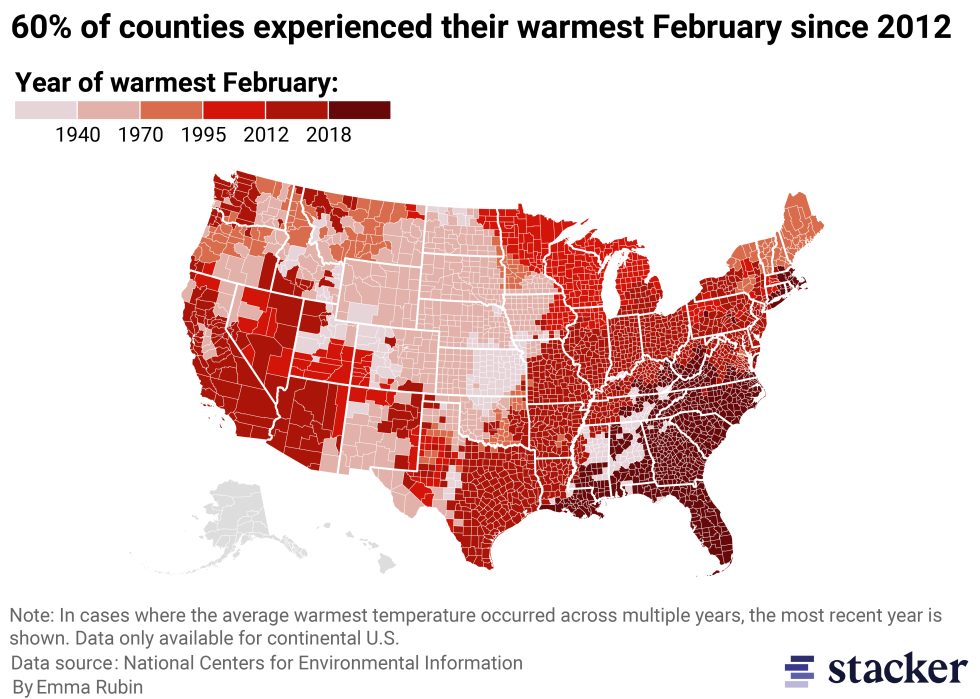
While individual years can always move against trends, February weather is trending warmer due to climate change, increasing by 2.89 degrees per century.
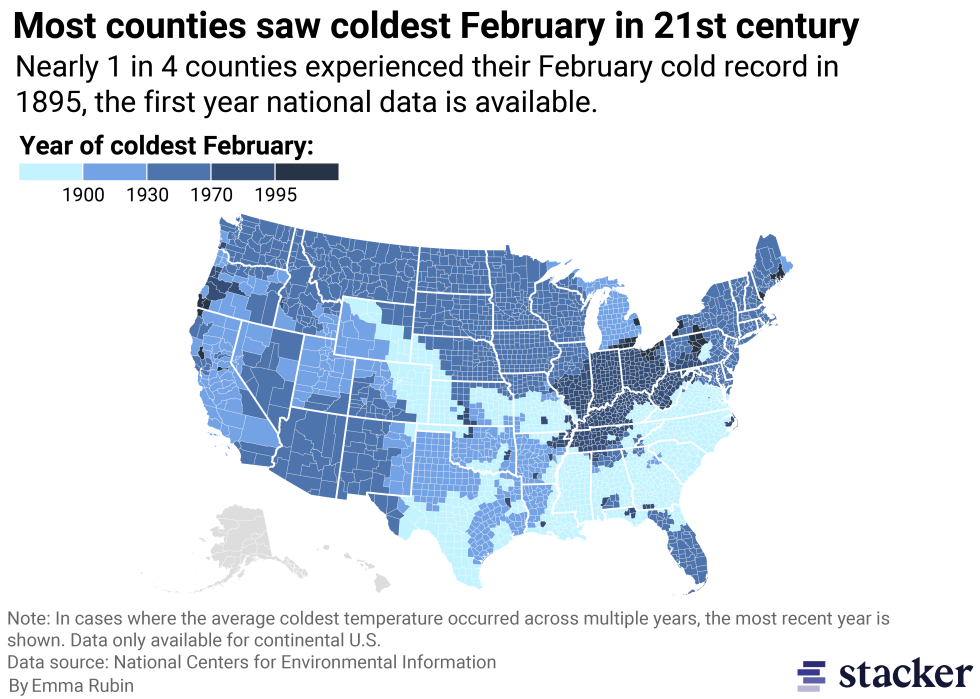
When did Orleans County, New York experience its warmest February? And what about its coldest? To find out, Stacker used data from the National Centers for Environmental Information to identify the 15 Februaries with the highest and lowest average temperatures since 1895. Also included is how that year's temperature compared to the 1901-2000 average.
The end of the month will soon reveal the accuracy of Phil's prediction for 2024. In this analysis, Stacker examined the range from 1895-2023.
Read on to see if you lived through the warmest and coldest February in Orleans County, New York history.
Warmest Februaries
#15. 1991
- Average temperature: 29.9 F
- 6.5 F above 1901-2000 average
#14. 2016
- Average temperature: 30.1 F
- 6.7 F above 1901-2000 average
#13. 1997
- Average temperature: 30.3 F
- 6.9 F above 1901-2000 average
#11. 1949 (tie)
- Average temperature: 30.4 F
- 7.0 F above 1901-2000 average
#11. 2018 (tie)
- Average temperature: 30.4 F
- 7.0 F above 1901-2000 average
#10. 1999
- Average temperature: 30.6 F
- 7.2 F above 1901-2000 average
#9. 2012
- Average temperature: 30.9 F
- 7.5 F above 1901-2000 average
#8. 2002
- Average temperature: 31.1 F
- 7.7 F above 1901-2000 average
#7. 1981
- Average temperature: 31.2 F
- 7.8 F above 1901-2000 average
#6. 2023
- Average temperature: 31.3 F
- 7.9 F above 1901-2000 average
#5. 1976
- Average temperature: 31.4 F
- 8.0 F above 1901-2000 average
#4. 1954
- Average temperature: 31.5 F
- 8.1 F above 1901-2000 average
#3. 1998
- Average temperature: 32.0 F
- 8.6 F above 1901-2000 average
#2. 1984
- Average temperature: 32.4 F
- 9.0 F above 1901-2000 average
#1. 2017
- Average temperature: 33.9 F
- 10.5 F above 1901-2000 average
Coldest Februaries
#15. 1912
- Average temperature: 17.9 F
- 5.5 F below 1901-2000 average
#14. 1916
- Average temperature: 17.6 F
- 5.8 F below 1901-2000 average
#13. 1907
- Average temperature: 17.5 F
- 5.9 F below 1901-2000 average
#12. 1963
- Average temperature: 17.4 F
- 6.0 F below 1901-2000 average
#11. 1917
- Average temperature: 17.1 F
- 6.3 F below 1901-2000 average
#10. 1936
- Average temperature: 16.2 F
- 7.2 F below 1901-2000 average
#8. 1901 (tie)
- Average temperature: 16.1 F
- 7.3 F below 1901-2000 average
#8. 1905 (tie)
- Average temperature: 16.1 F
- 7.3 F below 1901-2000 average
#7. 1978
- Average temperature: 15.6 F
- 7.8 F below 1901-2000 average
#6. 1895
- Average temperature: 15.3 F
- 8.1 F below 1901-2000 average
#5. 1904
- Average temperature: 15.0 F
- 8.4 F below 1901-2000 average
#4. 1914
- Average temperature: 14.6 F
- 8.8 F below 1901-2000 average
#3. 1979
- Average temperature: 13.6 F
- 9.8 F below 1901-2000 average
#2. 2015
- Average temperature: 11.7 F
- 11.7 F below 1901-2000 average
#1. 1934
- Average temperature: 9.7 F
- 13.7 F below 1901-2000 average
This story features data reporting and writing by Emma Rubin and is part of a series utilizing data automation across 3,093 counties.


