Counties with the most emergency shelters in North Carolina

Written by:
January 20, 2023
digidreamgrafix // Shutterstock

Counties with the most emergency shelters in North Carolina

As climate change drives weather to greater extremes, and devastating hurricanes, wildfires, droughts, and blizzards preoccupy an increasing number of Americans, it is hard to avoid comparing the reality of everyday news coverage to the computer-generated images seen in disaster movies.

Over the last 50 years, natural disasters have become five times more common due to climate change, according to the World Meteorological Organization. They've also become more economically debilitating—the five most expensive climate disasters in American history have all taken place over the last two decades.

The increasing frequency and severity of natural disasters means that the need for emergency evacuation and shelter plans has never been greater. According to the Federal Emergency Management Association, understanding your climate risk, or proximity to probable natural disaster, is an important first step for making a plan. Tools like the Climate Mapping for Resilience and Adaptation allow you to assess your risk by location.

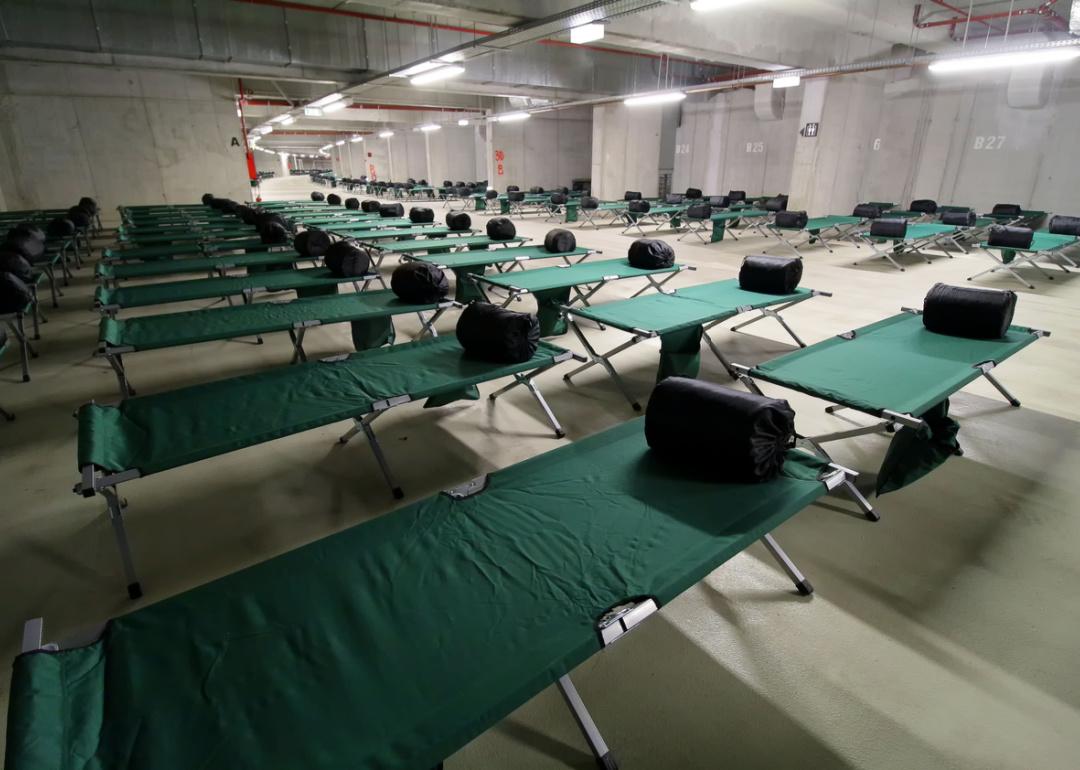
Knowing where nearby emergency shelters are located is another way to prepare for the worst. In the event of flooding, hurricane-level winds, or other disasters, emergency shelters offer a place to sleep, and also often provide food, water, and first aid services. Stacker examined the Department of Homeland Security's National Shelter System Facilities database to identify the counties with the most emergency shelters in North Carolina. Counties are ranked by emergency shelters per 100K people, with total capacity per 100K people serving as a tiebreaker.

1 / 50
Kenneth C. Zirkel // Wikimedia Commons

#50. Stanly County

- Emergency shelters per 100K people: 19.3 (12 shelters in database)
- Emergency shelter capacity per 100K: 6,698,838 people (4,163,194 total capacity)
- Shelters with generators: 4
- Shelters in 100-year floodplain: 0
2 / 50
Thomas T. Waterman, Photographer // Wikimedia Commons

#49. Camden County

- Emergency shelters per 100K people: 19.3 (2 shelters in database)
- Emergency shelter capacity per 100K: 6,907,959 people (715,181 total capacity)
- Shelters with generators: 0
- Shelters in 100-year floodplain: 2
3 / 50
Indy beetle // Wikimedia Commons

#48. Greene County

- Emergency shelters per 100K people: 19.5 (4 shelters in database)
- Emergency shelter capacity per 100K: 5,863,906 people (1,203,508 total capacity)
- Shelters with generators: 0
- Shelters in 100-year floodplain: 0
4 / 50
Indy beetle // Wikimedia Commons

#47. Pender County

- Emergency shelters per 100K people: 20.0 (12 shelters in database)
- Emergency shelter capacity per 100K: 5,031,035 people (3,016,810 total capacity)
- Shelters with generators: 6
- Shelters in 100-year floodplain: 0
5 / 50
Cecouchman // Wikimedia Commons

#46. Halifax County

- Emergency shelters per 100K people: 20.3 (10 shelters in database)
- Emergency shelter capacity per 100K: 5,312,810 people (2,618,737 total capacity)
- Shelters with generators: 0
- Shelters in 100-year floodplain: 0
6 / 50
Canva

#45. Haywood County

- Emergency shelters per 100K people: 21.1 (13 shelters in database)
- Emergency shelter capacity per 100K: 7,049,208 people (4,349,009 total capacity)
- Shelters with generators: 1
- Shelters in 100-year floodplain: 0
7 / 50
BrendaByrneGreene // Wikimedia Commons

#44. Nash County

- Emergency shelters per 100K people: 21.1 (20 shelters in database)
- Emergency shelter capacity per 100K: 5,835,264 people (5,521,794 total capacity)
- Shelters with generators: 0
- Shelters in 100-year floodplain: 0
8 / 50
Canva

#43. Hyde County

- Emergency shelters per 100K people: 21.3 (1 shelters in database)
- Emergency shelter capacity per 100K: 7,588,908 people (356,451 total capacity)
- Shelters with generators: 0
- Shelters in 100-year floodplain: 0
9 / 50
Tradewinds // Wikimedia Commons

#42. Jones County

- Emergency shelters per 100K people: 21.4 (2 shelters in database)
- Emergency shelter capacity per 100K: 5,902,348 people (550,453 total capacity)
- Shelters with generators: 0
- Shelters in 100-year floodplain: 0
10 / 50
MarkVanDykePhotography // Shutterstock

#41. Dare County

- Emergency shelters per 100K people: 21.8 (8 shelters in database)
- Emergency shelter capacity per 100K: 6,675,987 people (2,451,289 total capacity)
- Shelters with generators: 3
- Shelters in 100-year floodplain: 2
11 / 50
Nolichuckyjake // Shutterstock

#40. Catawba County

- Emergency shelters per 100K people: 23.1 (37 shelters in database)
- Emergency shelter capacity per 100K: 4,972,921 people (7,949,313 total capacity)
- Shelters with generators: 3
- Shelters in 100-year floodplain: 0
12 / 50
Nagel Photography // Shutterstock

#39. Buncombe County

- Emergency shelters per 100K people: 24.0 (64 shelters in database)
- Emergency shelter capacity per 100K: 5,915,037 people (15,792,024 total capacity)
- Shelters with generators: 3
- Shelters in 100-year floodplain: 0
13 / 50
G Keith Hall // Wikimedia Commons

#38. Surry County

- Emergency shelters per 100K people: 25.2 (18 shelters in database)
- Emergency shelter capacity per 100K: 5,492,486 people (3,923,777 total capacity)
- Shelters with generators: 1
- Shelters in 100-year floodplain: 0
14 / 50
gerrydincher // Wikimedia Commons

#37. Columbus County

- Emergency shelters per 100K people: 25.3 (13 shelters in database)
- Emergency shelter capacity per 100K: 6,507,563 people (3,349,703 total capacity)
- Shelters with generators: 2
- Shelters in 100-year floodplain: 0
15 / 50
Limozine // Wikimedia Commons

#36. Polk County

- Emergency shelters per 100K people: 25.8 (5 shelters in database)
- Emergency shelter capacity per 100K: 6,444,620 people (1,251,094 total capacity)
- Shelters with generators: 2
- Shelters in 100-year floodplain: 1
16 / 50
State Archives of North Carolina // Wikimedia Commons

#35. Edgecombe County

- Emergency shelters per 100K people: 26.2 (13 shelters in database)
- Emergency shelter capacity per 100K: 8,793,336 people (4,362,286 total capacity)
- Shelters with generators: 0
- Shelters in 100-year floodplain: 1
17 / 50
Doug Kerr from Albany, NY, United States // Wikimedia Commons

#34. Warren County

- Emergency shelters per 100K people: 26.5 (5 shelters in database)
- Emergency shelter capacity per 100K: 4,858,992 people (917,815 total capacity)
- Shelters with generators: 0
- Shelters in 100-year floodplain: 0
18 / 50
David Byron Keener // Shutterstock

#33. Beaufort County

- Emergency shelters per 100K people: 26.7 (12 shelters in database)
- Emergency shelter capacity per 100K: 5,574,311 people (2,502,754 total capacity)
- Shelters with generators: 1
- Shelters in 100-year floodplain: 0
19 / 50
Anthony Ricci // Shutterstock

#32. Henderson County

- Emergency shelters per 100K people: 26.8 (31 shelters in database)
- Emergency shelter capacity per 100K: 8,136,159 people (9,406,457 total capacity)
- Shelters with generators: 13
- Shelters in 100-year floodplain: 0
20 / 50
State Archives of North Carolina Raleigh, NC // Wikimedia Commons

#31. Sampson County

- Emergency shelters per 100K people: 26.9 (16 shelters in database)
- Emergency shelter capacity per 100K: 7,289,031 people (4,334,641 total capacity)
- Shelters with generators: 0
- Shelters in 100-year floodplain: 2
21 / 50
Shapard Wolf // Wikimedia Commons

#30. Yancey County

- Emergency shelters per 100K people: 27.2 (5 shelters in database)
- Emergency shelter capacity per 100K: 9,627,815 people (1,767,378 total capacity)
- Shelters with generators: 0
- Shelters in 100-year floodplain: 0
22 / 50
JNix // Shutterstock

#29. Macon County

- Emergency shelters per 100K people: 27.4 (10 shelters in database)
- Emergency shelter capacity per 100K: 9,611,801 people (3,511,383 total capacity)
- Shelters with generators: 3
- Shelters in 100-year floodplain: 1
23 / 50
Indy beetle // Wikimedia Commons

#28. Northampton County

- Emergency shelters per 100K people: 27.9 (5 shelters in database)
- Emergency shelter capacity per 100K: 9,731,110 people (1,743,523 total capacity)
- Shelters with generators: 0
- Shelters in 100-year floodplain: 0
24 / 50
AbeEzekowitz // Wikimedia Commons

#27. Jackson County

- Emergency shelters per 100K people: 27.9 (12 shelters in database)
- Emergency shelter capacity per 100K: 9,413,308 people (4,046,122 total capacity)
- Shelters with generators: 0
- Shelters in 100-year floodplain: 0
25 / 50
Upstateherd // Wikimedia Commons

#26. Gaston County

- Emergency shelters per 100K people: 28.3 (64 shelters in database)
- Emergency shelter capacity per 100K: 5,917,588 people (13,379,488 total capacity)
- Shelters with generators: 7
- Shelters in 100-year floodplain: 0
26 / 50
Indy beetle // Wikimedia Commons

#25. Gates County

- Emergency shelters per 100K people: 28.3 (3 shelters in database)
- Emergency shelter capacity per 100K: 6,832,492 people (723,151 total capacity)
- Shelters with generators: 0
- Shelters in 100-year floodplain: 0
27 / 50
CZmarlin — Christopher Ziemnowicz // Wikimedia Commons

#24. Hoke County

- Emergency shelters per 100K people: 28.8 (15 shelters in database)
- Emergency shelter capacity per 100K: 8,022,410 people (4,185,211 total capacity)
- Shelters with generators: 5
- Shelters in 100-year floodplain: 0
28 / 50
aceshot1 // Shutterstock

#23. Currituck County

- Emergency shelters per 100K people: 29.0 (8 shelters in database)
- Emergency shelter capacity per 100K: 7,111,119 people (1,960,891 total capacity)
- Shelters with generators: 5
- Shelters in 100-year floodplain: 5
29 / 50
HarmonyReignPope // Wikimedia Commons

#22. Tyrrell County

- Emergency shelters per 100K people: 29.1 (1 shelters in database)
- Emergency shelter capacity per 100K: 9,872,875 people (339,232 total capacity)
- Shelters with generators: 0
- Shelters in 100-year floodplain: 0
30 / 50
Ken Thomas // Wikimedia Commons

#21. Alexander County

- Emergency shelters per 100K people: 30.1 (11 shelters in database)
- Emergency shelter capacity per 100K: 7,819,942 people (2,853,575 total capacity)
- Shelters with generators: 1
- Shelters in 100-year floodplain: 0
31 / 50
Indy beetle // Wikimedia Commons

#20. Wayne County

- Emergency shelters per 100K people: 30.6 (36 shelters in database)
- Emergency shelter capacity per 100K: 5,874,172 people (6,913,430 total capacity)
- Shelters with generators: 1
- Shelters in 100-year floodplain: 0
32 / 50
Bryan Pollard // Shutterstock

#19. Orange County

- Emergency shelters per 100K people: 31.9 (47 shelters in database)
- Emergency shelter capacity per 100K: 5,766,737 people (8,498,787 total capacity)
- Shelters with generators: 1
- Shelters in 100-year floodplain: 1
33 / 50
Theresaperry44 // Wikimedia Commons

#18. Bertie County

- Emergency shelters per 100K people: 33.1 (6 shelters in database)
- Emergency shelter capacity per 100K: 11,381,160 people (2,060,559 total capacity)
- Shelters with generators: 0
- Shelters in 100-year floodplain: 0
34 / 50
Upstateherd // Wikimedia Commons

#17. Mitchell County

- Emergency shelters per 100K people: 33.4 (5 shelters in database)
- Emergency shelter capacity per 100K: 11,764,083 people (1,758,848 total capacity)
- Shelters with generators: 0
- Shelters in 100-year floodplain: 1
35 / 50
OptimumPx // Wikimedia Commons

#16. Cleveland County

- Emergency shelters per 100K people: 34.4 (34 shelters in database)
- Emergency shelter capacity per 100K: 11,508,656 people (11,381,831 total capacity)
- Shelters with generators: 10
- Shelters in 100-year floodplain: 1
36 / 50
Nikola Spasic Photography // Shutterstock

#15. Pitt County

- Emergency shelters per 100K people: 35.2 (60 shelters in database)
- Emergency shelter capacity per 100K: 8,611,373 people (14,691,002 total capacity)
- Shelters with generators: 0
- Shelters in 100-year floodplain: 1
37 / 50
Ammodramus // Wikimedia Commons

#14. Wilson County

- Emergency shelters per 100K people: 35.5 (28 shelters in database)
- Emergency shelter capacity per 100K: 10,108,453 people (7,969,909 total capacity)
- Shelters with generators: 1
- Shelters in 100-year floodplain: 0
38 / 50
Nolichuckyjake // Shutterstock

#13. Rutherford County

- Emergency shelters per 100K people: 35.6 (23 shelters in database)
- Emergency shelter capacity per 100K: 7,958,730 people (5,140,703 total capacity)
- Shelters with generators: 16
- Shelters in 100-year floodplain: 0
39 / 50
Ymblanter // Wikimedia Commons

#12. Washington County

- Emergency shelters per 100K people: 35.8 (4 shelters in database)
- Emergency shelter capacity per 100K: 12,733,774 people (1,424,018 total capacity)
- Shelters with generators: 0
- Shelters in 100-year floodplain: 0
40 / 50
Jacalyn Engler // Wikimedia Commons

#11. Stokes County

- Emergency shelters per 100K people: 35.9 (16 shelters in database)
- Emergency shelter capacity per 100K: 8,864,499 people (3,952,503 total capacity)
- Shelters with generators: 3
- Shelters in 100-year floodplain: 0
41 / 50
RnR // Wikimedia Commons

#10. McDowell County

- Emergency shelters per 100K people: 35.9 (16 shelters in database)
- Emergency shelter capacity per 100K: 10,111,638 people (4,502,409 total capacity)
- Shelters with generators: 0
- Shelters in 100-year floodplain: 0
42 / 50
G Keith Hall // Wikimedia Commons

#9. Watauga County

- Emergency shelters per 100K people: 37.0 (20 shelters in database)
- Emergency shelter capacity per 100K: 9,045,938 people (4,891,772 total capacity)
- Shelters with generators: 0
- Shelters in 100-year floodplain: 0
43 / 50
Alanteitleman // Wikimedia Commons

#8. Martin County

- Emergency shelters per 100K people: 40.5 (9 shelters in database)
- Emergency shelter capacity per 100K: 8,402,138 people (1,866,367 total capacity)
- Shelters with generators: 1
- Shelters in 100-year floodplain: 0
44 / 50
Toribio93 // Shutterstock

#7. Madison County

- Emergency shelters per 100K people: 42.3 (9 shelters in database)
- Emergency shelter capacity per 100K: 10,072,834 people (2,142,391 total capacity)
- Shelters with generators: 0
- Shelters in 100-year floodplain: 0
45 / 50
Bethbrownebooks // Wikimedia Commons

#6. Chowan County

- Emergency shelters per 100K people: 43.5 (6 shelters in database)
- Emergency shelter capacity per 100K: 11,634,756 people (1,605,131 total capacity)
- Shelters with generators: 1
- Shelters in 100-year floodplain: 0
46 / 50
Susan C. Griffin // Wikimedia Commons

#5. Perquimans County

- Emergency shelters per 100K people: 53.8 (7 shelters in database)
- Emergency shelter capacity per 100K: 14,621,843 people (1,901,132 total capacity)
- Shelters with generators: 1
- Shelters in 100-year floodplain: 0
47 / 50
Warren LeMay from Cincinnati, OH, United States // Wikimedia Commons

#4. Transylvania County

- Emergency shelters per 100K people: 57.6 (19 shelters in database)
- Emergency shelter capacity per 100K: 18,312,826 people (6,039,387 total capacity)
- Shelters with generators: 2
- Shelters in 100-year floodplain: 0
48 / 50
Canva

#3. Avery County

- Emergency shelters per 100K people: 62.0 (11 shelters in database)
- Emergency shelter capacity per 100K: 17,308,001 people (3,071,651 total capacity)
- Shelters with generators: 1
- Shelters in 100-year floodplain: 0
49 / 50
Brian Stansberry // Wikimedia Commons

#2. Swain County

- Emergency shelters per 100K people: 84.7 (12 shelters in database)
- Emergency shelter capacity per 100K: 29,974,171 people (4,246,141 total capacity)
- Shelters with generators: 0
- Shelters in 100-year floodplain: 1
50 / 50
digidreamgrafix // Shutterstock

#1. Graham County

- Emergency shelters per 100K people: 148.3 (12 shelters in database)
- Emergency shelter capacity per 100K: 52,236,445 people (4,225,406 total capacity)
- Shelters with generators: 0
- Shelters in 100-year floodplain: 0

Trending Now