North Dakota has 3 of the 20 counties that have seen the biggest growth in housing over the last decade
This story originally appeared on Better Mortgage and was produced and distributed in partnership with Stacker Studio.
North Dakota has 3 of the 20 counties that have seen the biggest growth in housing over the last decade
For the last couple of years, headlines about the housing market have dominated the news cycles. From housing shortages to sky-high home prices, we’ve all heard about how the pandemic has affected nearly every housing market across the nation. Many of us have experienced the phenomenon firsthand. But while the pandemic has certainly had an impact on the housing market, there are plenty of other factors that have spurred housing growth in counties across the nation—and these factors aren’t as widely discussed.
Take, for example, the massive impact the oil boom has had on housing in the Midwest. Between 2007 and 2012, employment in North Dakota’s oil and gas industry increased by 354%, resulting in a 19% population growth in western North Dakota alone. As oil companies—and oilfield employees—continue to move in, sleepy towns and counties have been upended by the sudden influx of residents. While more jobs may boost the economy, the rapid growth can also leave cities struggling to keep up with demands for health services, roads, transportation, and housing.
So which counties have seen the biggest housing growth over the last decade—and why? Better Mortgage, an online lender and homeownership platform with a free mortgage calculator, used data from the U.S. Census Bureau's decennial census to calculate which counties have seen the greatest increase in housing units over the last 10 years. The counties are ranked according to the percent change in housing units between 2010-2020, and the top 20 counties with the biggest growth in housing were selected for the national story. Census data on housing was released on August 12, 2021 for all counties in America. Here’s what you should know about your state.
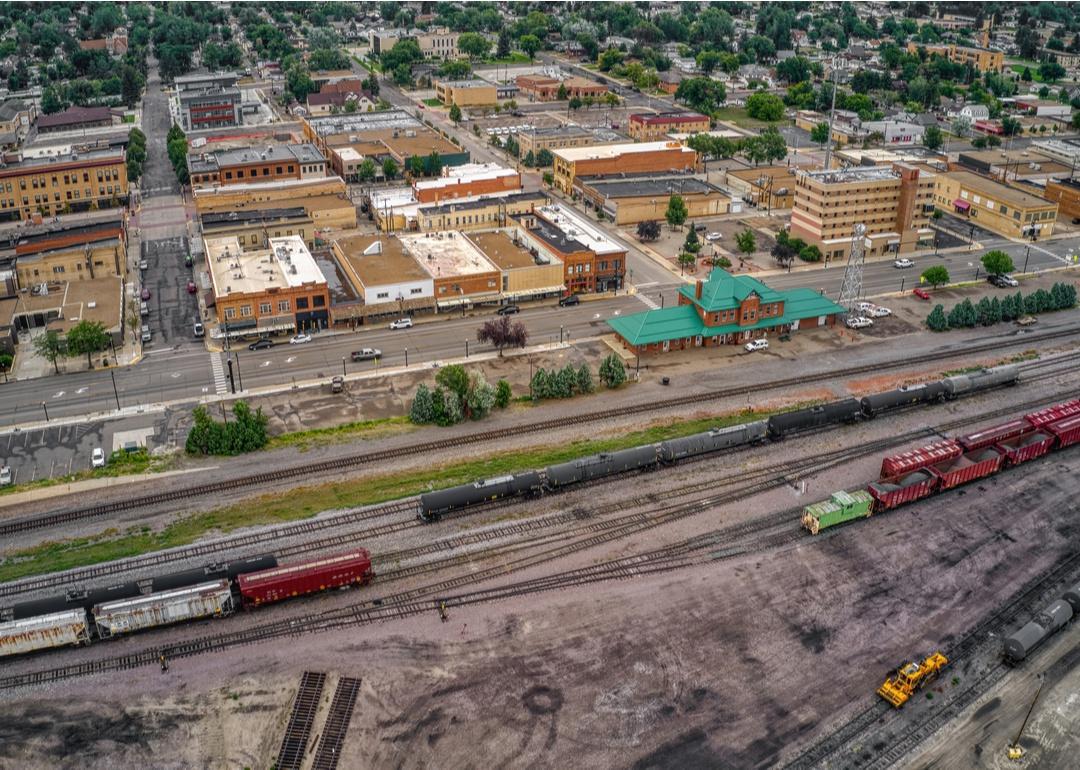
North Dakota by the numbers
#8. Stark County- Change in housing units (2010–2020): 4,646 (+43.3% since 2010)
- Housing units (2020): 15,381
- Housing units (2010): 10,735
The oil industry has had a huge impact on the population in Stark County, North Dakota. Thanks to a wealth of oil resources, the local economy is booming—and jobs in the oil field are plentiful. From 2010 to 2020, the population in Stark County grew by over 20% as new residents poured into North Dakota for jobs in the high-paying field. In turn, more new housing was needed to accommodate all of the new residents. Developers met the challenge, building thousands of new housing units, which contributed to the massive growth in this county.
#2. Williams County- Change in housing units (2010–2020): 9,763 (+93.3% since 2010)
- Housing units (2020): 20,227
- Housing units (2010): 10,464
Like other areas of North Dakota, Williams County has seen phenomenal growth in population since 2010, largely due to an explosion in oil industry jobs in the area, which has lured new residents with high-paying work opportunities. Prior to the oil boom, housing demand was limited in sleepy Williams County, but new residents flocking in for work have led to a huge uptick in housing inventory. However, oilfield work tends to be transient as workers come and go on a regular basis. This has caused a higher home vacancy rate than normal in this county.
#1. McKenzie County- Change in housing units (2010–2020): 4,571 (+147.9% since 2010)
- Housing units (2020): 7,661
- Housing units (2010): 3,090
The oil industry has made its mark in McKenzie County, North Dakota, and as a result, the county has experienced a boom in population over the last 10 years. In 2010, the county had just over 6,000 residents. According to the 2020 Census, that number now stands at more than 14,000, and every one of them is in need of housing. But while significantly more housing was built to help address the issue, the transient nature of oil industry work has resulted in a housing unit vacancy rate much higher than normal.
Counties across the nation have experienced unprecedented housing growth over the last decade, and the causes of this growth are as varied as the counties themselves. In some cases, the growth has been due to urban sprawl. In others, the high cost of housing in large metros has pushed residents out to more affordable areas. And in some parts of the Midwest, the oil boom has been directly responsible for the housing growth. Whether or not these explosive growth rates will continue remains to be seen, but due to a conflation of socioeconomic factors in these aforementioned areas of the nation, that trend is likely to continue in the immediate future.
In other areas of the nation, rapid rates of housing growth have other catalysts, including urban sprawl and economic growth. And, in rare cases, growth can even be caused by an unprecedented influx of retirees relocating to the area. The only consistent factor across these counties is that the subsequent housing growth has had a big impact on the housing market.
Keep reading to see which counties have been at the top of the housing market boom over the last decade.
Counties that have seen the biggest growth in housing over the last decade
#1. McKenzie County, North Dakota: 4,571 housing units added 2010-2020 (+147.9% since 2010)
#2. Williams County, North Dakota: 9,763 housing units added 2010-2020 (+93.3% since 2010)
#3. Hays County, Texas: 34,117 housing units added 2010-2020 (+57.4% since 2010)
#4. Dallas County, Iowa: 13,865 housing units added 2010-2020 (+50.9% since 2010)
#5. Comal County, Texas: 22,831 housing units added 2010-2020 (+48.5% since 2010)


