
Warmest Decembers in Klamath County, Oregon history
Warmest Decembers in Klamath County, Oregon history
The popular image of an idyllic December is one of white Christmases, hot chocolate retreats, snow-capped conifers, and cozy, cold-weather activities. But not every December lives up to those expectations.
Most of the continental U.S. will experience its peak winter cold weather in January and February. Officially, winter doesn't even start until Dec. 21.
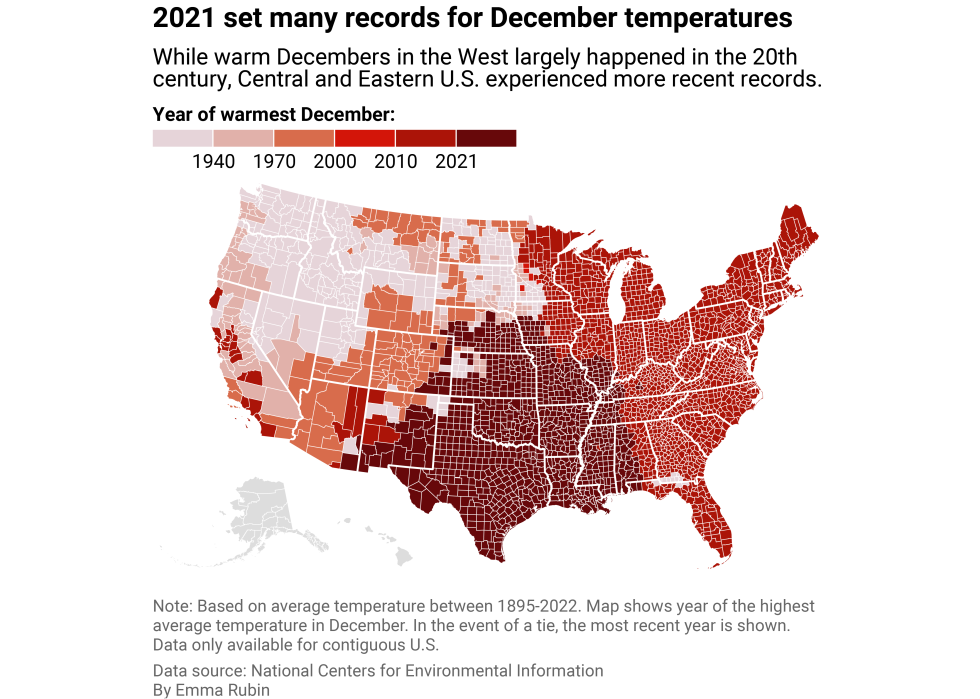
Across the U.S., the average December temperature from 1901-2000 was right above freezing point, at 32.68 F. Yearly temperatures can be compared to this 20th-century long-term average to find how uncommon a year's December climate was. The nation's warmest December on record was 2021, when the average temperature reached 6.66 F above the long-term average, at 39.34 F. December 2022 was closer to the previous century's average for the U.S. overall, at 33.08 F.
The average temperature in Klamath County, Oregon from 1901-2000 was 28.8.
A look across the U.S.
The diverse climates of the U.S. mean residents can experience a range of holiday weather without breaking out their passports. Within the continental U.S., Monroe County, Florida, at the Southeast tip of the state, reported the highest average December temperature during the past century at 67.6 F. On the other end of the spectrum was Roseau County, Minnesota, bordering Canada, at 7.2 F.
However, across both sides of the extremes, temperatures are warming. While that doesn't mean every December will be warmer than the last or the prior century's average, it does mean long-term temperature averages will continue to inch up the thermometer.
When did Klamath County, Oregon experience its warmest December? To find out, Stacker used data from the National Centers for Environmental Information to identify the 15 Decembers with the highest average temperature since 1895. Also included is how that year's temperature compared to the 1901-2000 average.
Read on to see if you lived through the warmest December in Klamath County, Oregon history.
#15. 1973
- Average temperature: 32.4 F
- 3.6 F above 1901-2000 average
#13. 1975 (tie)
- Average temperature: 32.6 F
- 3.8 F above 1901-2000 average
#13. 1963 (tie)
- Average temperature: 32.6 F
- 3.8 F above 1901-2000 average
#12. 2004
- Average temperature: 32.7 F
- 3.9 F above 1901-2000 average
#11. 1937
- Average temperature: 32.8 F
- 4.0 F above 1901-2000 average
#10. 1989
- Average temperature: 32.9 F
- 4.1 F above 1901-2000 average
#9. 1981
- Average temperature: 33.0 F
- 4.2 F above 1901-2000 average
#8. 1933
- Average temperature: 33.1 F
- 4.3 F above 1901-2000 average
#7. 2014
- Average temperature: 33.2 F
- 4.4 F above 1901-2000 average
#6. 1962
- Average temperature: 33.8 F
- 5.0 F above 1901-2000 average
#5. 1939
- Average temperature: 34.0 F
- 5.2 F above 1901-2000 average
#4. 1917
- Average temperature: 34.3 F
- 5.5 F above 1901-2000 average
#3. 1929
- Average temperature: 34.7 F
- 5.9 F above 1901-2000 average
#2. 1950
- Average temperature: 35.7 F
- 6.9 F above 1901-2000 average
#1. 1958
- Average temperature: 36.4 F
- 7.6 F above 1901-2000 average


