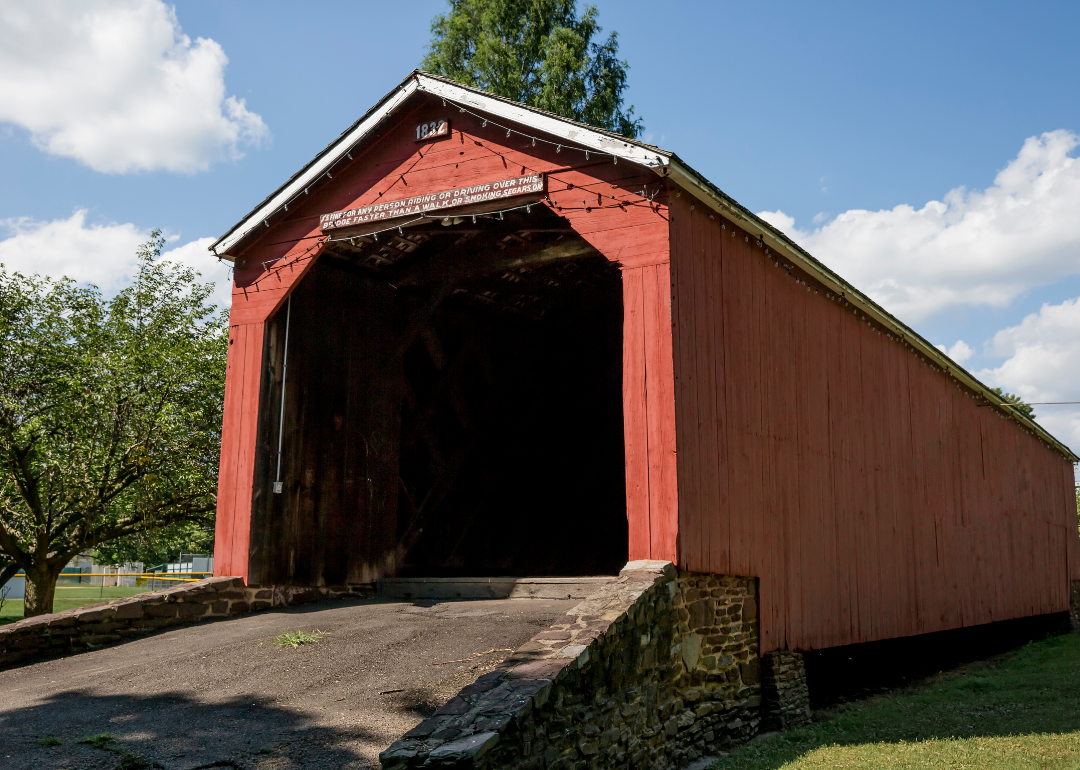
Counties in Pennsylvania with more precipitation over the past year than average
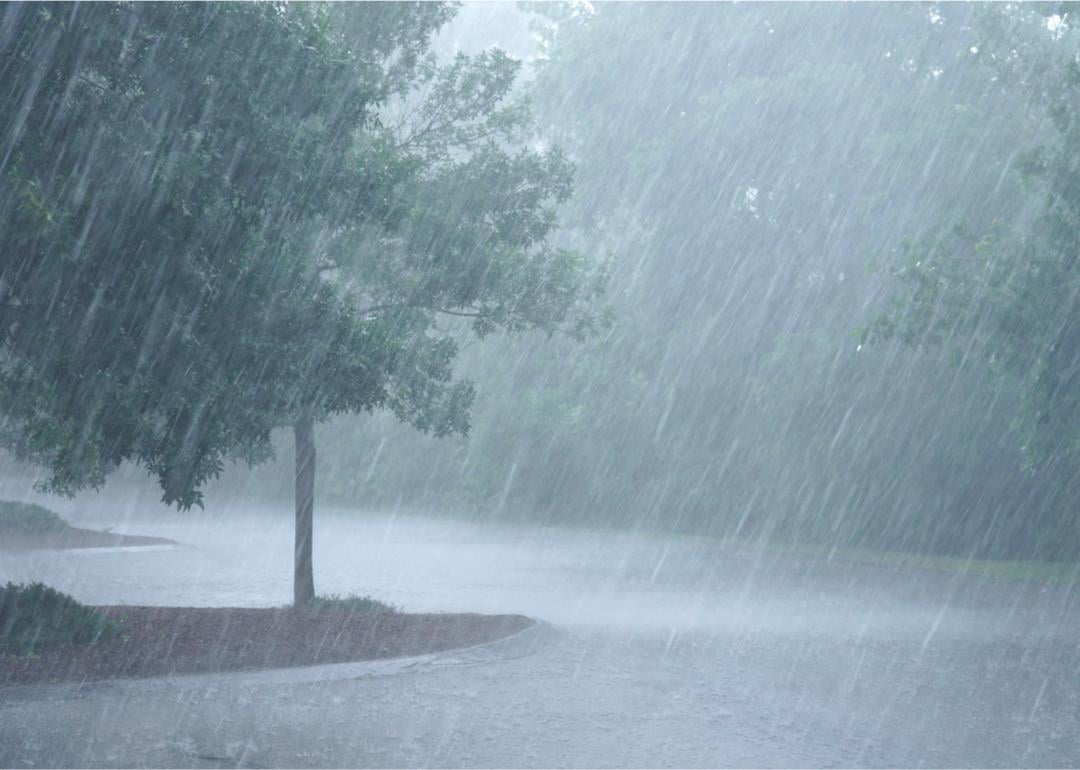
During the past winter, parts of California experienced massive amounts of rain and snow. Though it momentarily eased the frequent drought periods that had been affecting the state, the surge in rainfall flooded roads, knocked out power, and broke levees. Fueled by multiple converging atmospheric rivers, the state's infrastructure was not able to capture all of the excess water, meaning water shortages could again return during future dry spells.
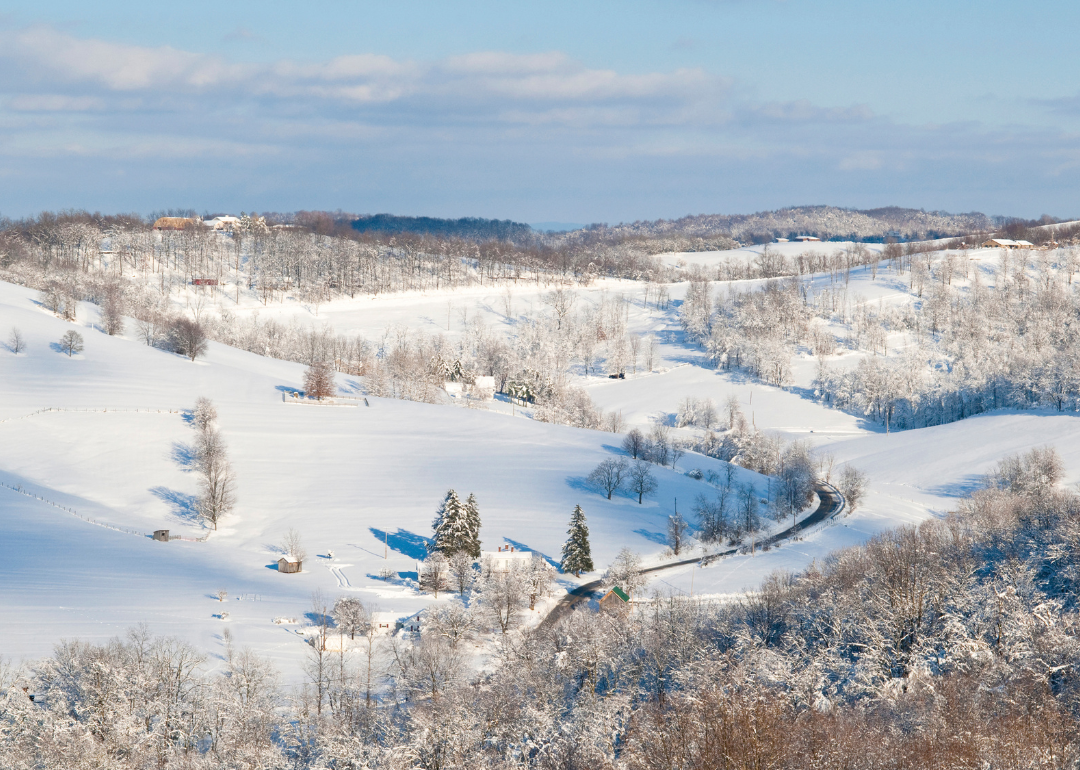
Climate change can both intensify rainfall and also extend droughts. Warmer temperatures increase rates of evaporation, pulling more water from the ocean and causing more precipitation overall. Data indicates single-day precipitation extremes are happening more frequently. Conversely, more evaporation also dries out surface water and soil, leaving less fresh water available. Even as the moist air from oceans and other sources returns to land as rain, sleet, or snow, inconsistent wind patterns and currents mean it isn't distributed evenly. That's why even as some counties experienced their wettest year on record, others experienced their driest.
Nationwide, 43% of counties reported precipitation over the past year greater than their long-term average. A 1,000-year event dumped 25 inches of rainfall over 24 hours in Fort Lauderdale on April 13. Nevada desert regions experienced thunderstorms and heavy rain in June. Severe weather through the mid-Atlantic in August brought tennis ball-sized hail to West Virginia and softball-sized hail and flash flooding in Maryland.
Using data from the National Centers for Environmental Information, Stacker identified counties in Pennsylvania that received the most precipitation from September 2022 to August 2023 compared to their average annual precipitation from 1901 to 2000. In the case of a tie, the amount of precipitation over the past year served as a tiebreaker.
Read on to see which counties reported more precipitation over the past year than usual.